Posts Tagged ‘Metrorail’

Prioritizing Bike and Pedestrian Station Access Projects Near Metrorail, Part 2

November 24th, 2015 Comments off

Other than ridership potential, what are some of the other ways we can rank access projects relative to each other?

In our last post, we discussed how bike and pedestrian access projects relate back to ridership and how that relationship could be used to prioritize projects. In this post, we talk about some of the other criteria we are using to prioritize projects.

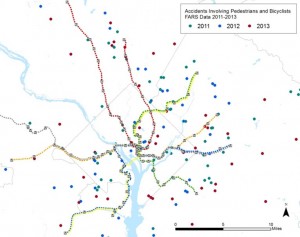
Bike and Ped. Fatalities, Sample Data Set

Bike and Pedestrian Fatalities, Sample Data Set

The first is safety. We are pulling together data about bike and pedestrian crashes near our stations that result in injuries or fatalities. We will then link these data in GIS back to the location the project, with the idea being that a new crosswalk or dedicated bike path in an area with a lot of recent crashes should score higher and deserves more attention. A safer path of travel helps not only our customers but all walkers and cyclists in these areas.

We also want to explore some other prioritization criteria. Here is what we have come up with: Read more…

Beyond Rush Hour – Taking a Peek at the Off-Peak

November 18th, 2015 3 comments

Metrorail ridership isn’t only about rush hour! Here’s a deeper look at why off-peak riders travel, and what segments are most traveled.

You may not be surprised that the peak period travel on Metrorail is dominated by commuting and business related trips.  Every day from opening to 9:30am, nearly 90 percent of passengers travel to work and business.  However do you know that over almost a third of daily ridership takes place in the off peak?  This post explores what is happening during weekday off-peak periods.

The weekday “off-peak” time typically refers to the weekday midday period (9:30am to 3:00pm) and the weekday evening period (from 7:00pm to closing), excluding late night service on Friday and Saturdays between midnight and 3:00am. In recent years, weekday off-peak travel demand has remained stable at 32 percent of the daily ridership, with the midday ridership at 19-20 percent and the evening ridership at 12 percent.

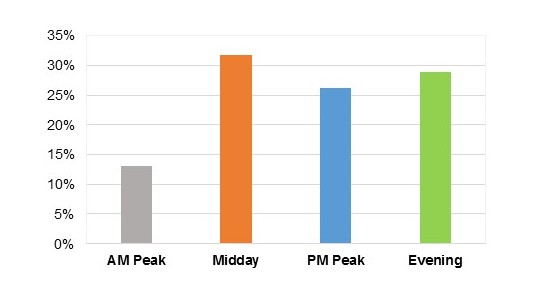
Most non-work trips, such as personal, recreational, and shopping trips, occur during the off-peak times and are spread fairly evenly between the midday and evening, as illustrated in Figure 1. 

blog figure

Figure 1: Percentage of Non-Work Trips by Time of Day (2012 Metrorail Passenger Survey)


The off-peak, non-work travel market has showed strong growth between 2007 and 2012 (our last two passenger surveys where we can distinguish between work and non-work travel). According to the Metrorail passenger surveys, off-peak non-work trips grew by 15 percent for the midday and evening from 2007 to 2012, higher than the 9 percent increase in the daily non-work trips. Read more…

Transit-Oriented Development’s Return on Investment

November 16th, 2015 Comments off

For at least the past decade, the region’s real estate has revolved around transit.  That is expected to continue for the next decade, and we can already see signs of its impact along the Silver Line, according to a new report.

We’ve been highlighting the impact that Metro has on the regional economy for many years now.  From the Regional Benefits of Transit study which highlighted the quarter of a billion dollars in incremental tax revenue that the jurisdictions enjoy each year solely because of Metro, to recent data which highlights that almost all of the development pipeline in the D.C. region is within walking distance of Metrorail, it’s crystal clear that this region’s economic future is inextricably linked to Metro.

Joining the library of compelling evidence of this is recent information from CoStar and Transwestern.  They have been monitoring the development pipeline and activity in the region and have had a special eye trained on the Silver Line.  Here’s what they found: Read more…

Help Your Community by Joining Ours

October 15th, 2015 Comments off

Join Metro’s New “Amplify” Customer Community

metro_amplify_negative_80715Would you like to gain insight into Metro’s direction and help shape new initiatives? Are you looking for an opportunity to share your rider experiences and make a difference in how Metro responds to issues that face you and your fellow riders?

Join Amplify, Metro’s first-ever Customer Community and newest tool for engaging customers like you in day-to-day decision making.  The Amplify community will include everyday customers who ride Metro’s Bus, Rail and MetroAccess services, as well as the Riders’ Advisory Council members and transit professionals.

Amplify community members will be provided a forum for on-going engagement with fellow riders and Metro staff through online surveys, discussions and polls. Community members will also receive regular updates on news and events.

Visit amplifybymetro.com to apply to be an Amplify community member and help shape our region’s public transit service now and into the future.

Metro Studying Ways to Improve Bike/Ped Access to Stations

October 7th, 2015 Comments off

Improving walk and bike access is a cost effective way to increase ridership and improve the efficiency of the Metrorail network.   Where are these improvements needed and how should we (as a region) prioritize them?

Landover Walkshed

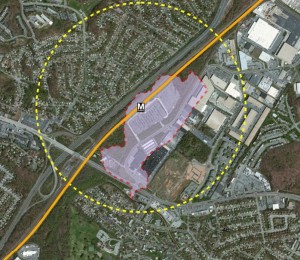
What projects might increase the size of the walk shed of the Landover Metrorail station?

In a number of earlier posts starting last summer, we’ve discussed the concept of walk sheds and explored the relationship between walkability, land use, and Metrorail ridership.  One conclusion of this effort:  grow the size of the walk shed and you’ll grow ridership.

Generally, we only have control over what happens on our own property.  While we have made great strides in identifying and prioritizing bike/ped access improvements on our own property, increasing the size of the walk sheds requires coordination with state or local agencies who own, plan, design and construct roads, sidewalks and pathways near our stations.  We know that in order to have a larger impact on walk and bike access, we need to cast a wider net and identify projects that are up to one mile from our station entrance.  We have created a plan — the Station Access Investment Strategy — to highlight some of these projects as priorities for our local partners to use as they develop their capital improvement plans. Read more…

Brookland-CUA Station Rises to the Challenge of Papal Proportions

October 5th, 2015 1 comment

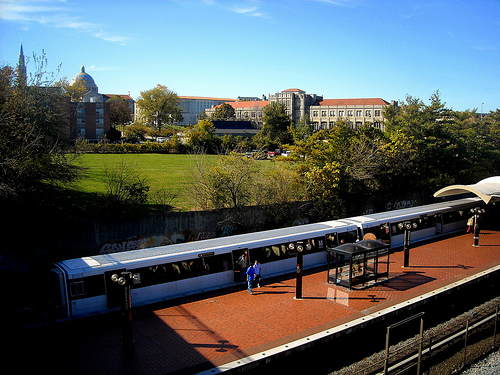
Brookland-CUA station enabled over 24,000 trips for visitors attending the papal events at the Basilica on Wednesday, September 23, 2015. 

Brookland-CUA Metro station in Washington The Basilica of the National Shrine of the Immaculate Conception on the Catholic University of America campus is in the background. Photo Credit: AgnosticPreachersKid at English Wikipedia

Metrorail can handle crowds for most events downtown where the demand can be shared across a variety of stations and lines.   The papal mass at the Basilica of the Shrine of the Immaculate Conception, however, required a little extra planning.  The Secret Service was in charge of the regional planning of the event, and as the event approached Metro staff became aware the event would have a ticketed attendance of 25,000 people and that an additional 15,000 people might amass outside the venue to watch the ceremony on the jumbo-trons and try to catch a glimpse of the Pope on his way in and out of the area.  Preparing to enable safe and efficient trips for up to 40,000 customers at a station with one of the smallest capacities in the system required some extra effort. Read more…

Ask the Professors – How Local Land Use Decisions Impact Metrorail Ridership

August 24th, 2015 1 comment

This post is guest-written by Chao Liu, Hiro Iseki, and Gerrit Knaap, researchers from University of Maryland’s National Center for Smart Growth, who helped Metro develop our Land Use Ridership Model.

Even though Metro doesn’t control where new jobs and households locate in the region, these decisions are critical to the agency’s ridership and financial future. 

It is well known that the form and intensity of development in and near rail transit station areas can have measurable impacts on transit ridership.  For these reasons, transit oriented developments (TOD) generally feature high-density construction, mixed land uses, and bike and pedestrian friendly infrastructure.  But not all TODs are alike, and the effects of TOD on transit ridership are likely to depend on how well the station is connected both locally and regionally, whether the station is near the center or end of a transit corridor, and what kinds of jobs and household are located nearby.

To explore how different forms of development might impact ridership on the Washington Metrorail system, Dr. Hiroyuki Iseki and Dr. Chao Liu assisted Metro to develop a direct ridership model (DRM), called Metro’s Land Use Ridership Model.  A DRM uses statistical techniques to quantify the relationship between entries and exits at rail stations and land uses nearby.  This model can then be used to estimate the number of passengers who will access the station, by waking or biking, as a result of changes in land use features, transit service characteristics, and socio-demographics within the walkshed of any given station.

The direct ridership model includes a large number of variables for each station, including the density, diversity, and design of local environment; transit service and connectivity; job accessibility by auto and transit; walk score; the availability of parking; the demographics of nearby residents; the number and types of jobs nearby, and more.  The model was estimated for the AM Peak, Midday, PM Peak, and Evening travel periods.  The AM Peak model is best suited for estimating the increase in morning boardings that would result from locating more households near the station; the PM Peak model is best suited for estimating the increase in afternoon boardings that would result from locating more jobs near the station.
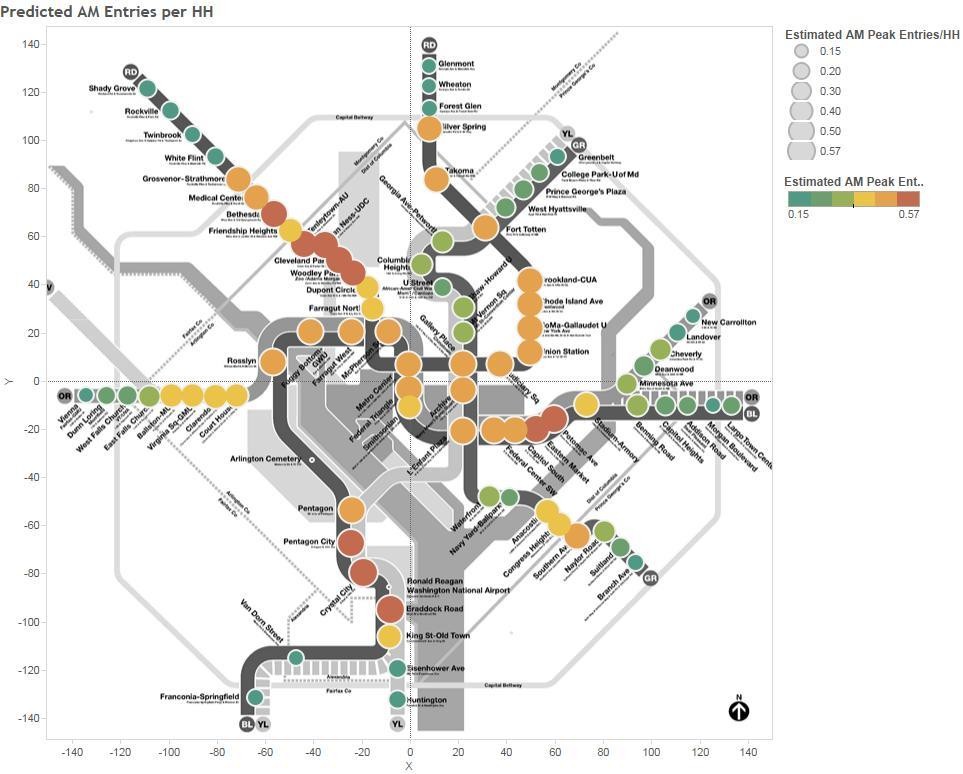
Pedicted AM Peak Entries per New HH

Map 1. Predicted AM Peak Entries per New Household

The impact of adding jobs and households near stations varies by station area.  Map 1 above, for example, shows the estimated entries per new household in the morning peak—that is, how many additional boardings would occur in the AM peak if one additional household was located in the walkshed of the station.  Stations shown by red dots gain more than 0.57 boardings per day, for each new household in the walk shed, while stations shown with green dots gain only about 0.20 boardings per day. As a concrete example, Rhode Island Row is a 274-unit, mixed-use, TOD project built on a WMATA site.  Situated along the busy Red Line, the project has long been considered as a prime location for new housing development.  According to the DRM model, adding 274 new households near the Rhode Island station would increase boardings by 144 passengers in the AM peak.  The same development at the New Carrollton station, however, would have added only 52 passengers.  This is because, compared to New Carrollton, the Rhode Island Avenue station has better job accessibility and more frequent transit service, and is thus likely to stimulate more transit ridership. Read more…

Study: Just Six Tracks Carry 30% of People Across the Potomac (57 Highway Bridge Lanes Carry the Rest)

July 29th, 2015 2 comments

A new Virginia study (PDF) finds that Metro and other transit operators carry a major portion of all cross-Potomac travel in a just a few crossings, using far less space than the 57 highway bridge lanes that carry the rest. If built, an expanded bridge crossing will need transit to maximize its ability to move people across the river.

PotomacRiverStudy Map

Transit’s Role is Critical

While some media outlets focused on the study’s highway expansion recommendation, the presentation acknowledged that Metro, VRE, and other bus operators plays a major role in the movement of people across the river from Virginia to DC in the core of the region. Seeing that, we thought we we’d drill down further to estimate how many people are actually crossing the river, using which bridge, and by what mode. Supplementing the study with available transit ridership data and vehicle occupancy data (PDF), we arrived at the following estimates: Read more…

Feds, Metro, Locals take on Pedestrian and Bike Safety at Wiehle-Reston East

July 16th, 2015 Comments off

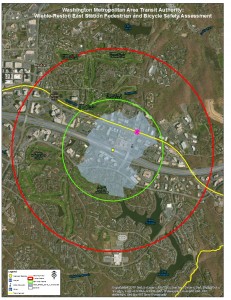
On May 12, 2015, the Federal Transit Administration (FTA) convened an event to bring together Federal, State, regional, and local transportation officials and local stakeholders for an on-the-ground bike-ped safety assessment at the Wiehle-Reston East Metrorail station.

BaseMap_2014_Wiehle Assessment

Wiehle-Reston East: one mile bikeshed and 1/2 mile walkshed

The assessment was one of 50+ that have been occurring around the nation as part of U.S. Department of Transportation Secretary Anthony Foxx’s “Safer People Safer Streets” campaign to improve bike-ped safety across the country.  These assessments have been led by many of the US DOT agencies and operating administrations, namely: Federal Highway Administration (FHWA), National Highway Traffic Safety Administration (NHTSA), Federal Transit Administration (FTA), Federal Motor Carriers Safety Administration (FMCSA), and the Federal Railroad Administration (FRA). Each of these agencies is participating in the effort to improve bicycling and pedestrian safety, and each has particular roles and responsibilities in this effort.

The primary goal of these assessments is to:

  • facilitate relationship-building between employees of different jurisdictions who share responsibility for creating safer streets;
  • engage practitioners who typically focus on pedestrian and bicycle safety, as well as those who do not; and
  • focus on locations that have non-motorized safety challenges.

The assessment kicked-off with remarks from Deputy Secretary, Victor Mendez, who stressed the importance of agency coordination in ensuring bicycle and pedestrian safety on America’s streets, later blogging about the event on US DOT’s FastLane blog. Metro’s Director of Planning, Shyam Kannan, also gave remarks that highlighted the importance of station connectivity for increasing Metrorail ridership.  Other VIPs from Fairfax County, Virginia Department of Transportation (VDOT) and local community/advocacy groups spoke to the participants as well about the importance of the day’s events to keeping our residents safe as they travel. Read more…

Transit Today, Tomorrow, and Beyond: There’s More to It Than Metrorail

July 6th, 2015 1 comment

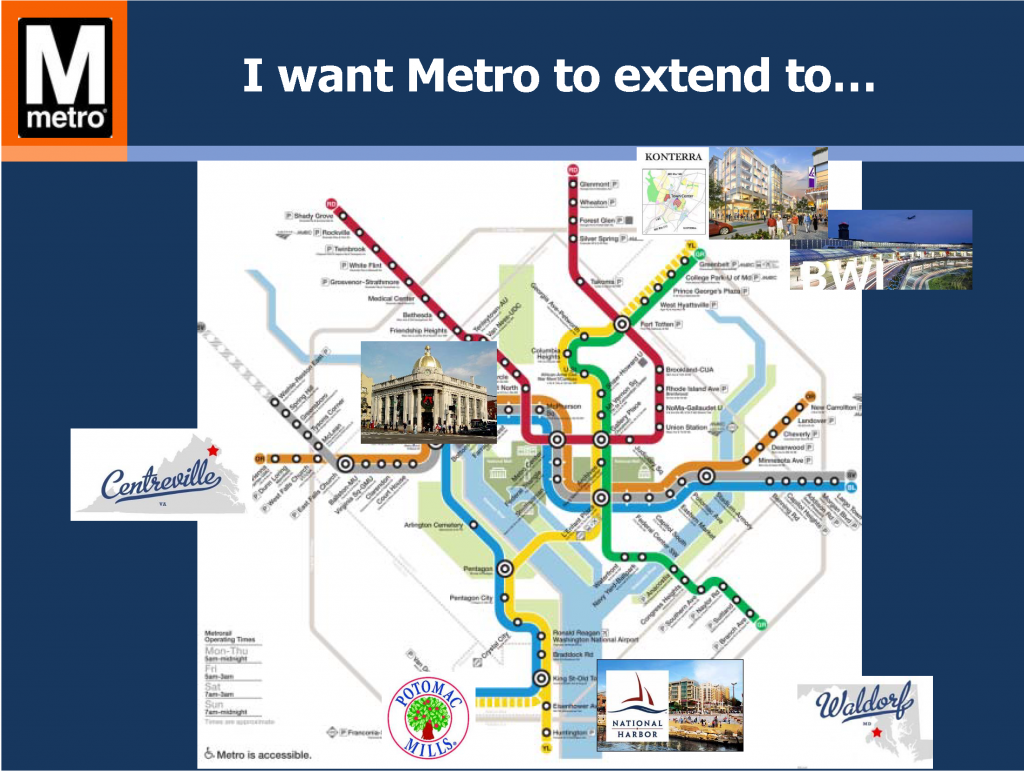
In part one of this series, Metro Planners led a session at StreetsCamp  Saturday June 20, 2015 to talk with transit advocates about other possibilities beyond Metrorail to increase transit use, reach, and access.

I want Metro to...

Politicians and citizens always ask for more Metrorail, but why should transit continue to chase land use decisions? Metro Planners Allison Davis and Kristin Haldeman talked to transit advocates and urbanists at StreetsCamp last Saturday to provide approaches that can help the transit we have today reach more people and be more cost-effective without requiring more Metrorail (pdf). The major take-aways for advocates and urbanists were to advocate for:

(1)    Local decision makers to monetize full life‐cycle cost of land use options;

(2)    Access projects that create comfortable (i.e. desirable) paths for pedestrians and bicyclists; and

(3)    Local jurisdictions to add transit signal priority, queue jumps, and bus lanes

Why these three specifically? Read more…