Posts Tagged ‘bus’

Why Metrobus Matters for a Region full of Bus Systems

December 14th, 2016 2 comments

James HamreJim Hamre, the Director of Metrobus Planning and Scheduling, explains that although decision-making often gets made at the local level, Metrobus is a collective regional asset that is critical to the region’s success.

Metrobus Has Long Been an Important Part of a Coordinated Regional System

For decades, Metrobus and local bus operators have coordinated to develop and enhance the regional transportation network. Local systems have strategically expanded service in places where Metrobus did not exist, was not well suited to serve, or did not have fleet or facility resources as the rail system expanded and changed travel patterns. Considerable time and effort went into the restructuring of bus services to coincide with the expansion of Metrorail to form a balanced network that generally made policy, practice and economic sense. The 1997 Regional Mobility Panel (PDF) reestablished the importance of a regional bus network, and delineated the general service responsibility among local providers and Metrobus, although the local/regional balance has changed in the intervening years.

silver-spring-transit-center-082115-6472

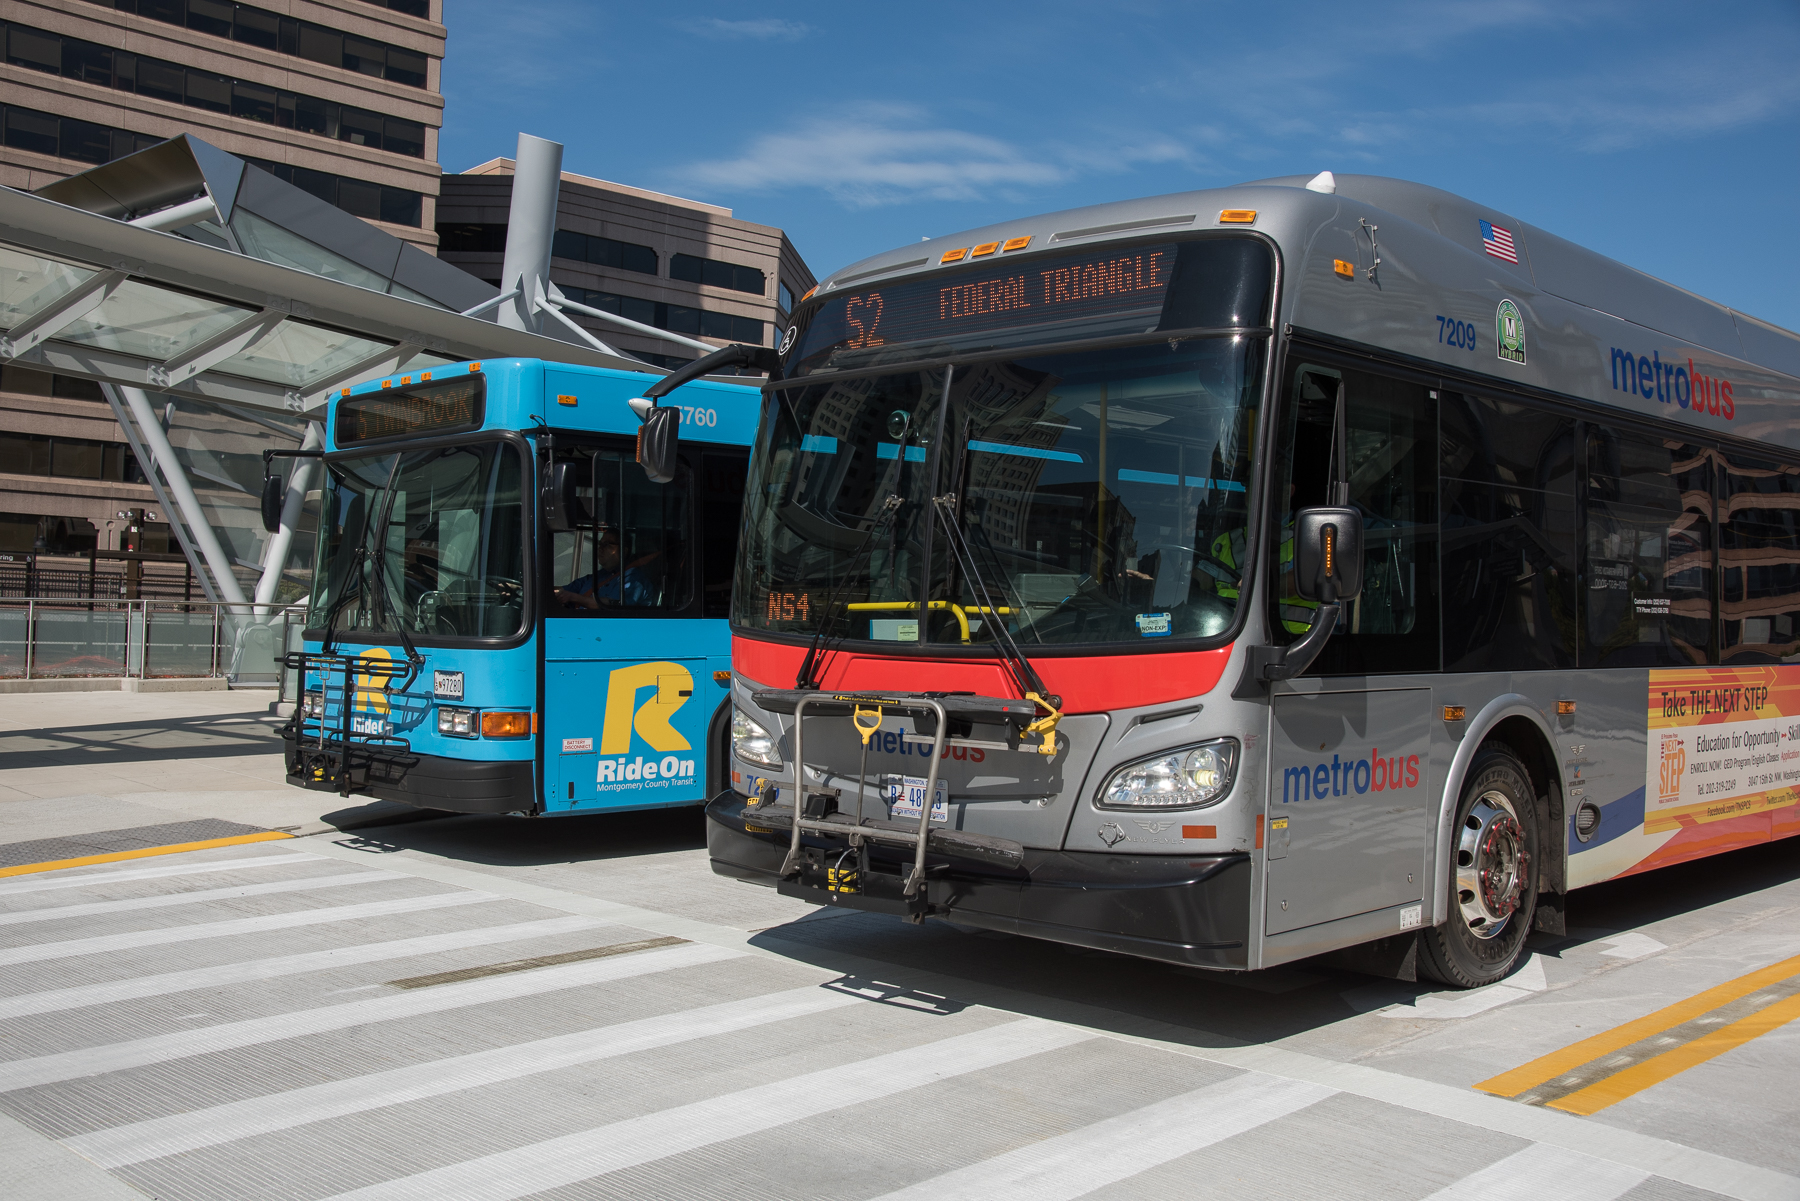
Metrobus and RideOn sharing access to the newly opened Silver Spring Transit Center.  Source, WMATA.

Among other factors, Metrobus is important to the region because it: Read more…

Is the DC Streetcar Hurting Ridership on Metrobus X2+X9? No.

December 12th, 2016 Comments off

The DC Streetcar has not significantly changed ridership on Metrobus X2 and X9, even though the services overlap on H Street NE. Instead, the Streetcar appears to be serving a new, different market – and has increased net transit ridership in the corridor by 15%.

Although the new first phase of the DC Streetcar serves some of the same sections of H Street NE as the existing Metrobus routes X2 and X9, the streetcar appears to be serving almost an entirely new market of transit riders.  Ridership on the underlying Metrobus routes X2 and X9 have remained fairly steady, even as the Streetcar is serving over 2,500 new riders per weekday.

x2-v-streetcar-ridership-monthly-averages-2

Since it opened in February 2016, the DC Streetcar’s ridership has been climbing slowly and steadily, from around 2,400 to 2,800 boardings per weekday.  The route, just over 2 miles long, runs from near Union Station down the length of H Street NE.  The X2 and X9 buses run on the same stretch of H Street NE, but stop at different bus stops and connect farther west into downtown D.C., and farther east to Minnesota Avenue.  The overlap in markets is fairly small, and the ridership data confirm that the two modes are serving distinct markets – ridership on the X2 and X9 has remained flat, or only slightly down.  Overall transit boardings between the two modes combined have risen 15%, from around 14,700/day before the Streetcar to 16,800/day now.  (Note the lift in X2+X9 ridership in June, likely due to SafeTrack Surge 2).

x29-yoy-change-in-ridership-vs-bus-systemwide

The Streetcar’s arrival does coincide with perhaps a minor shift in the rate of change in ridership on the X2+X9: monthly year-over-year change in ridership turned slightly negative last winter. But this is not dramatically different from the systemwide change in Metrobus ridership. So it’s not yet clear if this trend is due to riders switching to the Streetcar, or other forces.

Although the two modes overlap for a short stretch of H Street NE, the arrival of the DC Streetcar appears to be serving a new, distinct transit market. The Streetcar has not significantly poached riders from the existing X2 and X9 Metrobus routes, which have much higher overall ridership and serve a larger geographic area.

Data Download: Metrobus Vehicle Location Data

November 16th, 2016 2 comments

Here’s your chance to analyze and visualize the movements of the Metrobus fleet.

In anticipation of the upcoming Metro Hack Night, Metrobus planning staff has generated an automated vehicle location (AVL) systems data set. The data set, for five days in October, shows the time that each Metrobus was at each stop over the course of the day, the buses’ dwell time, and a comparison of actual stop time to scheduled stop time.

Real-time arrival sings at Metrobus stops around the region are powered by automatic vehicle location (AVL) systems on-board buses.

What can be done with this kind of data? Here are a few ideas:

  • Look at how the running times for routes varies across the day
  • Calculate vehicle speeds across the region
  • Dive deep into on-time performance
  • See how dwell times affect running times, speeds, and on-time performance
  • Map the movements of Metrobus vehicles over time
  • Get a better understanding of Metrobus operations, including how vehicles are interlined among routes and the number of different variations of some routes

Come on techies! Dive in and find new and inspirational ways to look at this data.

Please post links to your work in the comments!

Metrobus_AVL_Oct_2016.zip (319 MB zip file)

And some brief documentation:

Metrobus AVL Data Dictionary(.docx, 13 KB)


Categories: Engage Tags: , , ,

Transit Supportive Densities – What Do They Look Like?

October 5th, 2016 3 comments

A visual of what transit supportive densities look like for different transit modes

Recently, GreaterGreaterWashington blogged about density, using Google maps 3D images to show what different densities look like in Washington, DC. Visuals like these are so important because most people hear “density”, think “Manhattan” and can’t say “no” quickly enough. Last fall, we completed work as part of ConnectGreaterWashington and the Transit Corridor Expansion Guidelines that illustrated the differences in desired employment and/or residential densities within a transit walkshed by each mode.

As is typical for planning projects, especially when expanding transit service along new corridors, density is discussed and jobs and/or households per acre targets are tossed around. But most people (full disclosure, that includes me) do not know what 4 households per acre or 150 jobs per acre looks like. It is especially important because a residential target of 12 households per acre within a half-mile of a suburban Metrorail station, for example, does not mean that every residential dwelling needs to meet that target. Instead, within the half-mile radius, the overall density should be 12 or more households per acre. That gives plenty of room to have less dense single family homes (on small lots) and more dense high rise apartments with studios and one-bedrooms.

Below are example stations for each mode and the employment and/or residential density targets, along with images of the different building types that combine to meet or exceed the targets. We’d appreciate your feedback on whether they make sense to you and if they would resonate with the general public.

Metrorail (Suburban) Densities
Note, because of the variability in density across the Metrorail system, we created two types of Metrorail stations to estimate densities.

Employment Density - Metrorail Suburban

Read more…

Is New York City’s Select Bus Service A Potential Model for Improving Metrobus?

October 3rd, 2016 1 comment

New York City’s Select Bus Service may provide an excellent model – and a few cautionary lessons – for WMATA’s Priority Corridor Network and a Metrobus Off-Board Fare Payment System (OBFPS).

Earlier this year, a small team of planners from Metro’s Office of Planning, the Office of Bus Planning, the District Department of Transportation (DDOT), and DC Surface Transit had an opportunity to visit our colleagues in New York and to see their Select Bus Service (SBS) in action. Metro and our partners think it may provide both a good model and some cautionary lessons as we move forward with bus prioritization strategies, off-board fare payment, and the Priority Corridor Network.

Slower buses = worse service, higher costs

Just as we’ve experienced in and around DC, bus speeds in New York have fallen steadily over the past two decades, and continue to do so. As of 2013, the average speed for Metrobus routes is 10.5 mph. The system-wide average speed of a bus in New York has fallen to 7.5 mph, and routes serving some of the most congested corridors in Manhattan and Brooklyn are down to 4-5 mph. Traffic congestion generated by dynamic growth in jobs and population is the single greatest impediment to faster bus service, but it isn’t the only factor. Just as in our region, buses in New York spend only half of their in-service time actually moving forward; the rest is taken up by traffic signals and passenger boarding:

NYC and DC Average Bus Run Time Factors

Read more…

Try Out the New “Metrobus Explorer” Tool and Tell Us What You Think!

September 22nd, 2016 5 comments

We want your feedback on a new online tool, Metrobus Explorer, which allows visualization of Metrobus service frequency and geography.

One of the biggest challenges facing bus transit is making the service extremely easy to understand.  Metrorail stations are filled with customer information, including system maps, fare and travel time tables, station-ahead lists, and passenger information display systems (PIDS) screens, leaving little guesswork for the savvy traveler.  Moreover, with limited real estate available for customer information, Metrobus stops are often at a disadvantage.  While Metro continues to improve bus stops around the region — including the design and installation of new diagrammatic bus system maps — information technology is also playing an important role in filling the bus customer information gap, including BusETA, information displays, and trip planning sites and apps.

Metro’s Office of Planning is developing a new online tool called Metrobus Explorer that is geared to answer two questions about the Metrobus network:  “How often do buses arrive at a given stop (or set of stops), and where do they go from there?”

bus_stops_freq_spider

Screen shot of the bus frequency and spider map tool. Click the image to access the live tool online.

Read more…

Pledge to Go “Car Free” on September 22!

September 19th, 2016 Comments off

Planning to Walk, Bike, Telework or Take Metro on September 22?  Then take the pledge to go Car Free.

Car Free Day is this Thursday, September 22.  Any of us who live or work in the Washington region can pledge to go Car Free or “Car Lite” (meaning some access to a car or van pool) to help raise awareness  about alternative modes of travel relative to driving alone.  In addition to showing your support for a good cause, you might even win a prize.

Interest in Car Free Day is widespread, from folks who don’t even own cars (see our post from a few years ago) to folks who typically drive alone to work and may need a little encouragement to try something else.  Last year, more than 3,500 people pledged to go car free in the region.  About 38% said they would bike, 22% would take rail, and 17% said they would use a bus as their primary mode of transportation.  As with Bike to Work Day, events like Car Free Day can have a lasting impact beyond the one-day event by leading people to make changes in the ways they choose to get around.  So help bring up this year’s number of pledges by signing up today.

Tens of Thousands of Customers Relied on Metrobus During SafeTrack Surges 3 and 4

September 12th, 2016 Comments off

Surges 3 and 4 saw the highest shuttle bus ridership of SafeTrack so far. Overall, Metrobus shuttles moved around 17,000 trips per day during Surge 3, and around 25,000 trips per day during Surge 4.

With shuttles every 2.5 minutes and Metroway running every 6 minutes, there were about 35 buses per hour during peak periods on Route 1. Taken together, the two services moved about 31,000 passengers per day during Surge 4. As a comparison, that stretch of road serves about 41,000 cars per day.

A small portion of shuttle bus ridership was on the Franconia to Pentagon shuttle, with the remainder on shuttles between Pentagon City, Braddock Road, Crystal City, and National Airport. The sheer volume of ridership on the shuttle buses made the shuttle operation Metro’s busiest bus line, albeit temporarily. At 25,000 trips per day, the shuttles moved more riders than we typically move on any other major bus route, including some of the busiest like 16th Street NW, or the various 30’s buses.

Not all rail customers chose to use the shuttles.

Some riders, especially those traveling locally, switched to other bus routes. Ridership on the Metroway premium bus service more than doubled compared to June, and during Surge 4, it nearly tripled compared to the same period last year! Ridership on the 10A was up 29-64%, and 11Y ridership was up 128-133%, or more than double. Metrobus added service on all of these alternative lines, and Metroway did not charge fares during the Surges. We will be monitoring future ridership to see if any customers decide to remain with Metroway after the surges end.

Overall bus ridership on other lines in the Surge area was up 1%.

These first SafeTrack surges highlight one of bus’ key attributes as a mode: flexibility.

Metrobus has supported the SafeTrack work by moving tens of thousands of passengers along corridors that don’t normally see that level of demand for bus service, in different locations every couple of weeks. There’s been plenty of work behind the scenes to make that happen:

  • The planning and scheduling team has worked out which routes the buses should take, which bus bays they should use at the stations, what time the buses need to leave the garages, and more.
  • Our customer facilities team has ensured there were signs up at all the stops and stations pointing the way to bus service.
  • The bus maintenance team has kept all the buses for SafeTrack up and running.
  • The street operations staff have answered passengers’ questions and worked with the Bus Operations Communications Center and the bus operators to make sure everything ran smoothly.
  • Bus operators have learned new routes in a very short amount of time and safely taken tens of thousands of passengers where they needed to go.

Usually, Metrobus makes service changes only about once a quarter, since passengers count on the consistency and reliability of our service. But when it’s needed, bus service can be very nimble, allowing it to support the important maintenance work being done during SafeTrack.

Did you ride Metroway or the shuttles during Surge 3 or 4? What did you think? What other opportunities are there to capitalize on the flexibility of bus service?

SafeTrack’s Surge 2 Bus Shuttle Proves Bus Rapid Transit Can Work Here

June 28th, 2016 Comments off

The shuttle buses at Eastern Market during Surge 2 are arriving every two minutes at rush hour, and are moving nearly the same number of people as 3 lanes of Pennsylvania Avenue SE.  This shows how much we can achieve by giving buses priority – lanes, signal priority, and more – on busy streets. 

27234765704_310d840f17_k

Commuters transferring from shuttle buses Eastern Market station (photo by author)

For the last week, Metrobus has been operating bus shuttles between Eastern Market and Minnesota Avenue and Benning Road, to provide alternatives around SafeTrack Surge 2 while we rebuild tracks and infrastructure on that segment of Metrorail.  While still moving less than half the the riders as what Metrorail normally moves, the shuttles are moving an impressive number of people:

  • In the morning rush hours, buses are arriving at Eastern Market every 2 minutes on average
  • Shuttle buses are delivering 1,800 people per hour to Eastern Market between 8:00 and 9:00am.  This is about the same as the number of vehicles that 3 lanes of Pennsylvania Ave. SE typically moves (1,500-2,000 vehicles per hour per direction, according to TPB Regional Transportation Data Clearinghouse).
  • Around 16,000-17,000 people per day are riding the shuttles, or about two-thirds of the number of vehicles driven through the corridor in a day (25,000 average annual daily traffic)
  • Traffic Control Officers from DDOT are critical to this operation, ensuring that everyone moves safely and efficiently

Read more…

New Metrobus schedules begin this Sunday

June 23rd, 2016 Comments off

On Sunday, June 26, service changes will take effect on Metrobus routes across the region.

Bus%20Gallery%20Place%20041816-5908[1]These adjustments aim to improve system reliability, route simplicity, and customer service. The bulk of this service change impacts bus routes in Virginia. Check below to see if your routes will be affected and look up upcoming timetables here.

DC: 42, 52, 53, 54, 60, 79, D1, E2, E4, G2, L2, N2, N3, N4, N6, A2, A6, A8, A42, A46, A48, D3, D4, G8, P6, V1, V2, V4, X1, X3, X9

MD: B29, B31, J11, J12, J13, K11, K12, R12, V14

VA: 1A, 1B, 1C, 1E, 1Z, 2B, 3T, 4A, 4B, 9A, 10A, 10B, 10E, 10R, 10S, 15M, 17M, 18E, 18J, 18P, 21A, 21D, 23A, 23B, 23T, 28X, 29K