Customers showed high levels of interest in a customizable monthly pass.
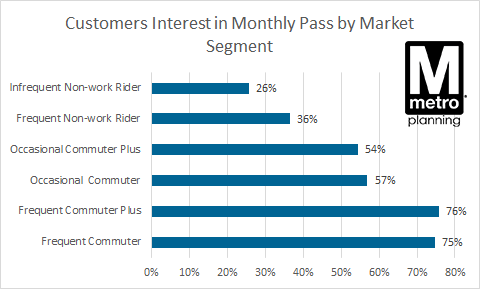
Metro customer interest in a new unlimited monthly pass concept, by market segment.*
Metro is not raising fares this year, and instead is innovating ways to make it easier and more affordable to use the system. Metro is taking a page from private industry, which has moved away from charging customers for each purchase and towards giving customers the option to “subscribe” to a company in exchange for unlimited access. A Netflix subscription has replaced a membership at the local video store. Amazon Prime offers unlimited shipping rather than shipping on each item. Spotify subscriptions have replaced purchasing individual CDs. Why not a subscription to use Metro?
Fortunately, we found a way to provide this to our customers and we’re really excited to begin testing it out starting this month. The idea is to allow customers the ability to customize an unlimited access pass based on their usual travel patterns. Modeled after Seattle’s Puget Pass and frequently discussed on Greater Greater Washington over the past few years, this pass would allow customers to subscribe to a monthly pass, priced based on their typical trip costs, that offers unlimited travel on rail and the option to add on the same flexibility on bus. We are calling it the Metro SelectPass.
Here’s the basic concept. Customers tell Metro their usual start points and end points. We then figure out how much that trip costs and offer you unlimited travel on rail up to that value in exchange for you buying 18 days worth of trips. For example, if a customer’s “usual” peak trip is $2.25, they can get a pass priced at $81.00 (about $2.25 x 18 x 2) and then all trips valued at $2.25 or less would be free for an entire calendar month. Extra trips for lunch, a night on the town, doctor’s appointment - it’s all included in one low price. If you travel on a more expensive trip for any reason, you only pay the difference for that trip. Most customers may enjoy savings of over 20% off of the pay-as-you-go rate, and they’ll also get the benefit of knowing they can travel as much as they want, whenever they want, all for one price.
For an additional $45 per month, customers can choose to add unlimited bus travel on top of unlimited rail travel. That’s a huge savings compared to pay-as-you-go! Read more…
Metrorail ridership is heavily-determined by station-area land use patterns, so attention to land use as a transportation strategy will be important to sustaining Metrorail’s long-term ridership growth.
There has been a tremendous amount of attention recently paid to Metrorail’s ridership trends. While history tells us that the current ridership snapshot - which shows that ridership has essentially flatlined - is quite normal given the cyclic nature of ridership growth, Metro’s Office of Planning has been exploring why certain station areas and rail segments have seen ridership gains during the downturn, while other station areas and segments have seen losses.
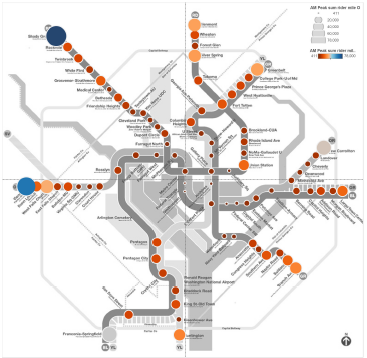
Passenger Miles Traveled by Trip Origin at Each Metrorail Station, AM Pea, Full-Fare Riders with no Transit Benefits. One of the inputs from this study.
The questions we sought answers to included, for instance:
- Why is it that while system-wide ridership declined last year, we saw ridership gains at stations with lots of transit-oriented development, such as NoMA, Columbia Heights, and Navy Yard-Ballpark?
- How much of an impact does transit-oriented development have on overall ridership, and can that impact be measured, both in terms of new ridership as well as in terms of net new farebox revenue?
- With so many ways to get around - including walking and biking and Uber and Lyft - and gas prices at near historic lows, how does a Metorail trip compare to other ways of getting around in terms of overall competitiveness?
- Does the location of a transit oriented development project matter in terms of how much ridership it generates? Does that vary by the type of project (i.e. office, retail, residential, etc)
Read more…
December 21st, 2015
Shyam
Between 2007 and 2012, off-peak work trips were the fastest-growing segment of Metrorail ridership.
The traditional “rush hour” remains important, but Metrorail ridership seems to reflect a broader trend regionally - people are making more and more trips during “off peak” hours. According to the 2012 Metrorail survey, rail ridership growth was stronger in its off-peak (8 percent since 2007) than the peak (5 percent over the same time period). In certain jurisdictions - including those that have fostered re-investment in dense, walkable areas - off peak growth was into the double digits while peak growth grew more modestly. In one jurisdiction, off-peak trips grew by 50% during this period while peak trips grew at less than half that clip.
| Compact Jurisdictions |
Peak |
Off-Peak |
| % Change |
% Change |
| District of Columbia |
8.3% |
12.9% |
| Arlington County |
18.4% |
9.0% |
| City of Alexandria |
9.5% |
12.7% |
| Montgomery County |
0.1% |
5.9% |
| Prince George’s County |
-7.4% |
-1.4% |
| Fairfax County |
-1.4% |
3.0% |
| City of Falls Church |
21.3% |
46.9% |
| Fairfax City |
32.8% |
19.4% |
| Compact Total |
3.0% |
8.0% |
Data sources, Metrorail ridership surveys, 2007 and 2012. 2012 is the most recent dataset we have on trip purpose.
In the past these trips would be for theaters, late night entertainment, or shift work, but the bulk of these off-peak trips were during the midday – almost twice the number of late night trips – and the bulk of these trips were for work. Read more…
A new Virginia study (PDF) finds that Metro and other transit operators carry a major portion of all cross-Potomac travel in a just a few crossings, using far less space than the 57 highway bridge lanes that carry the rest. If built, an expanded bridge crossing will need transit to maximize its ability to move people across the river.

Transit’s Role is Critical
While some media outlets focused on the study’s highway expansion recommendation, the presentation acknowledged that Metro, VRE, and other bus operators plays a major role in the movement of people across the river from Virginia to DC in the core of the region. Seeing that, we thought we we’d drill down further to estimate how many people are actually crossing the river, using which bridge, and by what mode. Supplementing the study with available transit ridership data and vehicle occupancy data (PDF), we arrived at the following estimates: Read more…
Categories: Impact Tags: bus, commuter bus, commuter rail, dc, maryland, Metrobus, Metrorail, mode share, Potomac River, travel patterns, Virginia, VRE
Ridership from neither of the two back-to-back sold-out Taylor Swift concerts at Nationals Park this week generated as many riders as an average Nationals baseball game.

Entries at Navy Yard by fifteen-minute period, Orange and Gray were nights of the Taylor Swift concerts.
Pop star Taylor Swift brought her 1989 tour to Washington this week, playing two sold-out concerts at Nationals Park, adjacent to the Navy Yard-Ballpark Metrorail station. According to Swift, approximately 45,000 people attended each concert. That’s a lot higher than a normal Nationals game, as the concert had seating on the floor as well as in the stands. One would hope that such big crowds would bump up Metrorail ridership higher than the Nats. You might be disappointed. Read more…
Metro’s planners provide tips on avoiding crowds this Cherry Blossom season.
After this long and trying Washington winter, locals and visitors alike are marking their calendars for the 2015 Cherry Blossom Festival. While everyone knows that Metro is the best way to reach the blossoms, PlanItMetro has been digging into the data to help you minimize the crowd crush and maximize your enjoyment of this treasured DC celebration.
What happens to Metro ridership? As we showed last year, the Cherry Blossoms always bring a major bump to Metrorail ridership, especially on weekends and at Smithsonian station. Metro is ready for the increased demand: track work is cancelled, service levels are increased, and our customer ambassadors are out in the field to help with the needs of visitors. So how do savvy Washingtonians avoid the thickest crowds?
Tip #1: Avoid Smithsonian station

On weekends during Cherry Blossoms, the number of customers exiting Metro at Smithsonian dwarfs every other station during daylight hours
Read more…
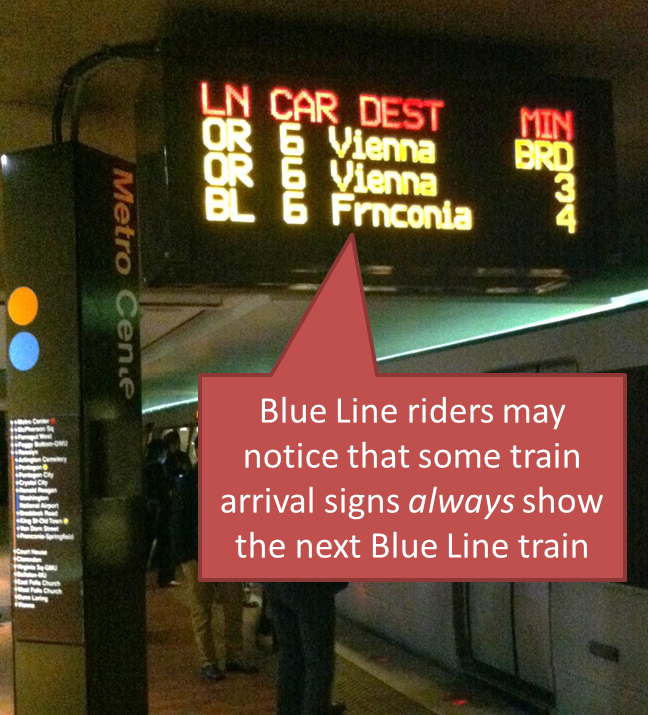
 Some train arrival signs now always show the next Blue Line train, and it’s helping Blue Line riders determine their best route.
At rush times, Blue Line riders know they can sometimes see two or three Yellow or Orange Line trains go by before a Blue Line train arrives. For some riders, knowing just how far away the next Blue Line train is can help them decide: is it worth waiting, or should I get on the next train and transfer at L’Enfant Plaza?
To help Blue Line riders, Metro changed the arrival signs to always show the time until the next Blue Line train arrives, even if it’s more than three trains away. That means that riders can always tell how far away a Blue Line train is, and decide whether to wait for it, or use the Yellow Line instead. Read more…
Americans are driving less and owning fewer cars, which means we have to make different decisions about where to spend scarce transportation resources.
In a fascinating post in the Atlantic Cities, Eric Jaffe doesn’t waste words with assumptions but rather relies on actual data to inform us that America has already reached “peak driving” and that the future of transportation in America is no longer linked to ever-increasing vehicle miles traveled (VMT).
This should come as no surprise, given that VMT has missed forecasted estimates since the early 2000’s. Just check out this handy chart from the U.S. Department of Transportation’s Conditions and Performance Report (PDF) to Congress.
Figure 1. U.S. VMT (in trillions) as tracked by FHWA’s Travel Volume Trends (“Actual”) and as projected by U.S. DOT’s C&P reports (by year reports are dated). Via SSTI. Click image for original: http://www.ssti.us/2013/12/new-travel-demand-projections-are-due-from-u-s-dot-will-they-be-accurate-this-time/
Regional roadway planners are already beginning to embrace this thinking, as the chart from the State Smart Transportation Initiative illustrates in its analysis of MDOT’s transportation plans. These plans not only acknowledge declining VMT, but now omit traffic projections altogether. Read more…
[Editor’s note: this will be our last post of 2013. We look forward to seeing you again in early January.]
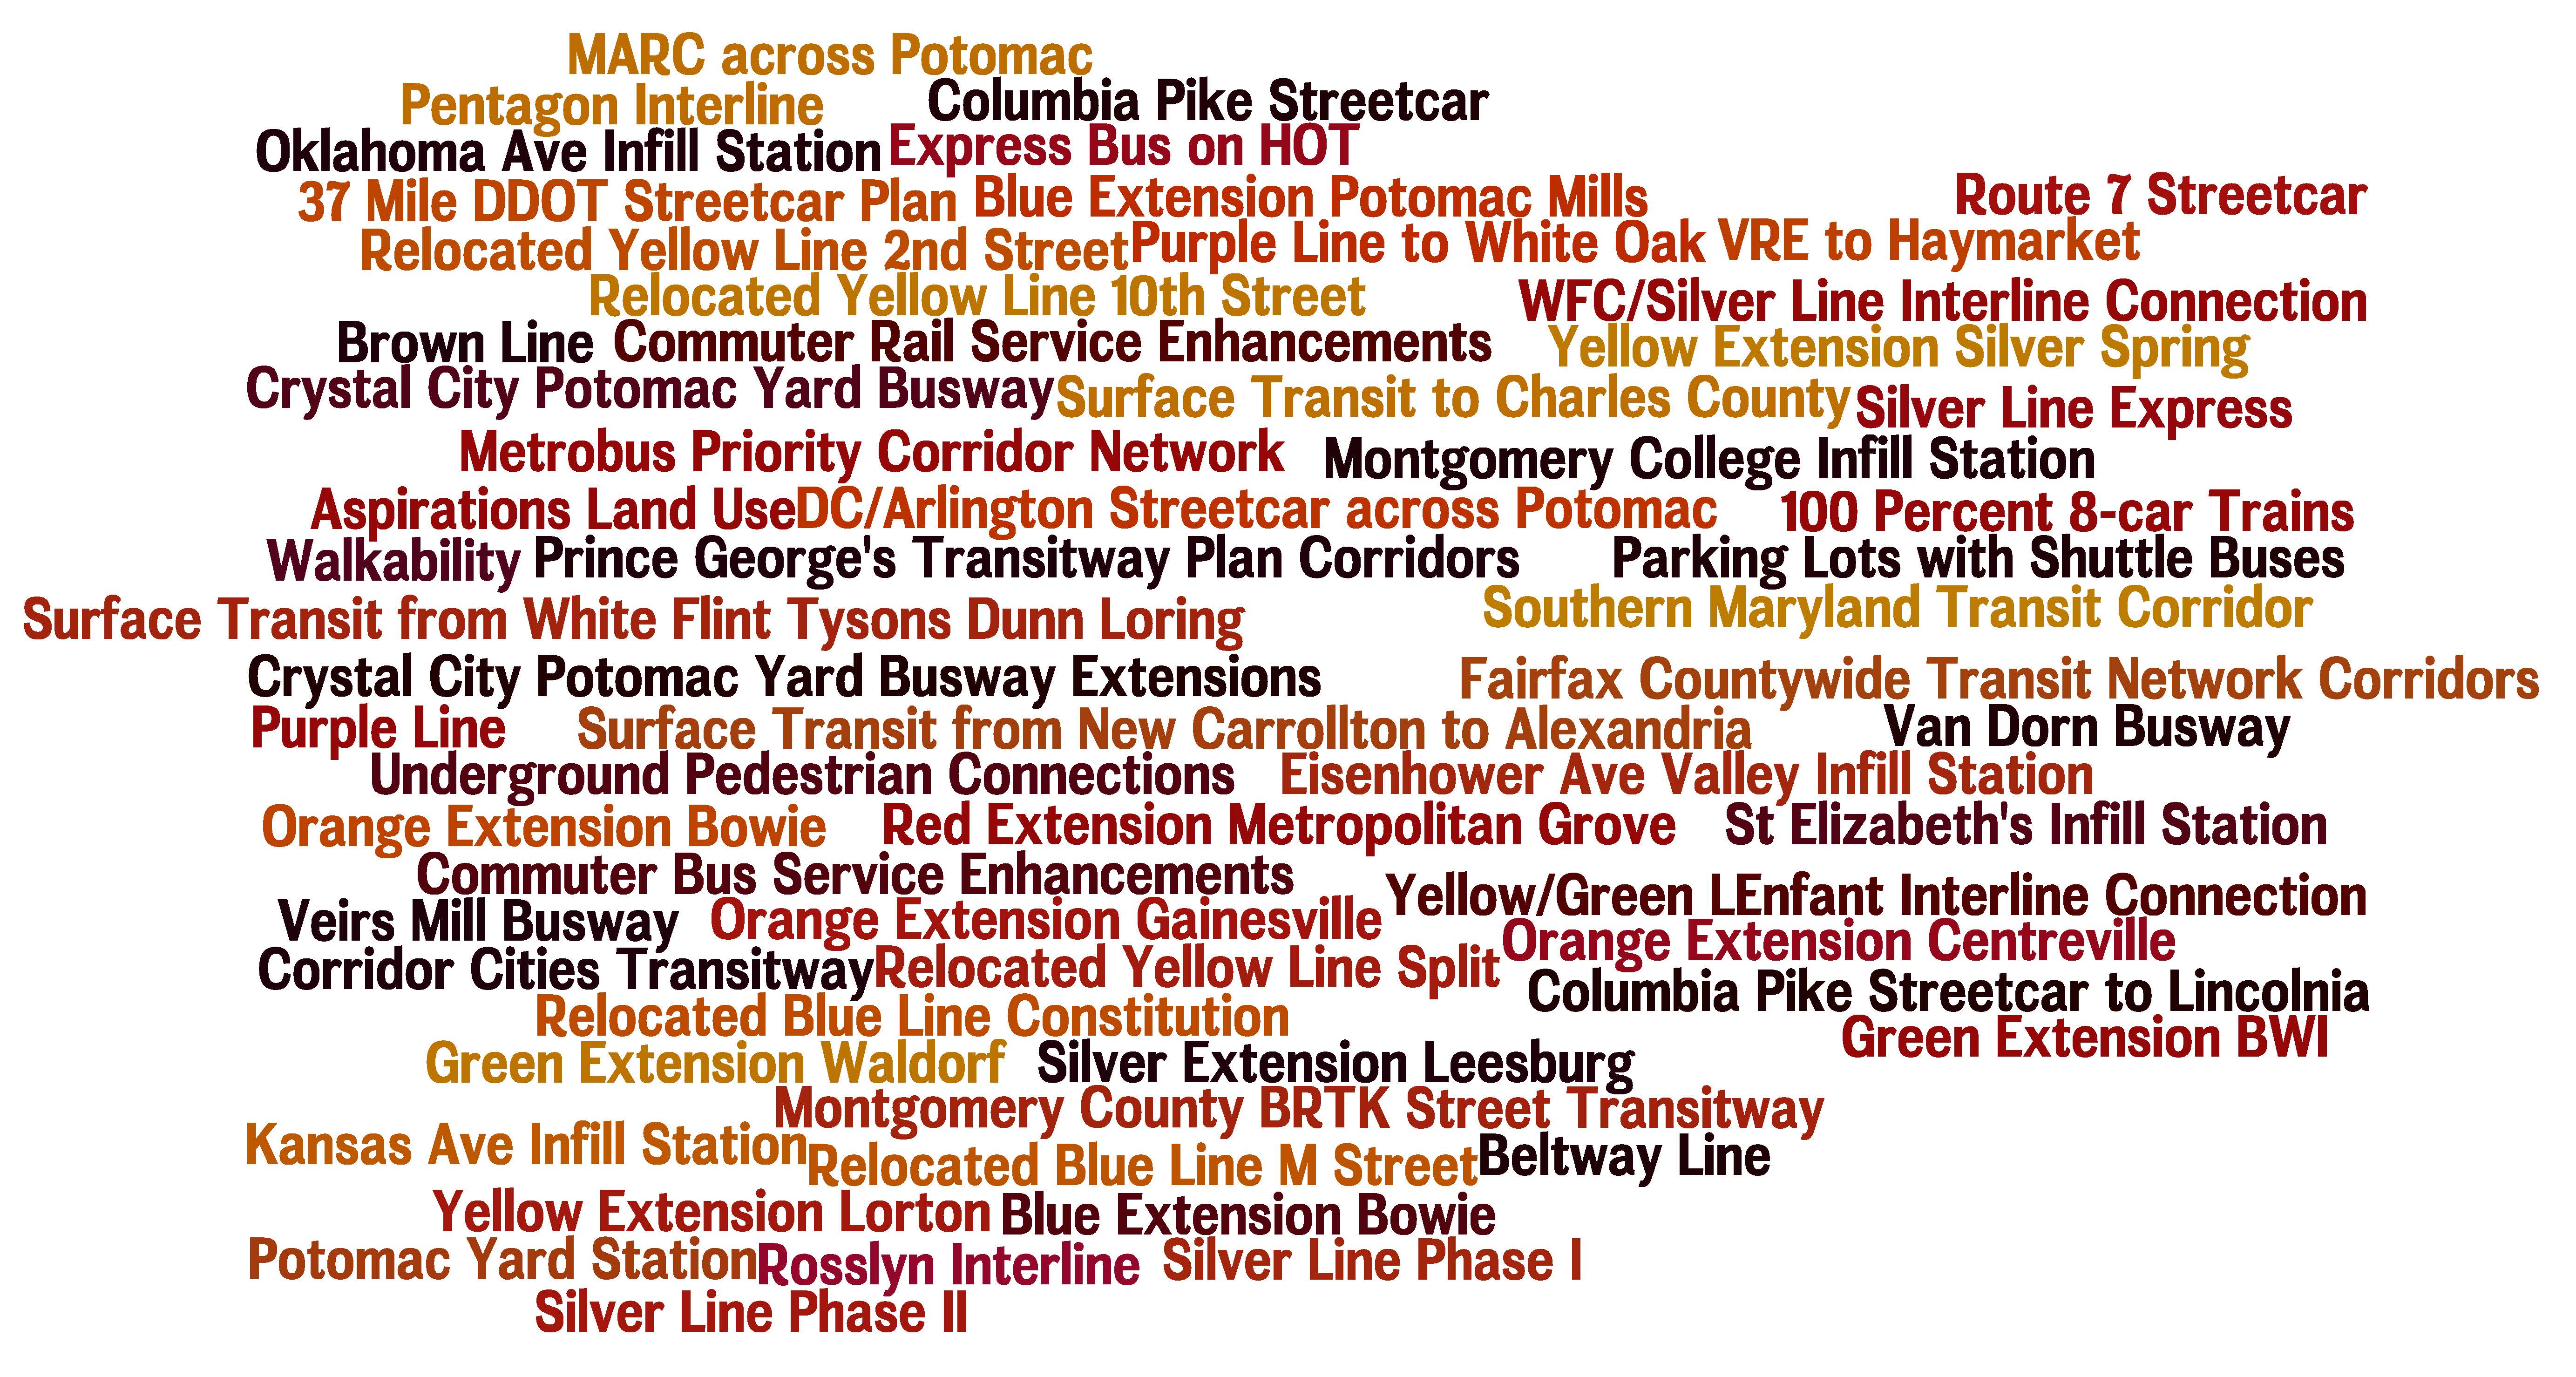
You name it and we tested it as part of our analysis and development of the Regional Transit System Plan (RTSP). Here’s the comprehensive list of what was analyzed.
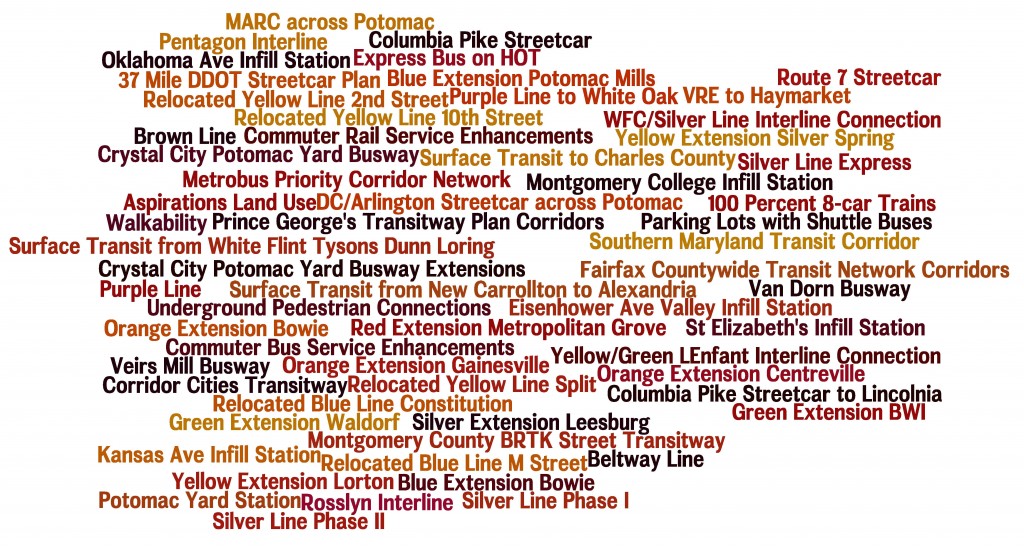
List of Transit Corridors, Projects, and Plans Analyzed as Part of RTSP
We have received tons of great comments on the proposed 2040 network of Metrorail and high capacity surface transit corridors. Many of you have said that we missed <insert corridor here> or have asked why we don’t have a line to <insert address here>. As part of this plan, we have analyzed almost every corridor or mode that you have identified. However, we recognize that most of it was behind the scenes and is buried deep in our posted presentations to the Technical Advisory Group (TAG).
Above is a list of what was analyzed before we unveiled the proposed 2040 Metrorail Network and regionally significant high capacity corridors. Better yet, here is a document that shows the Metrorail lines and other surface transit plans, projects, and strategies that were tested over the course of the project. Everything is listed and where possible, maps and graphics are provided to illustrate what was tested. All tested items were measured against a comprehensive set of measures of effectiveness (MOE). The MOEs assessed ridership, impact on core capacity, transfers, reduction in vehicle miles traveled (VMT), mode share, etc.
To wet your whistle, below, check out the Beltway Line that was tested. Only the segments that crossed the American Legion Bridge (between White Flint and Dunn Loring) and the Woodrow Wilson Bridge (between Branch Avenue and Eisenhower Avenue) had some promise and therefore, they continued on in the analysis, though as surface transit not Metrorail. The other segments did not provide good ridership, primarily due to the low densities within a walkable distance from the Beltway, and had little impact on Metrorail core capacity.
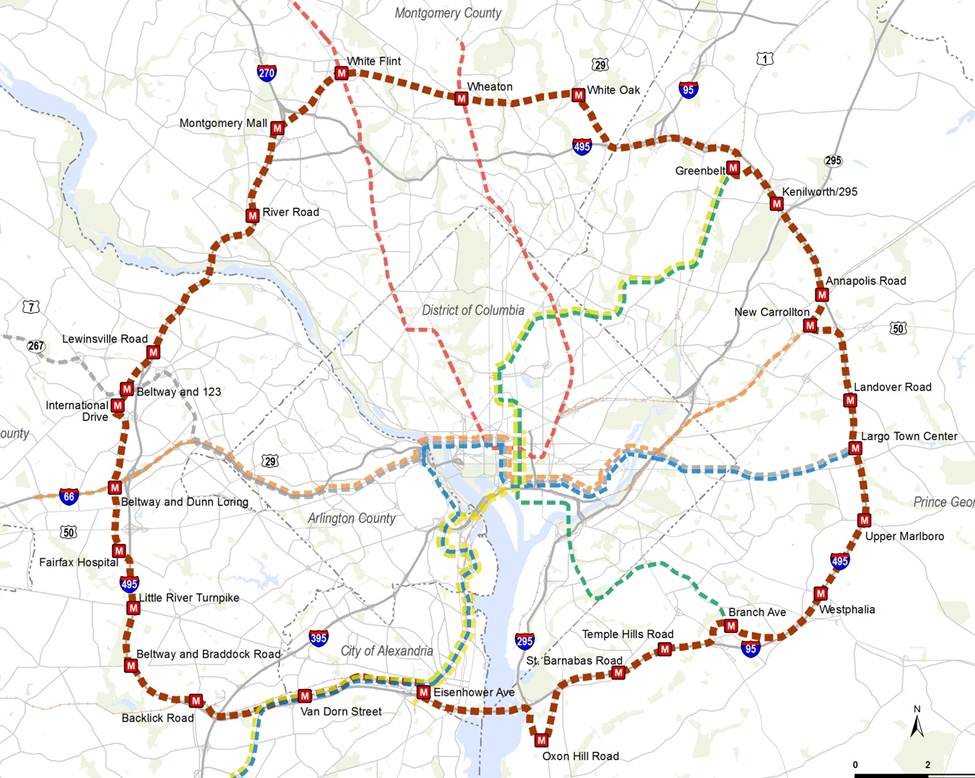
Alignment of a Beltway Line that was tested in the RTSP
Let us know what you think!
In parallel with the proposed 2040 Metrorail network, we have identified 25 regionally significant corridors that merit high-capacity surface transit by 2040. Depending on the corridor, high-capacity surface transit can be provided more efficiently and effectively by modes other than Metrorail.
The best transit systems in the world are comprised of large networks served by multiple modes. In the National Capital Region, due to the growth and dispersal of activity centers, the high demand placed on Metrorail, and the realities of transit funding, expanding the transit network needs to occur by expanding transit on the region’s roads and highways not just by Metrorail. Metrorail is not and cannot be the best mode for every corridor because the vast majority of corridors do not have the land use, density and ridership to support it.
But don’t despair! There are plenty of other high-capacity modes such as bus rapid transit (BRT), light rail (LRT), streetcar, and enhanced bus that can provide:
- high-frequency;
- all day service;
- large, comfortable vehicles; and
- lower capital and operating costs than Metrorail.
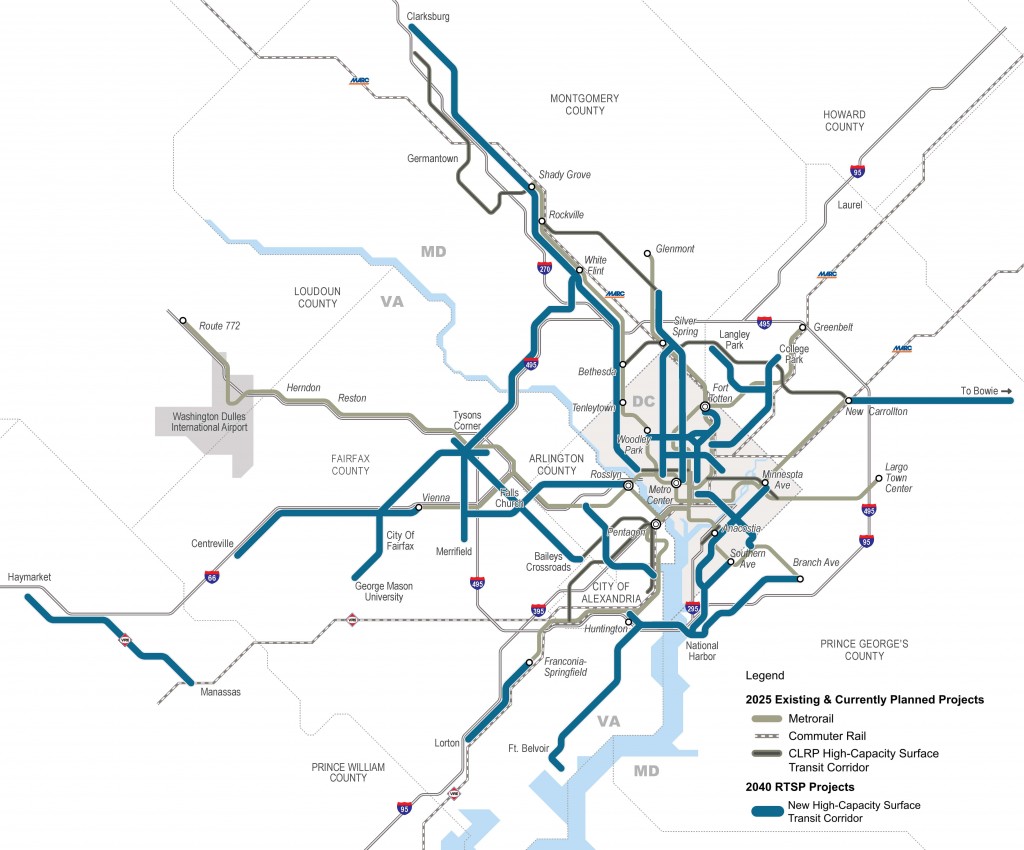
Regionally Significant High-Capacity Surface Transit Corridors as part of 2040 Regional Transit System Plan
Read more…
Categories: Strategies Tags: BRT, bus, capacity, Light Rail, Metrorail, planning, plans, priority, rail, ridership, RTSP, Streetcar, studies, travel patterns


Recent Comments