‘Planning Studies’

MetroRail – Designed for Performance

January 19th, 2017 Comments off

Though it has several key constraints, the Metrorail System’s capacity compares favorably with its peers and even out-performs them in several key measures.

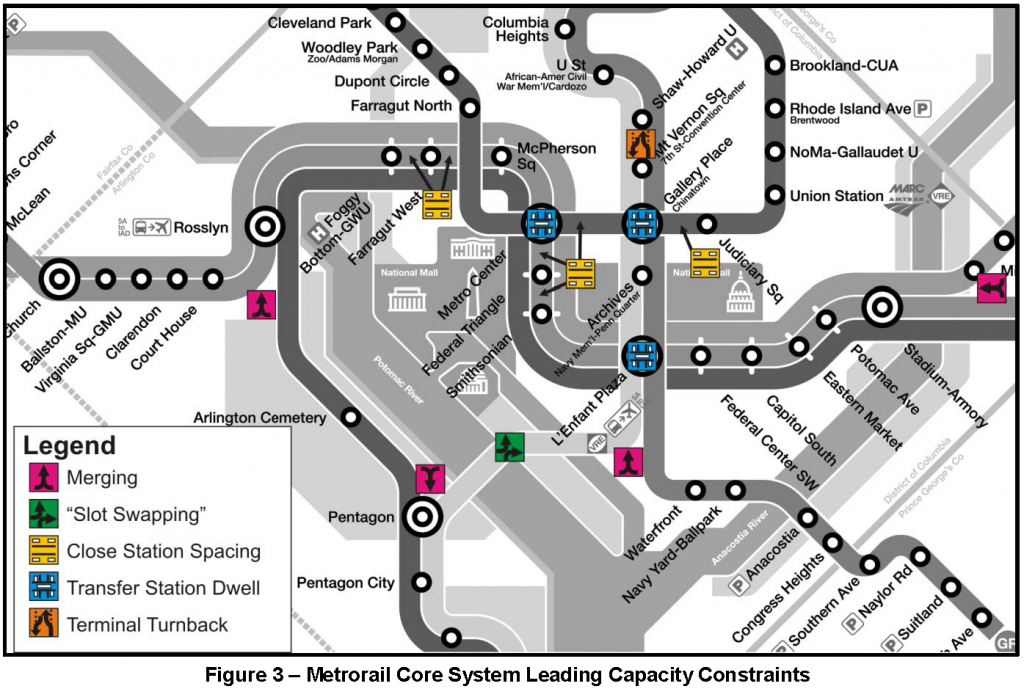
In a previous post, we explained that Metro doesn’t schedule more than 26 trains per hour at any point in an effort to balance reliability with high capacity operations. But it also raises some interesting questions: How does Metrorail’s capacity compare to peers? How does Metrorail compare to its peers in terms of train throughput and what are the specific constraints that prevent trains from operating more frequently? Are there any ways to increase the capacity of the existing system beyond 26 trains per hour?

We developed a white paper (PDF) to answer those questions. Some of the findings might surprise some Metroskeptics or armchair transit planners, but Metrorail has among the highest capacity infrastructure in the industry, which – when in a state of good repair – allow it to outperform its peers in a number of key areas.

core-constraint-graphic Read more…

Returning Metro’s Assets to a State of Good Repair

January 3rd, 2017 Comments off

Metro needs over $17B in the next ten years to reach and maintain the State of Good Repair (SGR), which accounts for approximately 70% of its total needs over the same period.

As noted in our our previous post, Metro’s SGR needs are built off of a comprehensive inventory of existing assets as a part of the Capital Needs Inventory (CNI). Each record in this inventory documents the asset’s type, age, expected life, replacement cost, and other attributes required to assess that asset’s 10-year reinvestment requirements. SGR investments include:

  • Rehabilitation that require capital maintenance (including major overhauls, renovations, or rebuilds)
  • Replacements
  • Annual capital maintenance (generally occurs for larger assets such as tunnel or bridges, which require periodic infusions of capital to maintain SGR).
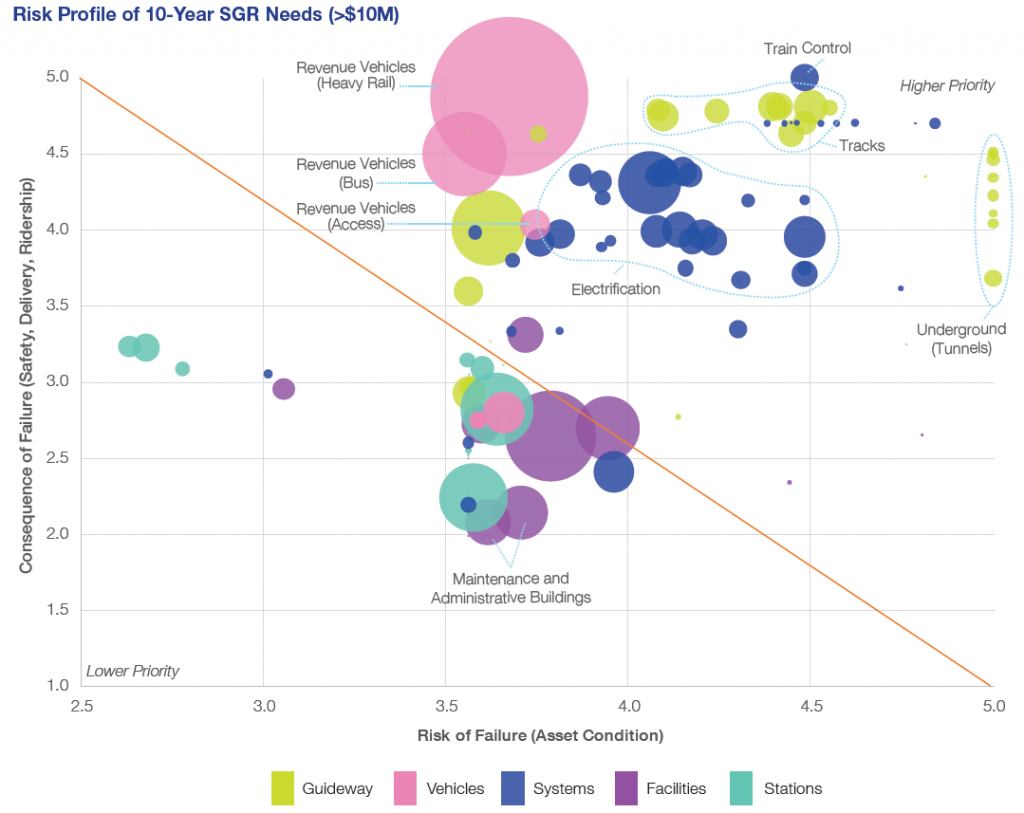
Fig. 1: Risk profile of SGR needs (assets > $10M)

Fig. 1: Risk profile of SGR needs for assets > $10M (click for full report)

After being inventoried, the existing assets then went through the prioritization process using the risk-based prioritization approach, as described in Ramona’s blog post.  Figure 1 illustrates the risk profile of SGR investment needs for assets exceeding $10M, based on the risk of failure and the consequence of failure. The asset groups above the diagonal line carry a higher level of risk and have bigger impacts on safety, reliability, and ridership.

Ten-Year SGR Needs

Given the 10-year SGR needs total to $17B alone, what are some of the major investments that are involved?

  • Railcar Replacement and Rehabilitation Program: $5B over the next 10 years, which is about 28% of total SGR needs.
  • Track and Structure Rehabilitation Program & Rail Systems Program: $3B each, to reach and sustain SGR. The combined $6B for both programs will cover fixed rail, guideway structures, track maintenance equipment, electrification, communications, signals, and other related assets.
  • Bus & Paratransit Program: $2.3B for fleet, facilities, and maintenance equipment.
  • Stations and Passenger Facilities Program: $2.4B to improve or upgrade platforms, station structures, vertical circulation, fare collection, and parking facilities.
  • Business Support Program: $1.7B to maintain and upgrade software and hardware, supporting equipment and services, as well as the Metro Transit Police Department’s assets.

Fig. 2: Total current SGR backlog

Fig. 2: Total current SGR backlog (click for full report)

Backlog and Compliance Needs

Metro’s SGR needs include $6.66B in backlog, also known as deferred asset needs. The assets in the backlog require immediate reinvestment as they are past their useful lives or require rehabilitation or replacement due to compliance issues. Metro’s backlog needs make up approximately 16% of Metro’s total asset base across all asset categories. The largest proportion of backlog are in major systems such as traction power and train control (Figure 2) with guideway elements (i.e., track, tunnels, bridges, and other structures) making up the next largest portion of deferred needs. About 30% of the backlog are compliance based investments such as safety directives to replace track circuits and improve tunnel ventilation. These items, totaling $2B in needs, have been marked as priority as they are needed to address compliance and/or regulatory requirements.

Scheduled SGR Needs

Over the next ten years, different assets will be due for scheduled SGR investments. For example, besides the ongoing replacement of the 1000- and 4000-series rail cars, Metro will need to complete the replacement of the 2000-, 3000-, and 5000-series rail cars during the period of the CNI, along with rehabilitation of all fleets to maintain SGR.

Given that Metro’s capital budget averaged $1B a year for the past six years, maintaining assets in a SGR as identified by the CNI would require an annual average of $1.7B in the capital budget – a 62% increase above today’s level. To support CNI’s SGR investments, Metro would need the region to significantly increase funding to execute these important needs and keep Metro healthy into the future.

What do you notice in this list of repair needs? Are there any surprises?

Prioritizing Metro’s Capital Investment Needs

December 21st, 2016 Comments off

Metro used a risk-based multi-factor methodology to score and rank its 10 year capital needs.

Metro’s 2016 Capital Needs Inventory (CNI) aims to capture and quantify Metro’s existing and anticipated capital needs over the next ten years. With our needs far outpacing available funding, prioritization of capital needs is critical. But with the ever present constraints of budget, time, and staffing, how do we determine how to prioritize our new and existing needs across a 10 year period? Metro used a risk based approach to develop its 10 year capital needs prioritization.  Each criterion is defined based on the impact of an investment to improve an asset’s condition, to thereby improve Metro’s state of good repair or to mitigate asset related risks.

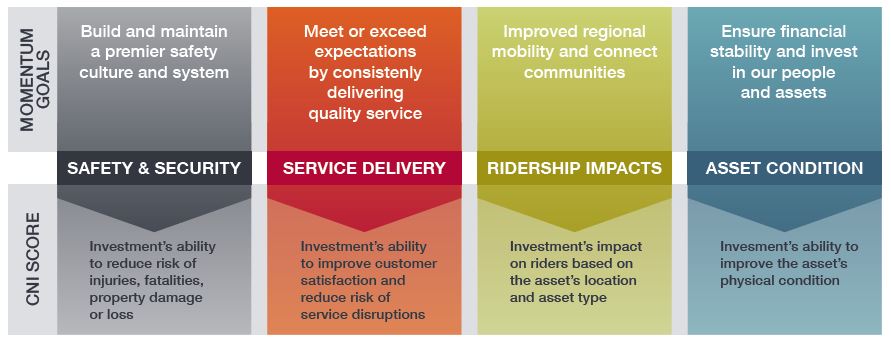
The risk-based prioritization approach is illustrated above.  This approach considers both the likelihood of asset failure and consequence of asset failure. The scoring uses weighted criteria, to represent either the likelihood or consequence of asset failure. For instance, the scoring helps us to decide if it is more urgent to replace one kind of asset over another in any given year, given agency priorities and finite resources.  A safety focused weighting scenario, based on the extent that an asset’s failure would affect overall system and rider safety was developed to reflect Metro’s core mission and values.  It was also important that Metro’s weighting criteria be aligned with its larger strategic goals. The image below demonstrates how Metro’s strategic goals were aligned with CNI scoring weights.


Once Metro’s 10 year capital needs were identified and compiled, they went through several rounds of prioritization testing based on the risk-based approach and generated prioritization scores for individual assets in the asset inventory.

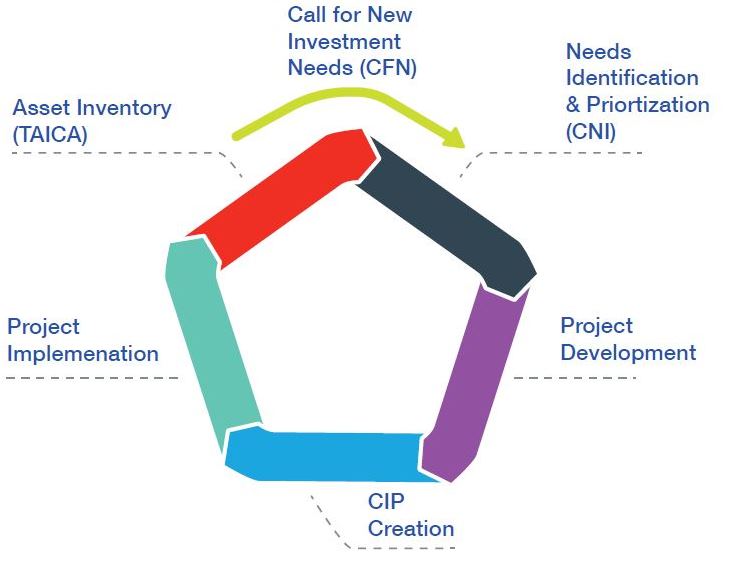
cip-process

After the completion of CNI, the identified capital needs must be further verified and then converted into build-able projects through a design and engineering process, which will define actual capital projects with scopes, schedules, cost estimates, and delivery methods.

Metro’s Ten-Year Capital Needs Inventory and Prioritization is Complete

December 5th, 2016 Comments off

Metro needs to invest $17B over 10 years to achieve and maintain a State of Good Repair.

In June 2016, we introduced the initiation of the 2016 Capital Needs Inventory (CNI), with the goal to develop a list of fiscally unconstrained and prioritized investment needs over the next ten years and to meet the new federal Transit Asset Management (TAM) requirements. After seven months of rigorous work, the first phase of the CNI is coming to a completion!

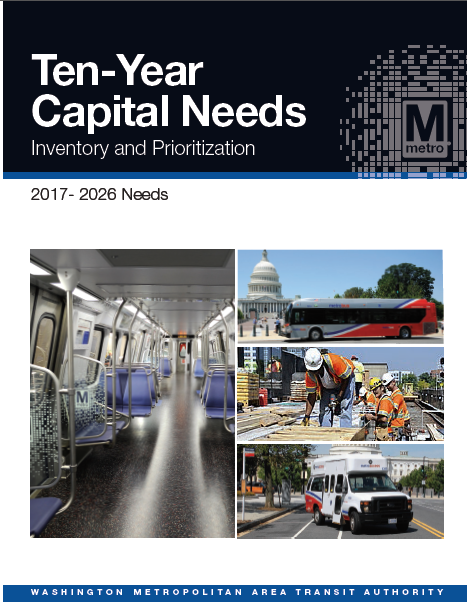
Figure 1: CNI Final Report

CNI Final Report (click for link to PDF)

What distinguishes this CNI from Metro’s efforts in previous decades? Breakthroughs on several fronts:

  • It represents the first time that Metro developed a ground-up, data-driven and FTA-compliant method for asset prioritization.
  • It consolidates asset data sources and builds a complete asset inventory database that catalogue higher-level assets and asset features.
  • It estimates asset condition (and need rehab/replacement date) based on measurable data such as age of asset and history of rehabilitation, and projects replacement and rehabilitation needs to advance a State of Good Repair (SGR).
  • It establishes a prioritization methodology aligned with Metro’s strategic goals and priorities and uses FTA’s TERM (Transit Economic Requirements Model) to prioritize all asset needs.

Here is a sneak peek of the CNI:

Read more…

Is New York City’s Select Bus Service A Potential Model for Improving Metrobus?

October 3rd, 2016 1 comment

New York City’s Select Bus Service may provide an excellent model – and a few cautionary lessons – for WMATA’s Priority Corridor Network and a Metrobus Off-Board Fare Payment System (OBFPS).

Earlier this year, a small team of planners from Metro’s Office of Planning, the Office of Bus Planning, the District Department of Transportation (DDOT), and DC Surface Transit had an opportunity to visit our colleagues in New York and to see their Select Bus Service (SBS) in action. Metro and our partners think it may provide both a good model and some cautionary lessons as we move forward with bus prioritization strategies, off-board fare payment, and the Priority Corridor Network.

Slower buses = worse service, higher costs

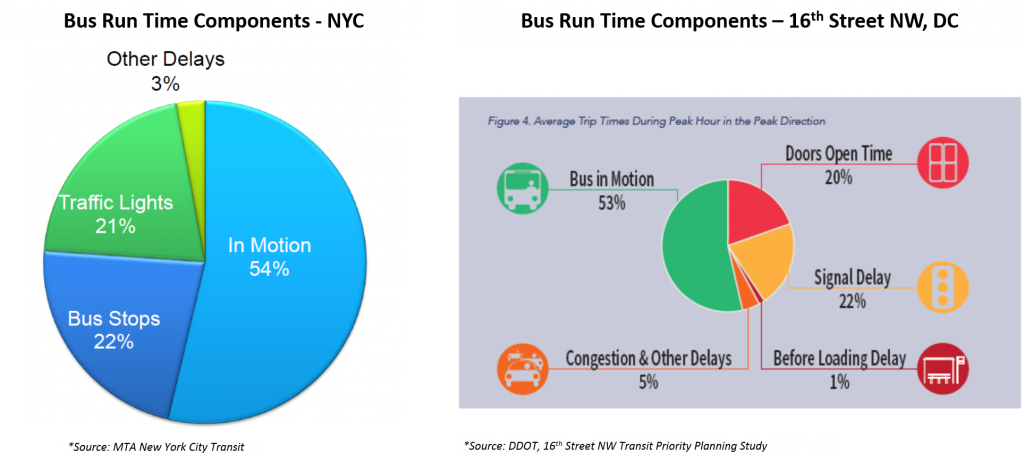
Just as we’ve experienced in and around DC, bus speeds in New York have fallen steadily over the past two decades, and continue to do so. As of 2013, the average speed for Metrobus routes is 10.5 mph. The system-wide average speed of a bus in New York has fallen to 7.5 mph, and routes serving some of the most congested corridors in Manhattan and Brooklyn are down to 4-5 mph. Traffic congestion generated by dynamic growth in jobs and population is the single greatest impediment to faster bus service, but it isn’t the only factor. Just as in our region, buses in New York spend only half of their in-service time actually moving forward; the rest is taken up by traffic signals and passenger boarding:

NYC and DC Average Bus Run Time Factors

Read more…

Prioritizing Bike and Pedestrian Station Access Projects Near Metrorail, Part 2

November 24th, 2015 Comments off

Other than ridership potential, what are some of the other ways we can rank access projects relative to each other?

In our last post, we discussed how bike and pedestrian access projects relate back to ridership and how that relationship could be used to prioritize projects. In this post, we talk about some of the other criteria we are using to prioritize projects.

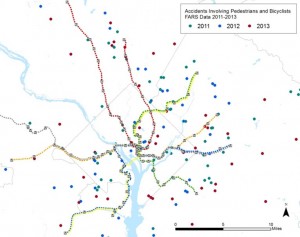
Bike and Ped. Fatalities, Sample Data Set

Bike and Pedestrian Fatalities, Sample Data Set

The first is safety. We are pulling together data about bike and pedestrian crashes near our stations that result in injuries or fatalities. We will then link these data in GIS back to the location the project, with the idea being that a new crosswalk or dedicated bike path in an area with a lot of recent crashes should score higher and deserves more attention. A safer path of travel helps not only our customers but all walkers and cyclists in these areas.

We also want to explore some other prioritization criteria. Here is what we have come up with: Read more…

Beyond Rush Hour – Taking a Peek at the Off-Peak

November 18th, 2015 3 comments

Metrorail ridership isn’t only about rush hour! Here’s a deeper look at why off-peak riders travel, and what segments are most traveled.

You may not be surprised that the peak period travel on Metrorail is dominated by commuting and business related trips.  Every day from opening to 9:30am, nearly 90 percent of passengers travel to work and business.  However do you know that over almost a third of daily ridership takes place in the off peak?  This post explores what is happening during weekday off-peak periods.

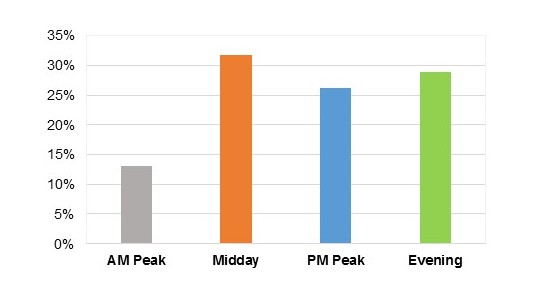
The weekday “off-peak” time typically refers to the weekday midday period (9:30am to 3:00pm) and the weekday evening period (from 7:00pm to closing), excluding late night service on Friday and Saturdays between midnight and 3:00am. In recent years, weekday off-peak travel demand has remained stable at 32 percent of the daily ridership, with the midday ridership at 19-20 percent and the evening ridership at 12 percent.

Most non-work trips, such as personal, recreational, and shopping trips, occur during the off-peak times and are spread fairly evenly between the midday and evening, as illustrated in Figure 1. 

blog figure

Figure 1: Percentage of Non-Work Trips by Time of Day (2012 Metrorail Passenger Survey)


The off-peak, non-work travel market has showed strong growth between 2007 and 2012 (our last two passenger surveys where we can distinguish between work and non-work travel). According to the Metrorail passenger surveys, off-peak non-work trips grew by 15 percent for the midday and evening from 2007 to 2012, higher than the 9 percent increase in the daily non-work trips. Read more…

Prioritizing Bike and Pedestrian Station Access Projects Near Metrorail

November 1st, 2015 Comments off

We all know improving station access is good.  But, how do we rank access projects relative to each other?   Step 1: Ridership

In our recent post, we gave you an overview of our Station Access Investment Strategy project.  We’ve identified 1,000s of recommendations for new pedestrian and bicycle infrastructure near our Metrorail stations and need a way to prioritize them.  After some thought, we’ve come up with a number of potential criteria.  In this post, we’ll discuss those that deal with ridership.

July 2014 Post on Ridership Potential from New Ped./ Bike Projects

Map of the Southern Ave walk shed from July 2014 Post on Ridership Potential from New Ped./ Bike Projects

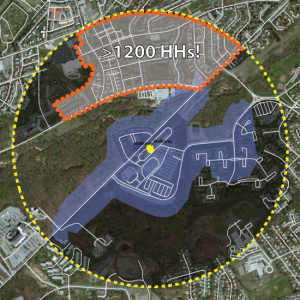
Once again, one of key concepts we’ve been telling you about in recent months is that by improving access to stations we can grow ridership.  For stations with relatively small walk sheds, we’ll conduct a detailed analysis of what happens to the walk shed when the proposed projects are built.  For example, add a sidewalk at Cheverly and the walk shed will grow by X%.  We will then look at the amount of households and jobs in the newly connected area and, using some methods we’ve shown you in other posts, calculate the potential ridership gained by the new project.  The higher the potential ridership gain, the better the project scores.

But, we also want to understand the value of a new project to a part of the station that is already connected to the network and how this could relate back to ridership.  To do this, we’ve come up some other metrics.  They include: Read more…

Three Tidbits: What The Metrobus 2014 Survey Can Tell Us

October 26th, 2015 7 comments

The latest survey of Metrobus riders is a gold mine of information about who our bus riders are, why they travel, and more. Here are the answers to just three questions:

Who’s on the Bus on 16th St. NW? Metro planners and DC residents alike have advocated for a possible bus lane on 16th St. NW, where Metrobuses carry over 50% of the people, are scheduled for about every two minutes, and are frequently bunched and overcrowded. The survey can tell us what kinds of riders use that corridor – giving us clues to what kind of new riders a bus lane might attract.

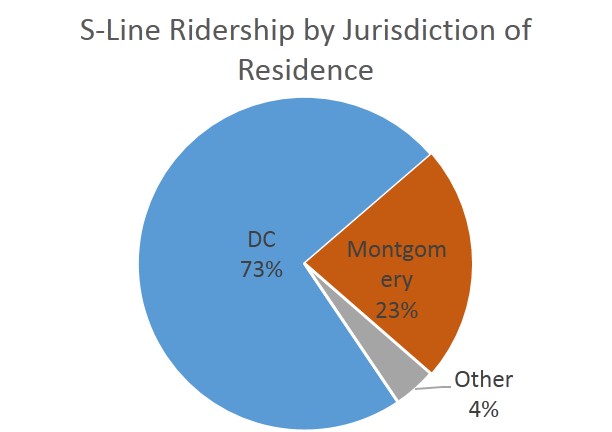
S-Line Ridership by Juris of Residence

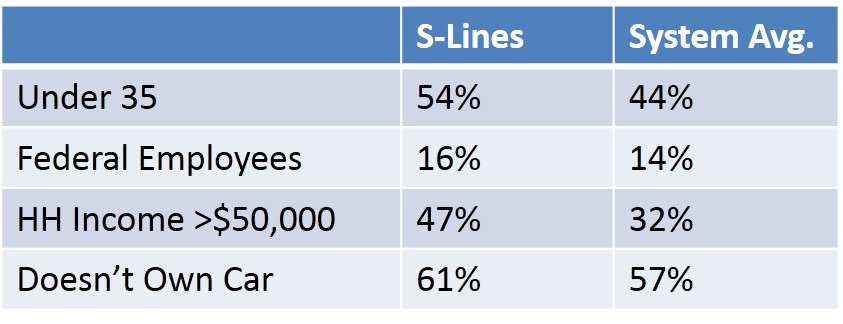
 S-Line demogs

Survey says:

  • Three quarters of S-Line (S1, S2, S4, and S9 combined) riders live in D.C., while the rest hail primarily from Montgomery County
  • S-Line riders are younger and more affluent, than the system-wide average for bus riders.
  • They are slightly more likely to be car-free and employed by the federal government, but the difference is very small.

Read more…

Metro Studying Ways to Improve Bike/Ped Access to Stations

October 7th, 2015 Comments off

Improving walk and bike access is a cost effective way to increase ridership and improve the efficiency of the Metrorail network.   Where are these improvements needed and how should we (as a region) prioritize them?

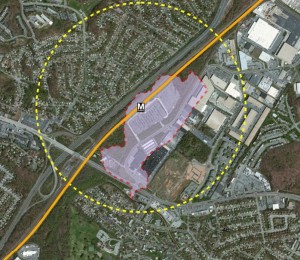
Landover Walkshed

What projects might increase the size of the walk shed of the Landover Metrorail station?

In a number of earlier posts starting last summer, we’ve discussed the concept of walk sheds and explored the relationship between walkability, land use, and Metrorail ridership.  One conclusion of this effort:  grow the size of the walk shed and you’ll grow ridership.

Generally, we only have control over what happens on our own property.  While we have made great strides in identifying and prioritizing bike/ped access improvements on our own property, increasing the size of the walk sheds requires coordination with state or local agencies who own, plan, design and construct roads, sidewalks and pathways near our stations.  We know that in order to have a larger impact on walk and bike access, we need to cast a wider net and identify projects that are up to one mile from our station entrance.  We have created a plan — the Station Access Investment Strategy — to highlight some of these projects as priorities for our local partners to use as they develop their capital improvement plans. Read more…