Metro needs over $17B in the next ten years to reach and maintain the State of Good Repair (SGR), which accounts for approximately 70% of its total needs over the same period.
As noted in our our previous post, Metro’s SGR needs are built off of a comprehensive inventory of existing assets as a part of the Capital Needs Inventory (CNI). Each record in this inventory documents the asset’s type, age, expected life, replacement cost, and other attributes required to assess that asset’s 10-year reinvestment requirements. SGR investments include:
- Rehabilitation that require capital maintenance (including major overhauls, renovations, or rebuilds)
- Replacements
- Annual capital maintenance (generally occurs for larger assets such as tunnel or bridges, which require periodic infusions of capital to maintain SGR).

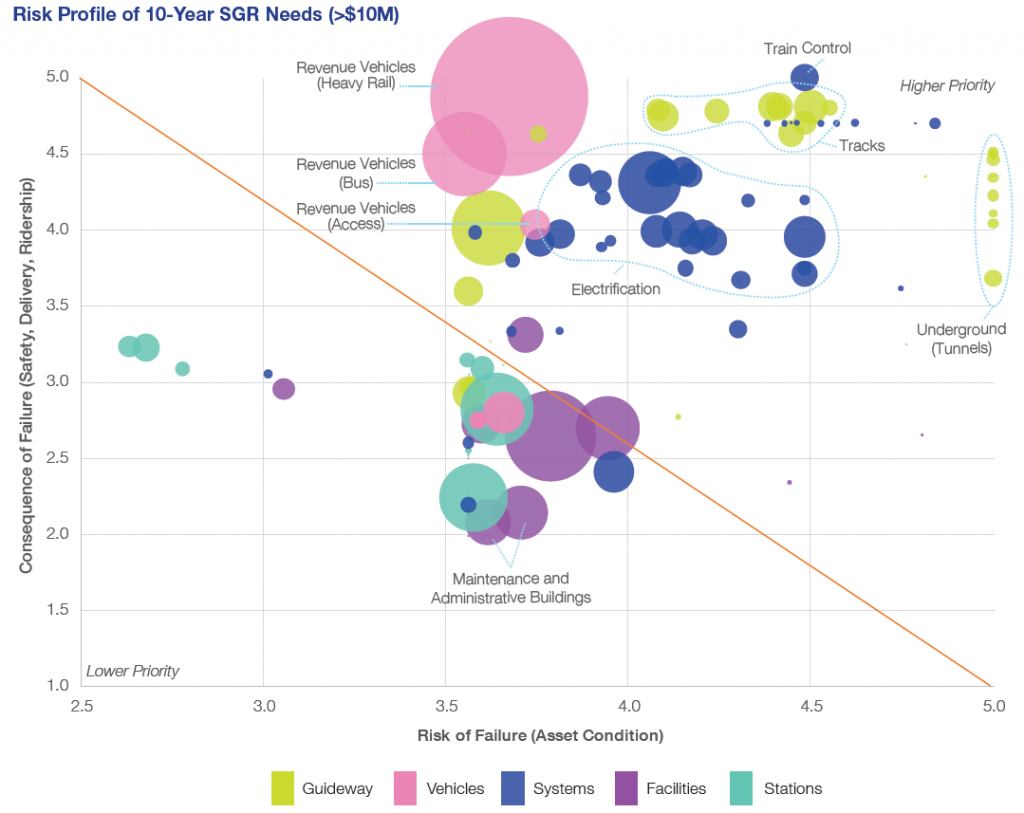
Fig. 1: Risk profile of SGR needs for assets > $10M (click for full report)
After being inventoried, the existing assets then went through the prioritization process using the risk-based prioritization approach, as described in Ramona’s blog post. Figure 1 illustrates the risk profile of SGR investment needs for assets exceeding $10M, based on the risk of failure and the consequence of failure. The asset groups above the diagonal line carry a higher level of risk and have bigger impacts on safety, reliability, and ridership.
Ten-Year SGR Needs
Given the 10-year SGR needs total to $17B alone, what are some of the major investments that are involved?
- Railcar Replacement and Rehabilitation Program: $5B over the next 10 years, which is about 28% of total SGR needs.
- Track and Structure Rehabilitation Program & Rail Systems Program: $3B each, to reach and sustain SGR. The combined $6B for both programs will cover fixed rail, guideway structures, track maintenance equipment, electrification, communications, signals, and other related assets.
- Bus & Paratransit Program: $2.3B for fleet, facilities, and maintenance equipment.
- Stations and Passenger Facilities Program: $2.4B to improve or upgrade platforms, station structures, vertical circulation, fare collection, and parking facilities.
- Business Support Program: $1.7B to maintain and upgrade software and hardware, supporting equipment and services, as well as the Metro Transit Police Department’s assets.

Fig. 2: Total current SGR backlog (click for full report)
Backlog and Compliance Needs
Metro’s SGR needs include $6.66B in backlog, also known as deferred asset needs. The assets in the backlog require immediate reinvestment as they are past their useful lives or require rehabilitation or replacement due to compliance issues. Metro’s backlog needs make up approximately 16% of Metro’s total asset base across all asset categories. The largest proportion of backlog are in major systems such as traction power and train control (Figure 2) with guideway elements (i.e., track, tunnels, bridges, and other structures) making up the next largest portion of deferred needs. About 30% of the backlog are compliance based investments such as safety directives to replace track circuits and improve tunnel ventilation. These items, totaling $2B in needs, have been marked as priority as they are needed to address compliance and/or regulatory requirements.
Scheduled SGR Needs
Over the next ten years, different assets will be due for scheduled SGR investments. For example, besides the ongoing replacement of the 1000- and 4000-series rail cars, Metro will need to complete the replacement of the 2000-, 3000-, and 5000-series rail cars during the period of the CNI, along with rehabilitation of all fleets to maintain SGR.
Given that Metro’s capital budget averaged $1B a year for the past six years, maintaining assets in a SGR as identified by the CNI would require an annual average of $1.7B in the capital budget – a 62% increase above today’s level. To support CNI’s SGR investments, Metro would need the region to significantly increase funding to execute these important needs and keep Metro healthy into the future.
What do you notice in this list of repair needs? Are there any surprises?


Recent Comments