Posts Tagged ‘metrorail survey’

Where Are Metro’s Federal Customers Going? (2 of 5)

December 1st, 2015 Comments off

Employees of the federal government comprise 27% of Metro’s weekday ridership, but what rail stations and bus routes are they using?

(Second in a series of posts on Metro’s Federal Customers – see post 1)

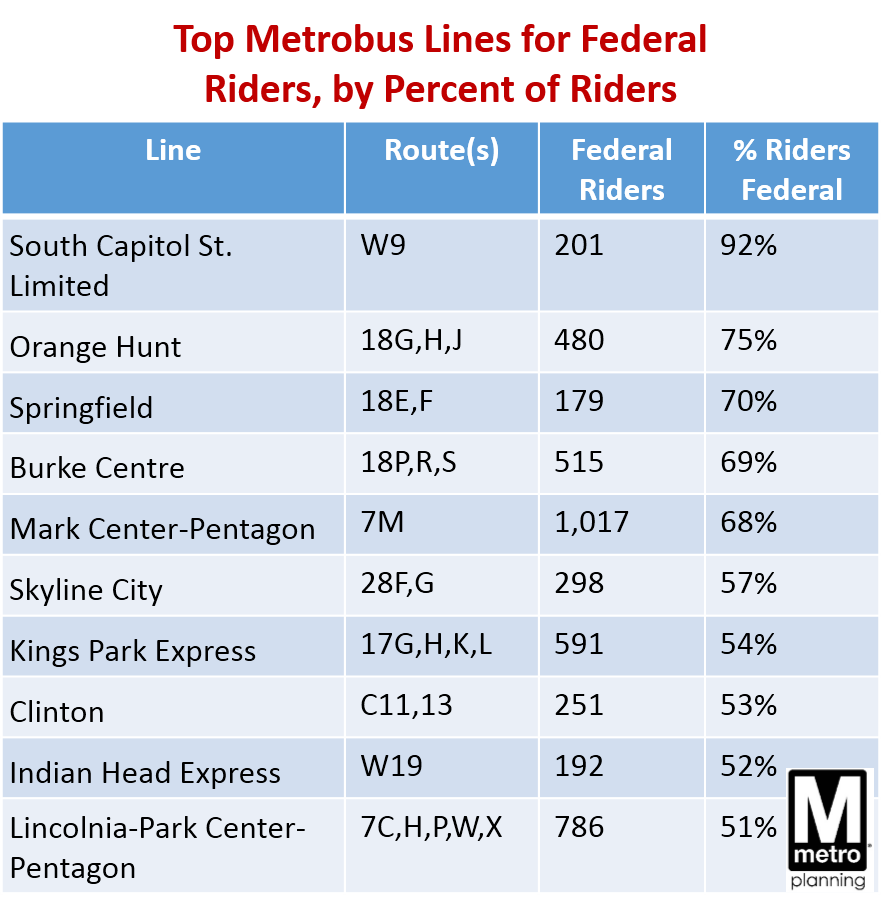
On Metrobus, federal workers are about 10-20% of most bus routes’ ridership, with a few logical exceptions. Federal ridership is higher on bus routes that are more “peaked” and commute-oriented, and/or on routes that directly serve federal facilities.

Top Metrobus Lines for Feds, by Pct of Riders

Read more…

Beyond Rush Hour – Taking a Peek at the Off-Peak

November 18th, 2015 3 comments

Metrorail ridership isn’t only about rush hour! Here’s a deeper look at why off-peak riders travel, and what segments are most traveled.

You may not be surprised that the peak period travel on Metrorail is dominated by commuting and business related trips.  Every day from opening to 9:30am, nearly 90 percent of passengers travel to work and business.  However do you know that over almost a third of daily ridership takes place in the off peak?  This post explores what is happening during weekday off-peak periods.

The weekday “off-peak” time typically refers to the weekday midday period (9:30am to 3:00pm) and the weekday evening period (from 7:00pm to closing), excluding late night service on Friday and Saturdays between midnight and 3:00am. In recent years, weekday off-peak travel demand has remained stable at 32 percent of the daily ridership, with the midday ridership at 19-20 percent and the evening ridership at 12 percent.

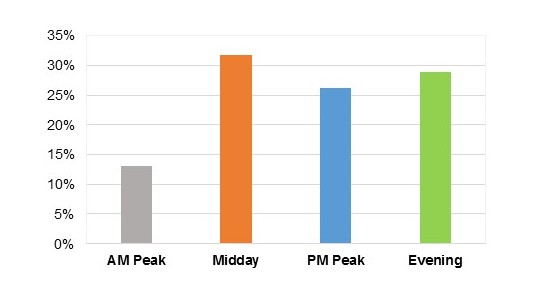
Most non-work trips, such as personal, recreational, and shopping trips, occur during the off-peak times and are spread fairly evenly between the midday and evening, as illustrated in Figure 1. 

blog figure

Figure 1: Percentage of Non-Work Trips by Time of Day (2012 Metrorail Passenger Survey)


The off-peak, non-work travel market has showed strong growth between 2007 and 2012 (our last two passenger surveys where we can distinguish between work and non-work travel). According to the Metrorail passenger surveys, off-peak non-work trips grew by 15 percent for the midday and evening from 2007 to 2012, higher than the 9 percent increase in the daily non-work trips. Read more…

Metrorail Rider Incomes – A Closer Look

June 29th, 2015 5 comments

Salaries of actual riders are needed to paint a true picture of Metrorail ridership by line.

The Washington Post recently featured a series of images from the You Are Here project of the Social Computing Group at MIT showing Metrorail median income by line and station.  We were digging into it and realized it uses median household income within a half-mile radius, and not that of the actual riders’ households.  While we’ve mapped low-income riders before, we set out to answer the question, “What is the actual average income of Metrorail riders by line and station?”   Along the way, we developed this interactive data visualization.

dashboard

Screenshot of Metrorail rider income by station visualization. Click image for full interactive version.

The biggest overall difference between our work and that of the MIT group is higher  household incomes at end-of-line stations on the eastern side of the region.  These stations, while located in lower income areas, have large parking facilities that draw commuters from all over the region and beyond. Read more…

Going Up – Why the Construction Pipeline Means Higher Metrorail Ridership (Part One)

April 6th, 2015 5 comments

We’ve claimed that Transit-Oriented Development (TOD) projects in this region will be critical to Metrorail ridership and sustainability. The good news is that our assertions are grounded in statistically rigorous evaluations of TOD’s impact on Metrorail ridership – here’s how. (Part one of a two-part series).

While factors like fares, service, and the economy can certainly explain some changes in Metrorail ridership, one absolutely fundamental explanation of differences in walk ridership between stations is development.  Why does a station like Landover see only 50 riders arrive on foot each morning, and a station like Crystal City see over 3,000?  Why does a station like Bethesda see balanced ridership in all directions, where a station like Suitland is almost entirely one-direction? Development. Even a simple scatter plot shows that households alone near the station explain 70% of AM Peak walk ridership!

Planning studies have long-posited that transit-oriented development is such a key part of driving ridership, and if that is the case, then TOD is vitally important to Metro’s long-term financial sustainability.  We at Metro needed to quantify this link in a more sophisticated and system-specific way, and so we created a way to calculate the impact of land use changes (household growth, employment growth, new development) on ridership and revenue.

What is a Land Use-Ridership Model? To help, Metro’s Planning Office has built a Land Use-Ridership Model that will predict changes in Metrorail ridership as a result of occupancy changes (growth, decline, new development, etc.) in the station area.  This model helps us get very specific when it comes to modeling the impact of land use changes on ridership and revenue.  It helps us answer questions such as: “When developers build a new apartment building next to a Metrorail station how much ridership and revenue will Metro realize?”, and; “If an office building is proposed at one of four Metrorail stations, which location maximizes ridership and revenue without exacerbating core capacity constraints?”

LURM general flow

This tool is based on a rigorous understanding of the link between land use and the rail ridership we see today and is built on “direct ridership modeling techniques” found in academia.  It also focuses specifically on “walk ridership” (which constitutes 38% and 78% of our AM and PM peak ridership), since rides related to bus transfers, parking, and other access modes are less related to adjacent land uses.

To build this, we analyzed the actual quantity of walkable land uses from each station area, assembled detailed information about land uses and densities in those areas (households, jobs by industry type), and also controlled for other, non-land-use factors that shape ridership – like network accessibility. In all we worked through over 200 independent variables in our modeling and also brought in experts from the University of Maryland’s Center for Smart Growth, professors Hiroyuki Iseki, Ph.D. and Chao Liu, Ph.D., to bring their analytical and statistical firepower to the fray.

How We Built It. We defined the walkable area as a half-mile walk along a road network, so we account for barriers like highways and fences.  The half-mile cutoff is a bit longer than the median actual walk distance reported by our riders in the 2012 Metrorail Passenger Survey. For each station and its walk shed, we tested the following kinds of factors: Read more…

Metrorail Riders Go Car-Free… Every Day!

September 19th, 2014 Comments off

Many pledge to leave their car at home for a day on Car-Free Day September 22,but 20% of Metrorail riders don’t own a car and go car-free every single day!

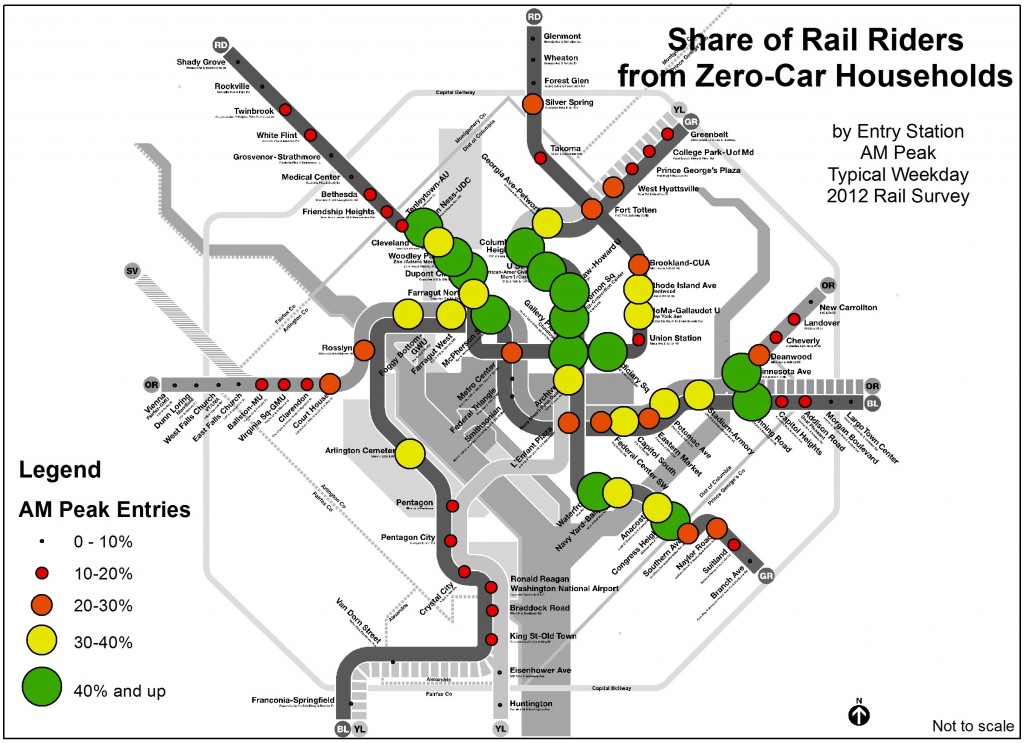
Of course, Metrorail riders from zero-car households vary significantly across the stations – from over half of all riders at places like Columbia Heights, Benning Road, and Dupont Circle – to less than 10% at more suburban areas like Rockville, East Falls Church, or Franconia-Springfield.  The diagram below shows the share of riders who live in a zero-car household, by station:

RailMap-Diagram_CarFreeHHsPCT_forweb

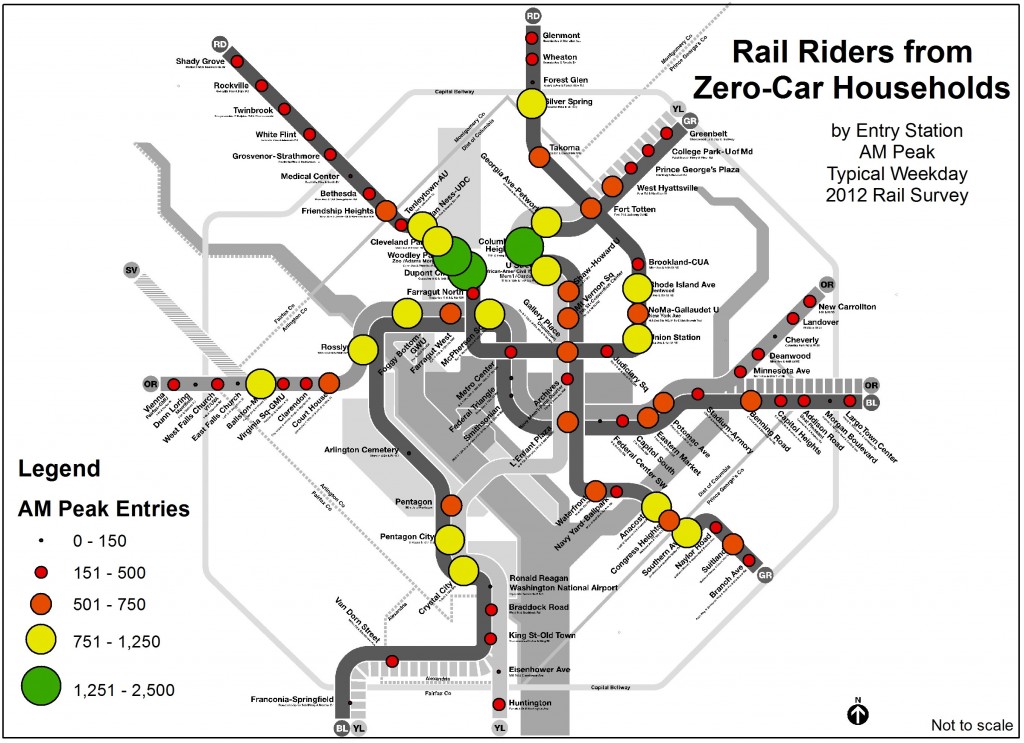
Of course, ridership varies across stations too, so the next diagram shows the total number of rail riders from zero-car households:

RailMap-Diagram_CarFreeHHs_forweb

In addition to riders who are completely car-free, many others come from “car-light” households of one or no cars.  58% of Metrorail riders come from “car-light” households.  For many, access to Metrorail and Metrobus and other transit services is a big reason they can drop down to one or zero cars and still get around.  In fact, DC’s zero-car households number is climbing, with 88% of new DC households car-free.  For others, car ownership is a heavy financial burden they may not be able to afford. Stay tuned for a coming post which estimates riders who are car-free by choice, vs. by necessity.

Do you live in a car-free household?  How does Metro help meet your mobility needs?

The data shown here is derived from our 2012 Metrorail Passenger Survey and the raw data is available (.xlsx, 19k).