Posts Tagged ‘Metrorail’

MetroRail – Designed for Performance

January 19th, 2017 Comments off

Though it has several key constraints, the Metrorail System’s capacity compares favorably with its peers and even out-performs them in several key measures.

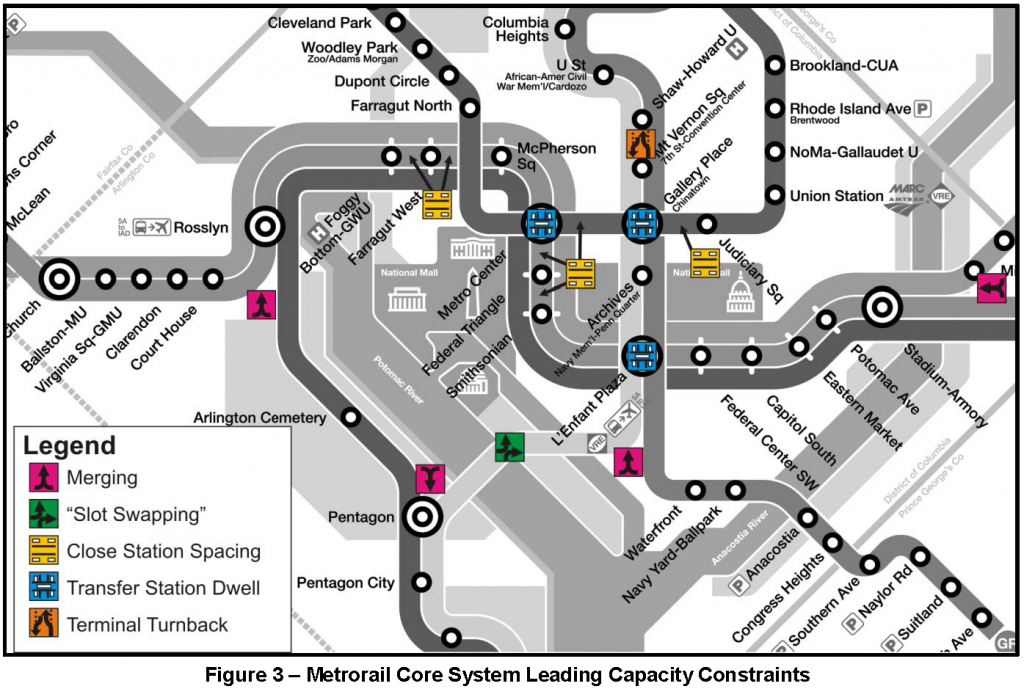
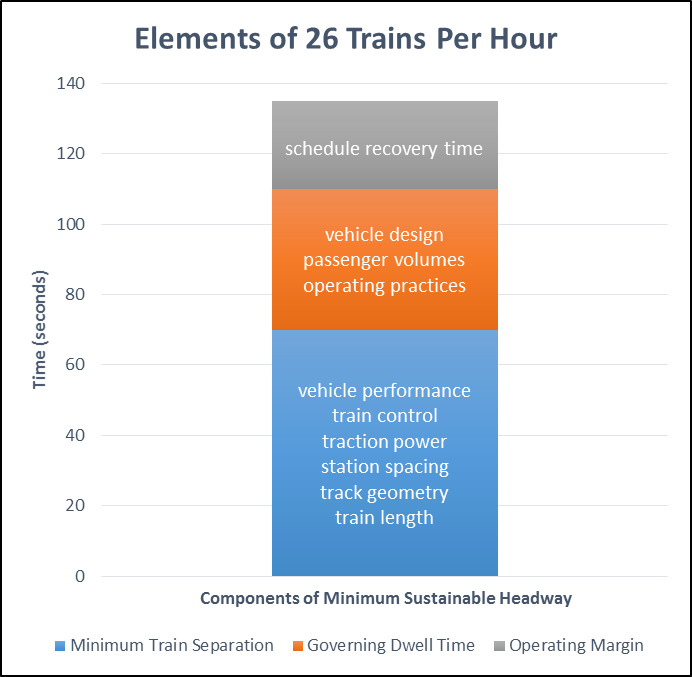
In a previous post, we explained that Metro doesn’t schedule more than 26 trains per hour at any point in an effort to balance reliability with high capacity operations. But it also raises some interesting questions: How does Metrorail’s capacity compare to peers? How does Metrorail compare to its peers in terms of train throughput and what are the specific constraints that prevent trains from operating more frequently? Are there any ways to increase the capacity of the existing system beyond 26 trains per hour?

We developed a white paper (PDF) to answer those questions. Some of the findings might surprise some Metroskeptics or armchair transit planners, but Metrorail has among the highest capacity infrastructure in the industry, which – when in a state of good repair – allow it to outperform its peers in a number of key areas.

core-constraint-graphic Read more…

Switching Things Up for Winter Operations

December 19th, 2016 4 comments

With the impending colder weather, Metro is piloting some new track equipment to fight the snow and ice and maintain overground rail service.

Snow on tracks at Twinbrook Station

Snow on a track switch at Twinbrook Station

As a pilot project funded through Metro’s Sustainability Lab, we have replaced the switch heaters at Glenmont Yard with a new energy efficient heater that not only reduces energy consumption, but is also easier to install and maintain.

Switch heaters are vital to winter operations, providing radiant heat to track switches to prevent them from icing up and restricting train movements. Within the Metrorail system, each rail yard controls its heaters on an individual basis, and heaters are frequently in constant operation during the winter to allow tracks to remain operational.

Glenmont is Metro’s smallest yard and also has one of Metro’s more expensive electricity rates, so it was an ideal candidate to pilot the new heaters. Should testing prove successful this winter, we could adopt this new style of switch heater as standard across 58 miles of surface revenue track and 8 Metrorail yards.  This could save Metro over $110,000 annually in energy costs.

Each year the Sustainability Lab tests out new ideas such as these switch heaters for large-scale deployment, and we would love to have your help in finding ways to reduce resource consumption and improve service. Whatever the idea, we’d love to hear your thoughts and consider them.

So help us think big! Submit your ideas online or email them to planning@wmata.com.

Marriott’s Headquarters in Bethesda Helps Metro

November 29th, 2016 1 comment

The relocation of Marriott’s headquarters to downtown Bethesda would bring new riders and revenue to Metro, without straining Metro’s capacity. A win-win!

bethesda_aerial

Downtown Bethesda

Marriott last month announced it will move its headquarters to downtown Bethesda, bringing over 3,500 employees to a location that’s now accessible to the Red Line. The move will help Metro by attracting more riders and fare revenue to the Red Line.  Using our S.W.A.R.M. model, we estimate that the new headquarters will bring about 1,200 new boardings/day on Metrorail, and over $1 million per year in new fare revenue.

What’s more, we’ve already got space for these new riders.  Since most of the new riders would be reverse-commuters (towards Bethesda in the morning) or would originate in Montgomery County, they would not strain existing crowding on-board trains at our pinch points, a.k.a. our maximum load points. Bethesda station has sufficient vertical circulation capacity for them as well.  In short, this move is a win-win for Metro, the riders, and our funding partners, and we applaud the decision.

Metrorail Usage Data to Inform Analysis of the Current Budget Proposal Regarding Early Closures

September 23rd, 2016 2 comments

Data can help inform understanding of the potential impacts and mitigating strategies for potential changes to Metrorail’s span of service.

sunday_night_trend

Metrorail ridership after 10 PM on Sundays, by month, since August 2010. The black line is the average, the yellow band is one standard deviation +/- average. The dashed line is the maximum.

In June of 2016, Metro began closing at midnight on weekend nights to allow more time for track work over the weekends, in support of the SafeTrack program.  The Metro GM/CEO has recently announced he will pursue making this service change permanent.  To meet the necessary track work requirements to get the system in a state of good repair – recommendations which the FTA and others have also made – the current budget proposal for FY 18 includes various additional early closure options, including ending Metrorail service at 10 PM on Sundays.

Staff from across the agency are currently working to assess the impact of such closures on customers and determine what strategies we might employ to replace some or all of that rail service with alternatives.

Similar to our data release related to SafeTrack, we are glad to provide ridership data to assist with analyses by our local partners and members of the transit advocacy community.

First, average, standard deviation and maximum ridership after midnight on Friday and Saturday, and after 10 PM on Sunday by month, station, and hour, from 2010 to 2016.  (Excel, 13 MB)  The graph above illustrates one dimension of this data:  the average, usual range and maximum system ridership on Sundays by month since August 2010.  The biggest spike there is during Obama’s second inauguration weekend.  There is a lot to learn from this data set.

Secondly, we’ve put together Metrorail entries by half hour by day type.  The full dataset is available for download, but the relevant data is presented in the image below, showing the half-hour segments that have the lowest ridership.

span_of_service_ridership

We have also assembled additional visualizations of ridership during the potentially impacted periods: Read more…

Pledge to Go “Car Free” on September 22!

September 19th, 2016 Comments off

Planning to Walk, Bike, Telework or Take Metro on September 22?  Then take the pledge to go Car Free.

Car Free Day is this Thursday, September 22.  Any of us who live or work in the Washington region can pledge to go Car Free or “Car Lite” (meaning some access to a car or van pool) to help raise awareness  about alternative modes of travel relative to driving alone.  In addition to showing your support for a good cause, you might even win a prize.

Interest in Car Free Day is widespread, from folks who don’t even own cars (see our post from a few years ago) to folks who typically drive alone to work and may need a little encouragement to try something else.  Last year, more than 3,500 people pledged to go car free in the region.  About 38% said they would bike, 22% would take rail, and 17% said they would use a bus as their primary mode of transportation.  As with Bike to Work Day, events like Car Free Day can have a lasting impact beyond the one-day event by leading people to make changes in the ways they choose to get around.  So help bring up this year’s number of pledges by signing up today.

The Origins of Metro’s 26 Trains Per Hour Limit

August 22nd, 2016 6 comments

Why can’t Metrorail reliably operate more than 26 trains per hour per direction? A 2001 study defined the basis for determining this constraint.

Although it has been known for years, the July 2014 opening of the Silver Line and corresponding reduction of rush hour Blue Line service highlighted that Metro cannot schedule more than 26 trains per hour (or a train every 2-2.5 minutes) across any point in its rail network. Though it’s been discussed many times through the years, let’s explain this limit in detail now.


Read more…

Identifying Metro’s Growing non-English Speaking Communities

August 17th, 2016 1 comment

With a wide variety of languages spoken in our region, Metro uses the latest Census data to inform how we reach out to the diverse communities we serve.

Federal Transit Administration (FTA) guidance to transit agencies on meeting the needs of limited English proficient (LEP) populations – i.e., those who have a limited ability to read, write, speak, or understand English – says that the agency should provide written translation of vital documents for “each eligible language group that constitutes 5 percent or 1,000 persons, whichever is less, of the total population of persons ‘eligible to be served’.” For a region like ours, that’s a pretty tall order as there are more than 26 non-English language groups where there are more than 1,000 speakers of the language. However, by aggregating the latest Census-based language data for areas near our Metrorail stations and bus routes, we can develop a better understanding of the linguistic diversity in Metro’s service area as well as the proportion of LEP persons.

To ensure rider communication and meaningful public outreach to these language populations, Metro develops a Language Assistance Plan that is updated every three years, with the next update due in 2017.   The Census language data developed for this document guides the types of  information we need to translate and helps inform our public outreach activities.   This latest round of language data shows that the top seven languages spoken in our service area are Spanish, Korean, Vietnamese, Chinese, French, Arabic and Amharic. For these languages, we provide written translations of all vital materials and offer language assistance services upon request. The map below shows the predominant LEP populations near each Metrorail Station along with the proportion of LEP speakers for each language.

LEP system Map 1

Read more…

Categories: Engage Tags: , , , ,

Introducing S.W.A.R.M. – Another Tool For Your TOD Toolkit

August 11th, 2016 1 comment

A new tool helps estimate ridership and revenue from transit-oriented development projects near Metrorail stations.  Download it for yourself!

Waterfront Sta aerial

For months we have been detailing our work that quantifies the relationship between land use and rail ridership. This is important because Metrorail has been experiencing large changes in ridership, and we were interesting interested in understanding why certain station areas – like Navy Yard and NoMa – were showing ridership gains while the system as a whole is experiencing losses in the long arc of ridership growth.

To get to the bottom of this, we worked with researchers from the University of Maryland’s National Center for Smart Growth to analyze how walk ridership at a Metrorail station relates to its surrounding land uses, and create a tool that accurately estimates the likely change in ridership from changes in land uses. This tool, the Station Walk Area Ridership Model (or S.W.A.R.M., for short), helps us estimate the potential impacts of land use changes – new households, new jobs (by type of employment!), and even changes in the station’s walkshed – on ridership and revenue to Metrorail. Read more…

We Heard You! MyTripTime Provides Personalized Information On Your Metrorail Trips

July 28th, 2016 6 comments

Starting Wednesday, July 27th, Metrorail customers can see their own, personal on-time score for trips that they’ve taken over the past 90 days by logging into the SmarTrip website.

Metro has a long history of reporting system-wide performance via our quarterly Vital Signs reports. However, our customers often say that this information doesn’t resonate with their own experience because it averages things out across all operating hours and all stations.

Customers: we heard you! MyTripTime reports your own, personal on-time score based on every trip that you’ve taken over the past 90 days.

Screenshot of My

Screenshot of MyTripTime, from smartrip.wmata.com

Read more…

Categories: Engage Tags: ,

Walk This Way – Metro’s Planning Office at APTA’s Rail Conference

July 11th, 2016 Comments off

Metro shared its Station Area Investment Plan with the APTA Rail Conference attendees – and met with rave reviews.

I recently had the opportunity to present our Station Area Strategic Investment Plan to the over 1,500 attendees at APTA’s Rail Conference.  Many thanks to APTA’s Sustainability and Urban Design Standards program for footing the bill for this trip to Phoenix. It was 117 degrees there, and tested even my desire for walkable urbanism, but that’s another story entirely.

The presentation highlighted the Office of Planning’s work to quantify the return on investment of station area accessibility improvements, work with local jurisdictions, to prioritize these improvements based on an analytical platform, and identify the appropriate funding mechanisms to get these improvements built.

Read more…