Posts Tagged ‘BRT’

Is New York City’s Select Bus Service A Potential Model for Improving Metrobus?

October 3rd, 2016 1 comment

New York City’s Select Bus Service may provide an excellent model – and a few cautionary lessons – for WMATA’s Priority Corridor Network and a Metrobus Off-Board Fare Payment System (OBFPS).

Earlier this year, a small team of planners from Metro’s Office of Planning, the Office of Bus Planning, the District Department of Transportation (DDOT), and DC Surface Transit had an opportunity to visit our colleagues in New York and to see their Select Bus Service (SBS) in action. Metro and our partners think it may provide both a good model and some cautionary lessons as we move forward with bus prioritization strategies, off-board fare payment, and the Priority Corridor Network.

Slower buses = worse service, higher costs

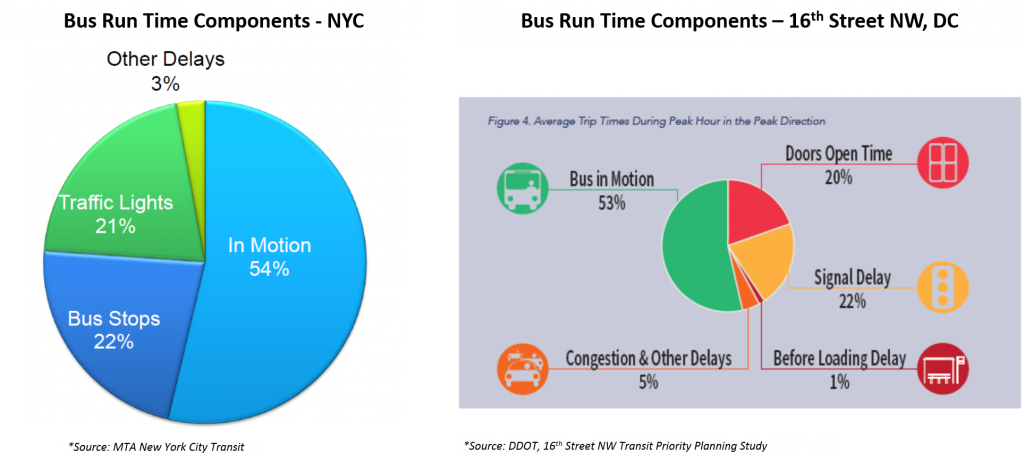
Just as we’ve experienced in and around DC, bus speeds in New York have fallen steadily over the past two decades, and continue to do so. As of 2013, the average speed for Metrobus routes is 10.5 mph. The system-wide average speed of a bus in New York has fallen to 7.5 mph, and routes serving some of the most congested corridors in Manhattan and Brooklyn are down to 4-5 mph. Traffic congestion generated by dynamic growth in jobs and population is the single greatest impediment to faster bus service, but it isn’t the only factor. Just as in our region, buses in New York spend only half of their in-service time actually moving forward; the rest is taken up by traffic signals and passenger boarding:

NYC and DC Average Bus Run Time Factors

Read more…

Tens of Thousands of Customers Relied on Metrobus During SafeTrack Surges 3 and 4

September 12th, 2016 Comments off

Surges 3 and 4 saw the highest shuttle bus ridership of SafeTrack so far. Overall, Metrobus shuttles moved around 17,000 trips per day during Surge 3, and around 25,000 trips per day during Surge 4.

With shuttles every 2.5 minutes and Metroway running every 6 minutes, there were about 35 buses per hour during peak periods on Route 1. Taken together, the two services moved about 31,000 passengers per day during Surge 4. As a comparison, that stretch of road serves about 41,000 cars per day.

A small portion of shuttle bus ridership was on the Franconia to Pentagon shuttle, with the remainder on shuttles between Pentagon City, Braddock Road, Crystal City, and National Airport. The sheer volume of ridership on the shuttle buses made the shuttle operation Metro’s busiest bus line, albeit temporarily. At 25,000 trips per day, the shuttles moved more riders than we typically move on any other major bus route, including some of the busiest like 16th Street NW, or the various 30’s buses.

Not all rail customers chose to use the shuttles.

Some riders, especially those traveling locally, switched to other bus routes. Ridership on the Metroway premium bus service more than doubled compared to June, and during Surge 4, it nearly tripled compared to the same period last year! Ridership on the 10A was up 29-64%, and 11Y ridership was up 128-133%, or more than double. Metrobus added service on all of these alternative lines, and Metroway did not charge fares during the Surges. We will be monitoring future ridership to see if any customers decide to remain with Metroway after the surges end.

Overall bus ridership on other lines in the Surge area was up 1%.

These first SafeTrack surges highlight one of bus’ key attributes as a mode: flexibility.

Metrobus has supported the SafeTrack work by moving tens of thousands of passengers along corridors that don’t normally see that level of demand for bus service, in different locations every couple of weeks. There’s been plenty of work behind the scenes to make that happen:

  • The planning and scheduling team has worked out which routes the buses should take, which bus bays they should use at the stations, what time the buses need to leave the garages, and more.
  • Our customer facilities team has ensured there were signs up at all the stops and stations pointing the way to bus service.
  • The bus maintenance team has kept all the buses for SafeTrack up and running.
  • The street operations staff have answered passengers’ questions and worked with the Bus Operations Communications Center and the bus operators to make sure everything ran smoothly.
  • Bus operators have learned new routes in a very short amount of time and safely taken tens of thousands of passengers where they needed to go.

Usually, Metrobus makes service changes only about once a quarter, since passengers count on the consistency and reliability of our service. But when it’s needed, bus service can be very nimble, allowing it to support the important maintenance work being done during SafeTrack.

Did you ride Metroway or the shuttles during Surge 3 or 4? What did you think? What other opportunities are there to capitalize on the flexibility of bus service?

SafeTrack’s Surge 2 Bus Shuttle Proves Bus Rapid Transit Can Work Here

June 28th, 2016 Comments off

The shuttle buses at Eastern Market during Surge 2 are arriving every two minutes at rush hour, and are moving nearly the same number of people as 3 lanes of Pennsylvania Avenue SE.  This shows how much we can achieve by giving buses priority – lanes, signal priority, and more – on busy streets. 

27234765704_310d840f17_k

Commuters transferring from shuttle buses Eastern Market station (photo by author)

For the last week, Metrobus has been operating bus shuttles between Eastern Market and Minnesota Avenue and Benning Road, to provide alternatives around SafeTrack Surge 2 while we rebuild tracks and infrastructure on that segment of Metrorail.  While still moving less than half the the riders as what Metrorail normally moves, the shuttles are moving an impressive number of people:

  • In the morning rush hours, buses are arriving at Eastern Market every 2 minutes on average
  • Shuttle buses are delivering 1,800 people per hour to Eastern Market between 8:00 and 9:00am.  This is about the same as the number of vehicles that 3 lanes of Pennsylvania Ave. SE typically moves (1,500-2,000 vehicles per hour per direction, according to TPB Regional Transportation Data Clearinghouse).
  • Around 16,000-17,000 people per day are riding the shuttles, or about two-thirds of the number of vehicles driven through the corridor in a day (25,000 average annual daily traffic)
  • Traffic Control Officers from DDOT are critical to this operation, ensuring that everyone moves safely and efficiently

Read more…

Regional Transit Opportunities Explored

February 11th, 2016 2 comments

You name it, we tested it as possible opportunities to carry future demand and here’s what we found out.

Metro is completely focused on safety, reliability, and financial stability.  It’s also our job to ensure that the regional transit system improves mobility and connects communities.  So we’ve had many posts on ConnectGreaterWashington over the last few years describing the importance of a regional approach to transit planning. Posts include FAQs, how different modes compare, the paramount importance of transit-supportive land use, an approach to assessing Metrorail, BRT, and LRT expansion projects, and the overall proposed plan for Metrorail and surface transit to name a few.

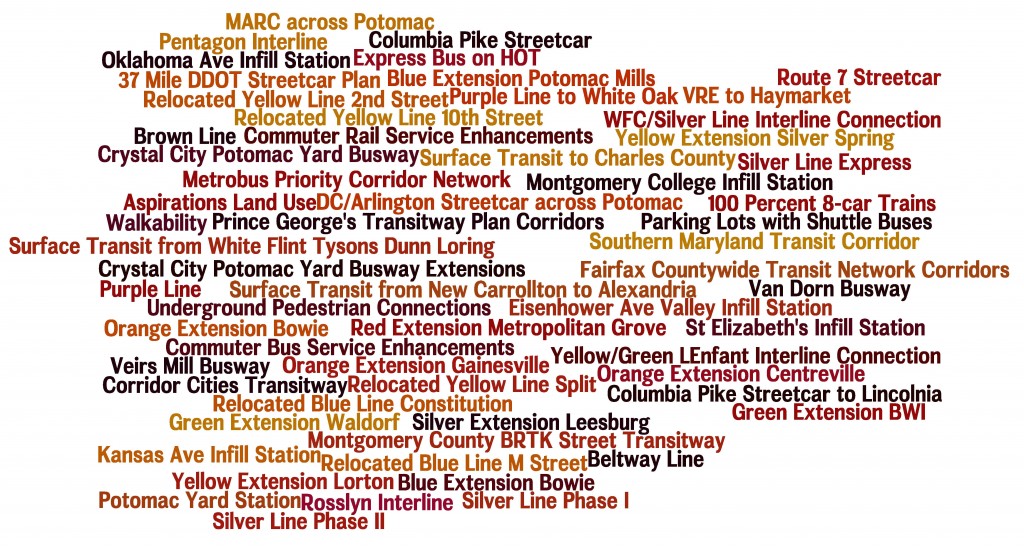
List of Transit Corridors, Projects, and Plans Analyzed as Part of CGW

List of Transit Corridors, Projects, and Plans Analyzed as Part of CGW

Finally, we have completed a set of one- to two-page summaries for all the strategies, plans and projects we tested in our evaluation of future needs and opportunities. Note, these summaries are inclusive of everything that we analyzed over the course of ConnectGreaterWashington, but only some are recommended to advance. Some strategies were recommended (e.g. eight-car trains), others were not recommended (e.g. Kansas Ave. infill station), while many were partially recommended (e.g. the I-66 corridor beyond Vienna shows promise as bus rapid transit, light rail, or enhanced bus, but not Metrorail unless and until additional housing and/or jobs are guided to the station areas and new Metrorail lines are added in the core).

Due to the size of the pdfs, the summaries are divided into three documents. First, are the new Metrorail lines in the core, eight-car trains, and interline connections (pdf updated February 24, 2016). Second, are Metrorail pedestrian tunnels, extensions, and infill stations (pdf updated February 24, 2016). Third, are all of the other modes’ strategies, plans, and projects (pdf updated February 24, 2016). All documents include bookmarks to help you find the various summaries by topic area.

Each strategy, project, or plan includes:

  • A summary of the strategy;
  • The goals that were addressed;
  • The regional activity centers connected;
  • A map that shows the project or plan;
  • Key findings for each such as ridership (including new transit riders vs riders gained from other existing modes), transfers, crowding, connectivity, and surrounding density; and
  • Recommendations for this strategy.

As we and the region continue to grapple with today’s safety, operations and maintenance needs, while also planning for future growth, we will continue to refer to the CGW work undertaken to date. Let us know how you can imagine this body of work being used in the future.

How Can the Transportation Planning Board Support Metro?

January 13th, 2016 Comments off

Metro and the Transportation Planning Board (TPB) engaged in a wide ranging discussion with TPB board members about how the TPB and the region’s jurisdictions can support Metro now and in the future. Not surprisingly, there’s a lot more to it than just predictable funding.

At the December 16th Transportation Planning Board (TPB) meeting (audio), Metro Board Member Harriet Tregoning gave the final presentation (pdf) and facilitated a discussion on Metro’s challenges and provided specific recommendations and/or opportunities for the TPB and local jurisdictions to increase their support the Authority today, tomorrow, and into the future. The focus of the discussion was specifically on plans, processes, and actions that the TPB and local jurisdictions can modify or begin that will ensure predictable funding and/or enhanced funding options, incorporate land use as a transportation strategy, increase transit-supportive land use decisions, prioritize bike and pedestrian access, and advance bus priority on the streets that local jurisdictions operate.

Last summer, TPB members requested a more extensive conversation surrounding Metro’s challenges as well as recommendations on how TPB, through its plans and processes, and local jurisdictions, through their decisions and funding, could support Metro. Metro opted to provide three presentations and the December presentation built on information provided at the November 18th meeting (audio) on Metro Fundamentals (pdf) and Momentum (pdf) that were given  by Tom Webster, Managing Director of Metro’s Office of Management and Budget, and Shyam Kannan, Managing Director of Metro’s Office of Planning. The November presentations served to ensure a baseline understanding across TPB Board members, highlight our capital and operating challenges, and identify safety, state of good repair, and longer term needs to ensure safe, reliable transit that meets the growing region. Read more…

First Things First

December 14th, 2015 2 comments

Secretary Foxx has issued his direction that Metro cannot consider any new rail expansion right now, and WMATA agrees!  So much so that we wrote it into our strategic plan back in 2013.  Earlier this fall, the Prince William County’s Board of Supervisors heard from WMATA about the importance of fixing Metro’s core before considering any expansion.

The Silver Line’s Phase 2 extension from Wiehle-Reston East to Dulles Airport and Loudoun County could be the last for decades to come. (photo credit: Ryan Stavely, Flickr)

As the region grows, so does the pressure for extensions of Metrorail.  The requests are frequent and common: “Extend Metro to BWI! to Centreville! to Waldorf! to Fort Belvoir!” We’ve heard and even modeled most of these requests. For a system that’s shaped and contributed tremendous economic value to the region, it only makes sense that communities outside of its immediate reach want improved access to it. WMATA Director of Planning Shyam Kannan recently took the opportunity to discuss the potential for the extension of Metrorail into Prince William County. With 80% of today’s Metrorail trips going to or through the system’s core (PDF), he noted that major core capacity improvements must be made prior to considering any additional rail extensions. While addressing core capacity has been a major part of Momentum, including initiatives like the 8-car train program, core stations, and New Blue Line Connections, the plan remains largely unfunded. With safety and state of good repair needs as Metro’s top priorities and core capacity relief put off indefinitely, any potential extensions (if they happen) are likely decades away from being built.

Read more…

Building a Blueprint for a Better Bus Network

November 4th, 2015 2 comments

Metrobus is a critical part of the region’s transit system.  It can be better, stronger, faster, and more efficient than it is today.  Here’s how.

As described in previous posts, Metrobus is due for a regional service update to better reflect its many and sometimes conflicting regional roles.  Certainly, updates to its business model, operational scale and performance standards could go a long way towards helping the region make business- and customer-savvy decisions about the best way to deploy this service.  However, alone these changes would not significantly enhance cost efficiency, nor make the buses run faster, nor get more people to use the service, nor better connect this region which is hungry for more mobility as it prospers and expands.

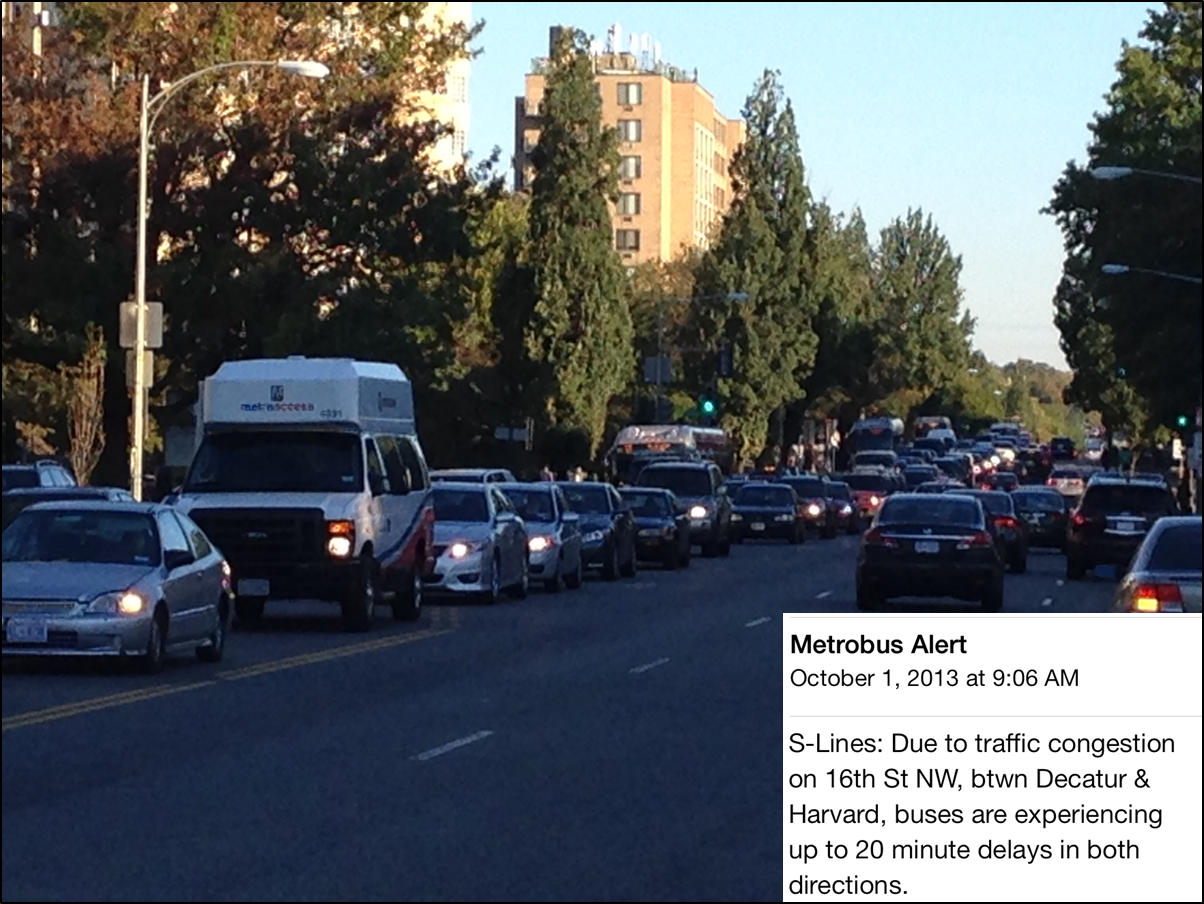
Multiple Metrobus vehicles stuck in traffic on 16th Street in DC, a regular occurance.

Unfortunately, today’s bus operating environment is unsustainable, both operationally and financially. Growing traffic congestion and longer boarding times due to growth in demand have prolonged the scheduled bus travel times, resulting in less reliable service, longer passenger wait times, the use of more fleet just to keep the same headway, and ultimately higher operations costs.  As a region we can choose to just accept the service we have, or we can do the heavy lifting to create the service we need (and deserve).

Here is the beginning of a blueprint of near-term actions that can speed up buses, improve on-time performance, and better serve our customers. Read more…

Categories: Momentum Tags: , , , ,

Metrorail: A Long-Term Solution

April 20th, 2015 12 comments

Metrorail has had a huge impact on the region, but as we’ve seen with the Silver Line, it can take decades to get from concept to execution.

One of the questions I hear most often as a planner for Metro is When will a Metro station open in xyz neighborhood, “in Georgetown”, or “at BWI”? It was the first question at the March Citizens Association of Georgetown meeting. My response — “Decades” — often elicits audible groans.

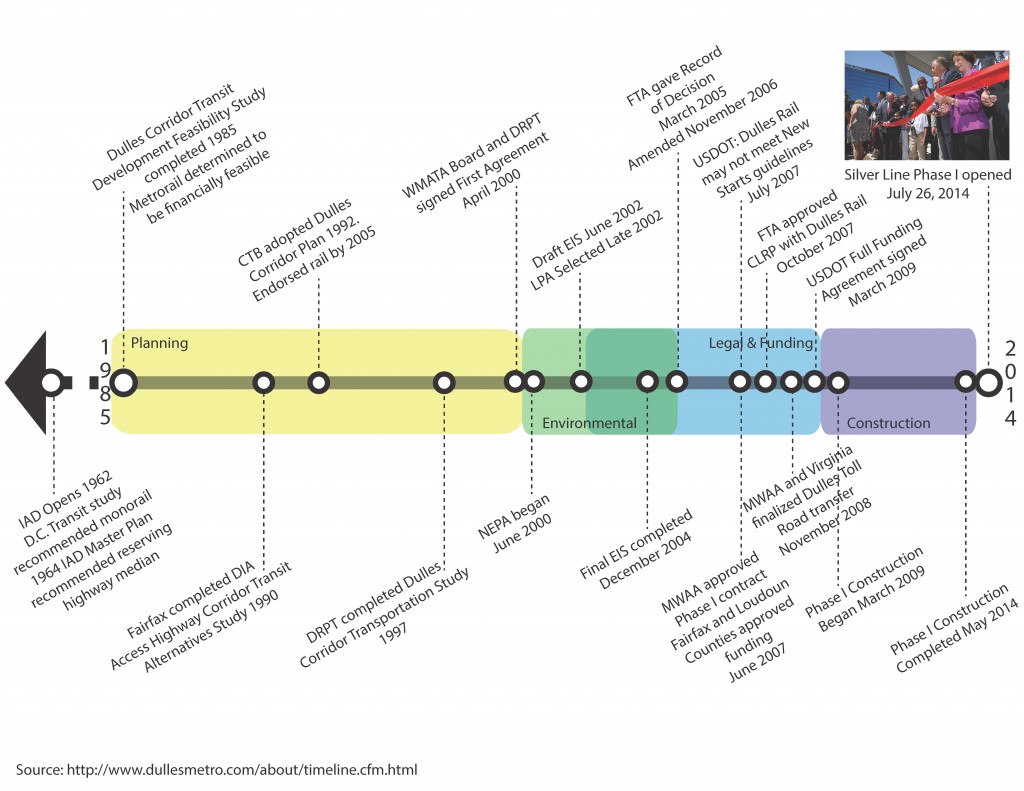
Given last summer’s opening of the Silver Line, we have a case study that can provide insight on how long it takes to plan, fund, and construct large infrastructure projects. The Dulles Corridor Metrorail Project has done a phenomenal job of maintaining a project timeline. Since the region has many recent newcomers, it is helpful to revisit many of the key milestones, as shown below. It is also helpful to remind readers that the Metropolitan Washington Airports Authority (MWAA) was the ultimate developer of the Silver Line (both Phases I and II) and that the project “only” required cooperation among the Commonwealth of Virginia, MWAA, Metro, the federal government, and Fairfax and Loudoun Counties. While just one example, the Silver Line’s long story is not vastly different from other mega-projects happening in the region and across the country.

Timeline for Planning, Environmental Process, Legal and Financing, and Constructing the Silver Line

Read more…

Mass Transit Needs Mass

October 15th, 2014 7 comments

Transit expansion is in demand but Metrorail, light rail, and other high capacity transit projects can be expensive to build, operate and maintain.  With limited resources to invest, our region must ensure that these projects serve the most robust transit markets and are supported by strong transit friendly policies.

Informed by our peers and local performance measures, Metro is developing guidelines that the region can use to inform development of high capacity transit projects. As we’ve explored previously, there’s much more to transit expansion than Metrorail. In fact, due to the cost associated with Metrorail expansion along with existing land uses and built environment in much of the region, most of our future high capacity transit projects will be made up of other transit modes. But what is the best way to decide what mode best fits each corridor? The goal of the expansion guidelines is to inform those decisions.

Development in Arlington’s Rosslyn-Ballston Corridor has validated initial and ongoing investments in Metrorail. (source: Arlington County)

A literature and peer review included policy documents from BART (PDF), the Bay Area Metropolitan Transportation Commission, Florida DOT, Virginia DRPT, Federal Transit Administration (PDF), and research from the University of California Transportation Center (UCTC). The review found that ridership, density, the presence of walkable streets and sidewalks, local plans and policies, and cost effectiveness are the most relevant criteria to evaluate transit projects and that rigorous performance targets are needed to support each transit mode. Read more…

Discovering the Other Silver Line

September 1st, 2014 5 comments

MBTA’s Silver Line Bus Rapid Transit (BRT) is impressive and efficient, but could be easier to use for visitors.

photo 2

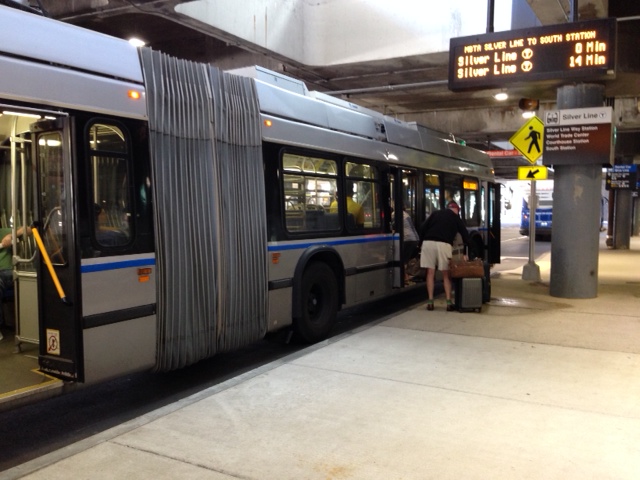
Boston’s Silver Line BRT at one of its Logan Airport stops. Photo by the author.

I recently flew to Boston for the first time in years and had the opportunity to ride their Silver Line BRT  that provides service between Boston Logan Airport and south Boston.  The service features some dedicated right-of-way, real-time arrival signage and a few actual stations.

The Silver Line has real-time arrival screens at Boston Logan, easing the wait time for customers excited to explore a city or return home.  The buses used are dual-power, meaning they run on electricity via overhead wires at some times and on diesel when there are no wires.  The switching between the two takes a few minutes but it really wasn’t very noticeable.

I was very impressed with the stations.  For example, the World Trade Center station is a significant and impressive structure, and felt more like a traditional rail station that a bus stop by far.  It features a multi-story tower topped with the “T” logo.  The station interior features side platforms, escalators and stairs, real-time arrival screens and public art.  A station like this makes a statement that high quality transit service will be operating here for a long time, despite not having rails in the ground. Read more…

Categories: Transit Travelogue Tags: , , ,