Posts Tagged ‘commuter rail’

Transit Supportive Densities – What Do They Look Like?

October 5th, 2016 3 comments

A visual of what transit supportive densities look like for different transit modes

Recently, GreaterGreaterWashington blogged about density, using Google maps 3D images to show what different densities look like in Washington, DC. Visuals like these are so important because most people hear “density”, think “Manhattan” and can’t say “no” quickly enough. Last fall, we completed work as part of ConnectGreaterWashington and the Transit Corridor Expansion Guidelines that illustrated the differences in desired employment and/or residential densities within a transit walkshed by each mode.

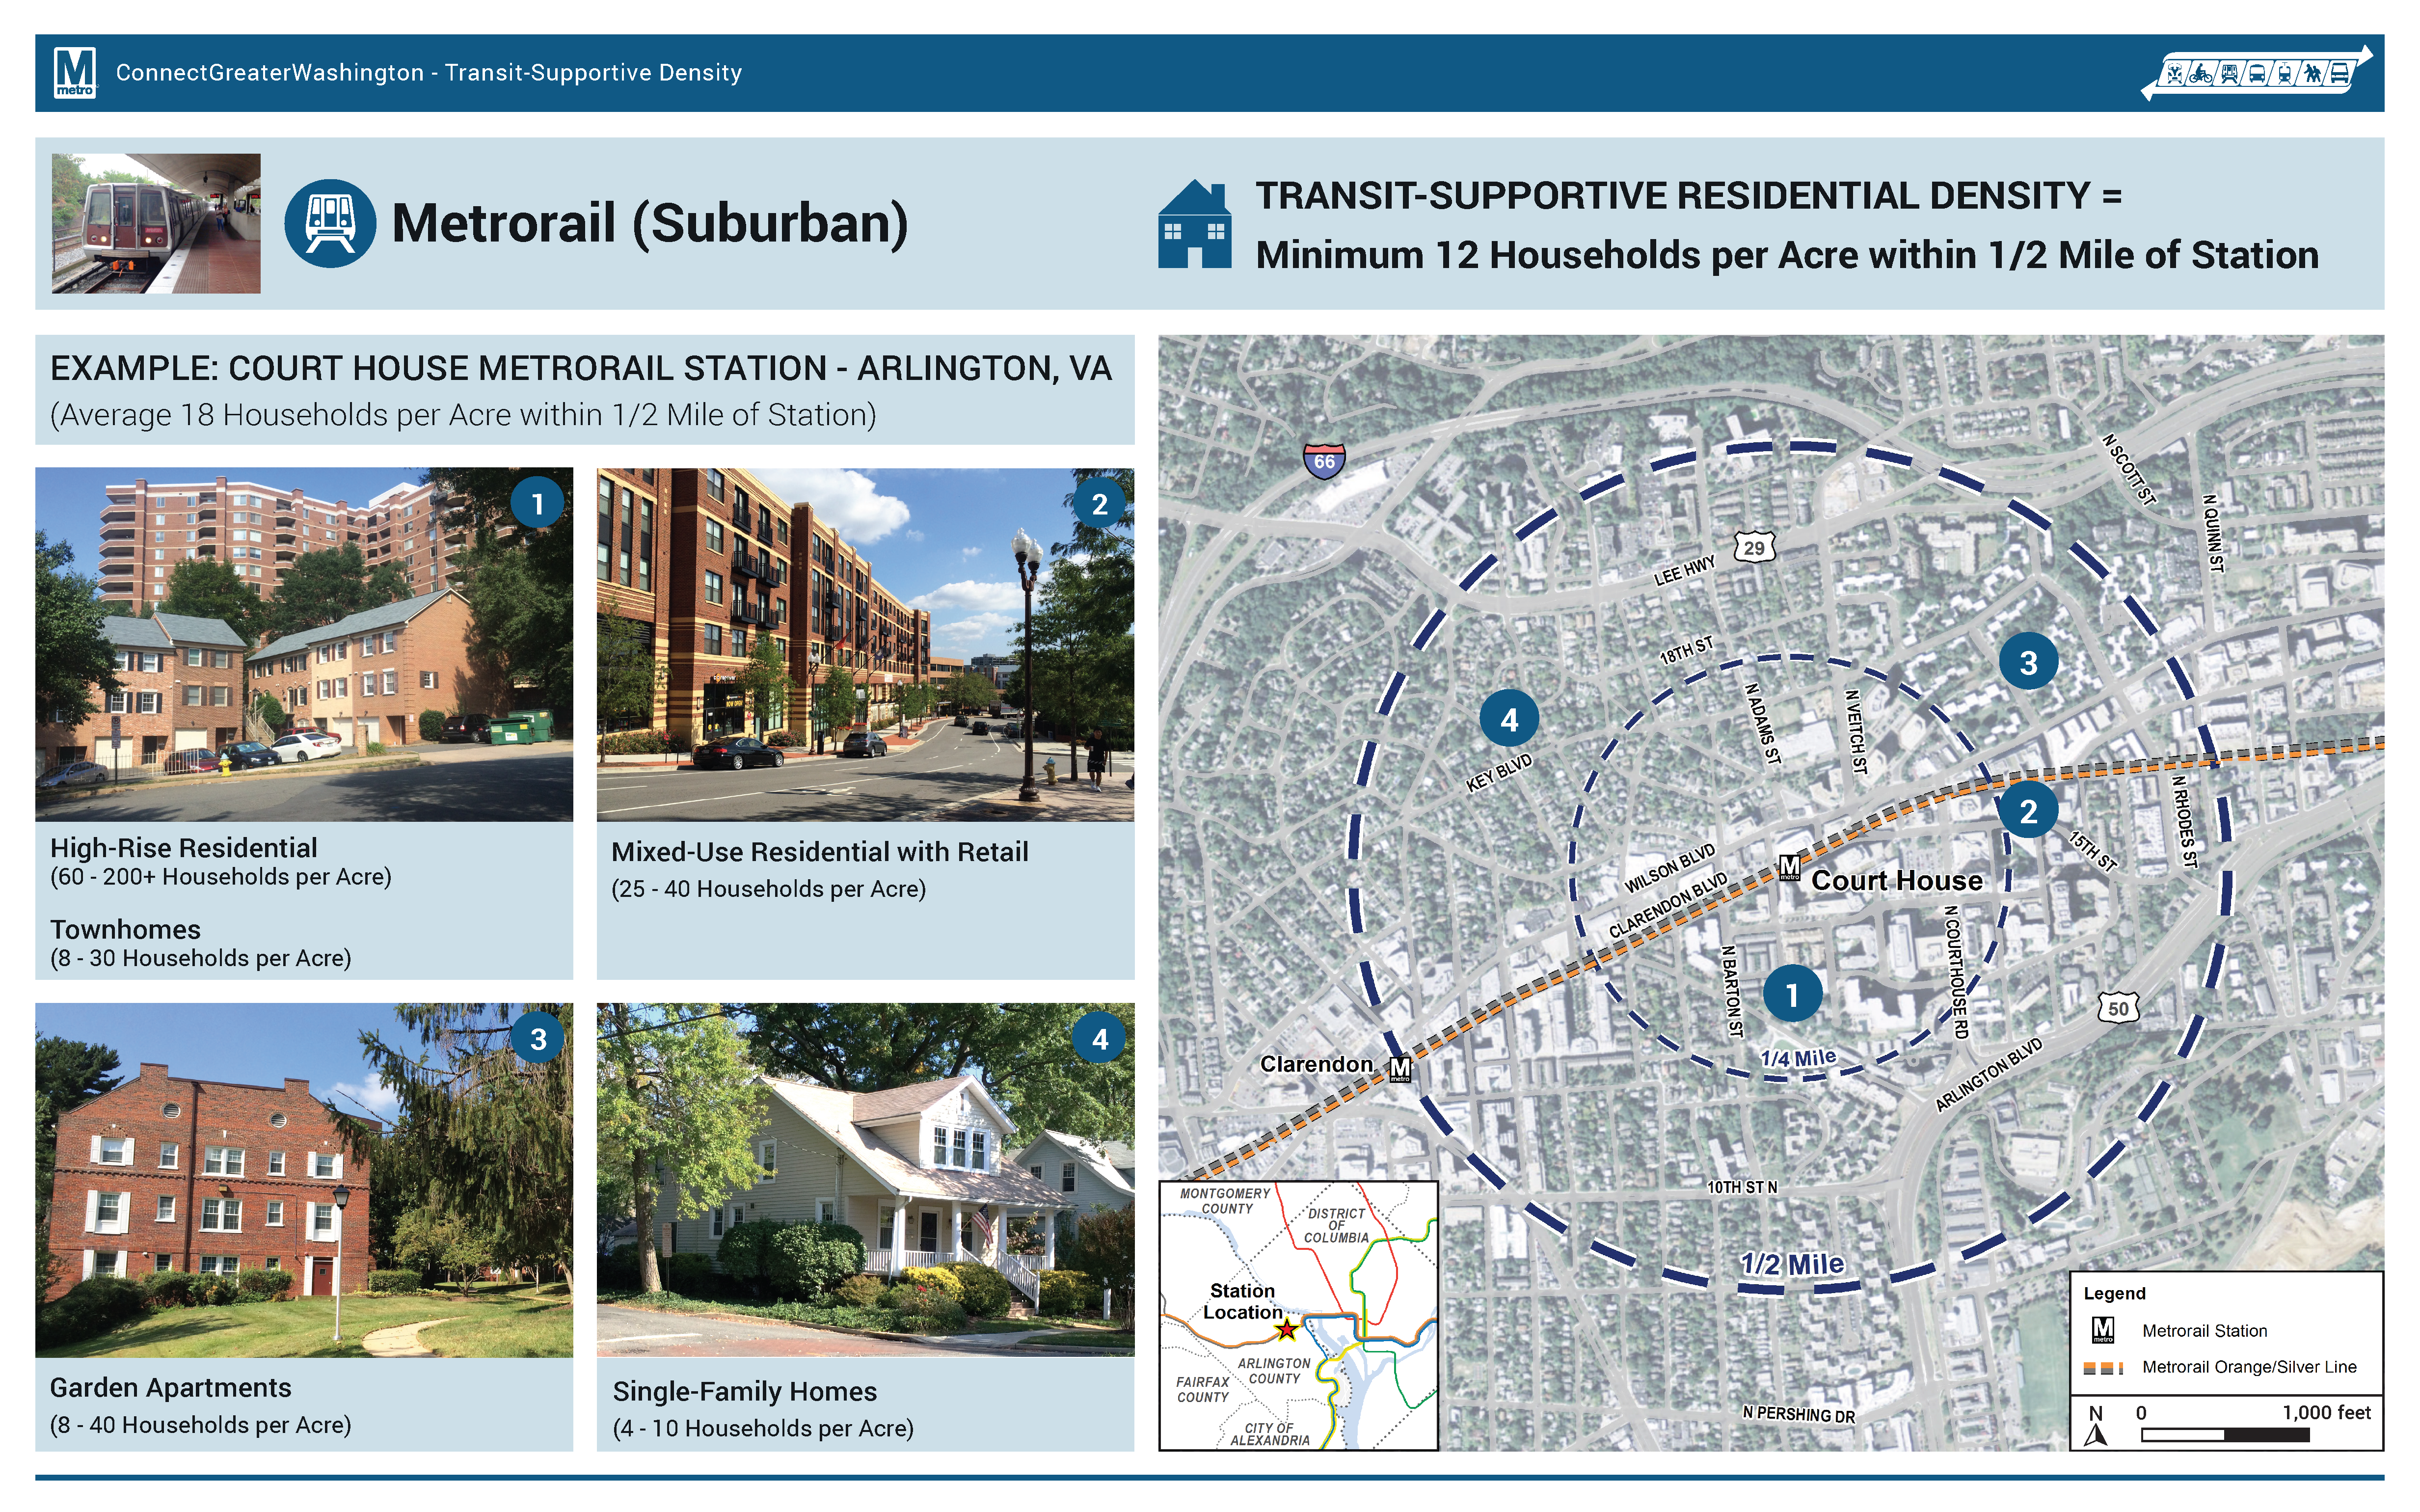
As is typical for planning projects, especially when expanding transit service along new corridors, density is discussed and jobs and/or households per acre targets are tossed around. But most people (full disclosure, that includes me) do not know what 4 households per acre or 150 jobs per acre looks like. It is especially important because a residential target of 12 households per acre within a half-mile of a suburban Metrorail station, for example, does not mean that every residential dwelling needs to meet that target. Instead, within the half-mile radius, the overall density should be 12 or more households per acre. That gives plenty of room to have less dense single family homes (on small lots) and more dense high rise apartments with studios and one-bedrooms.

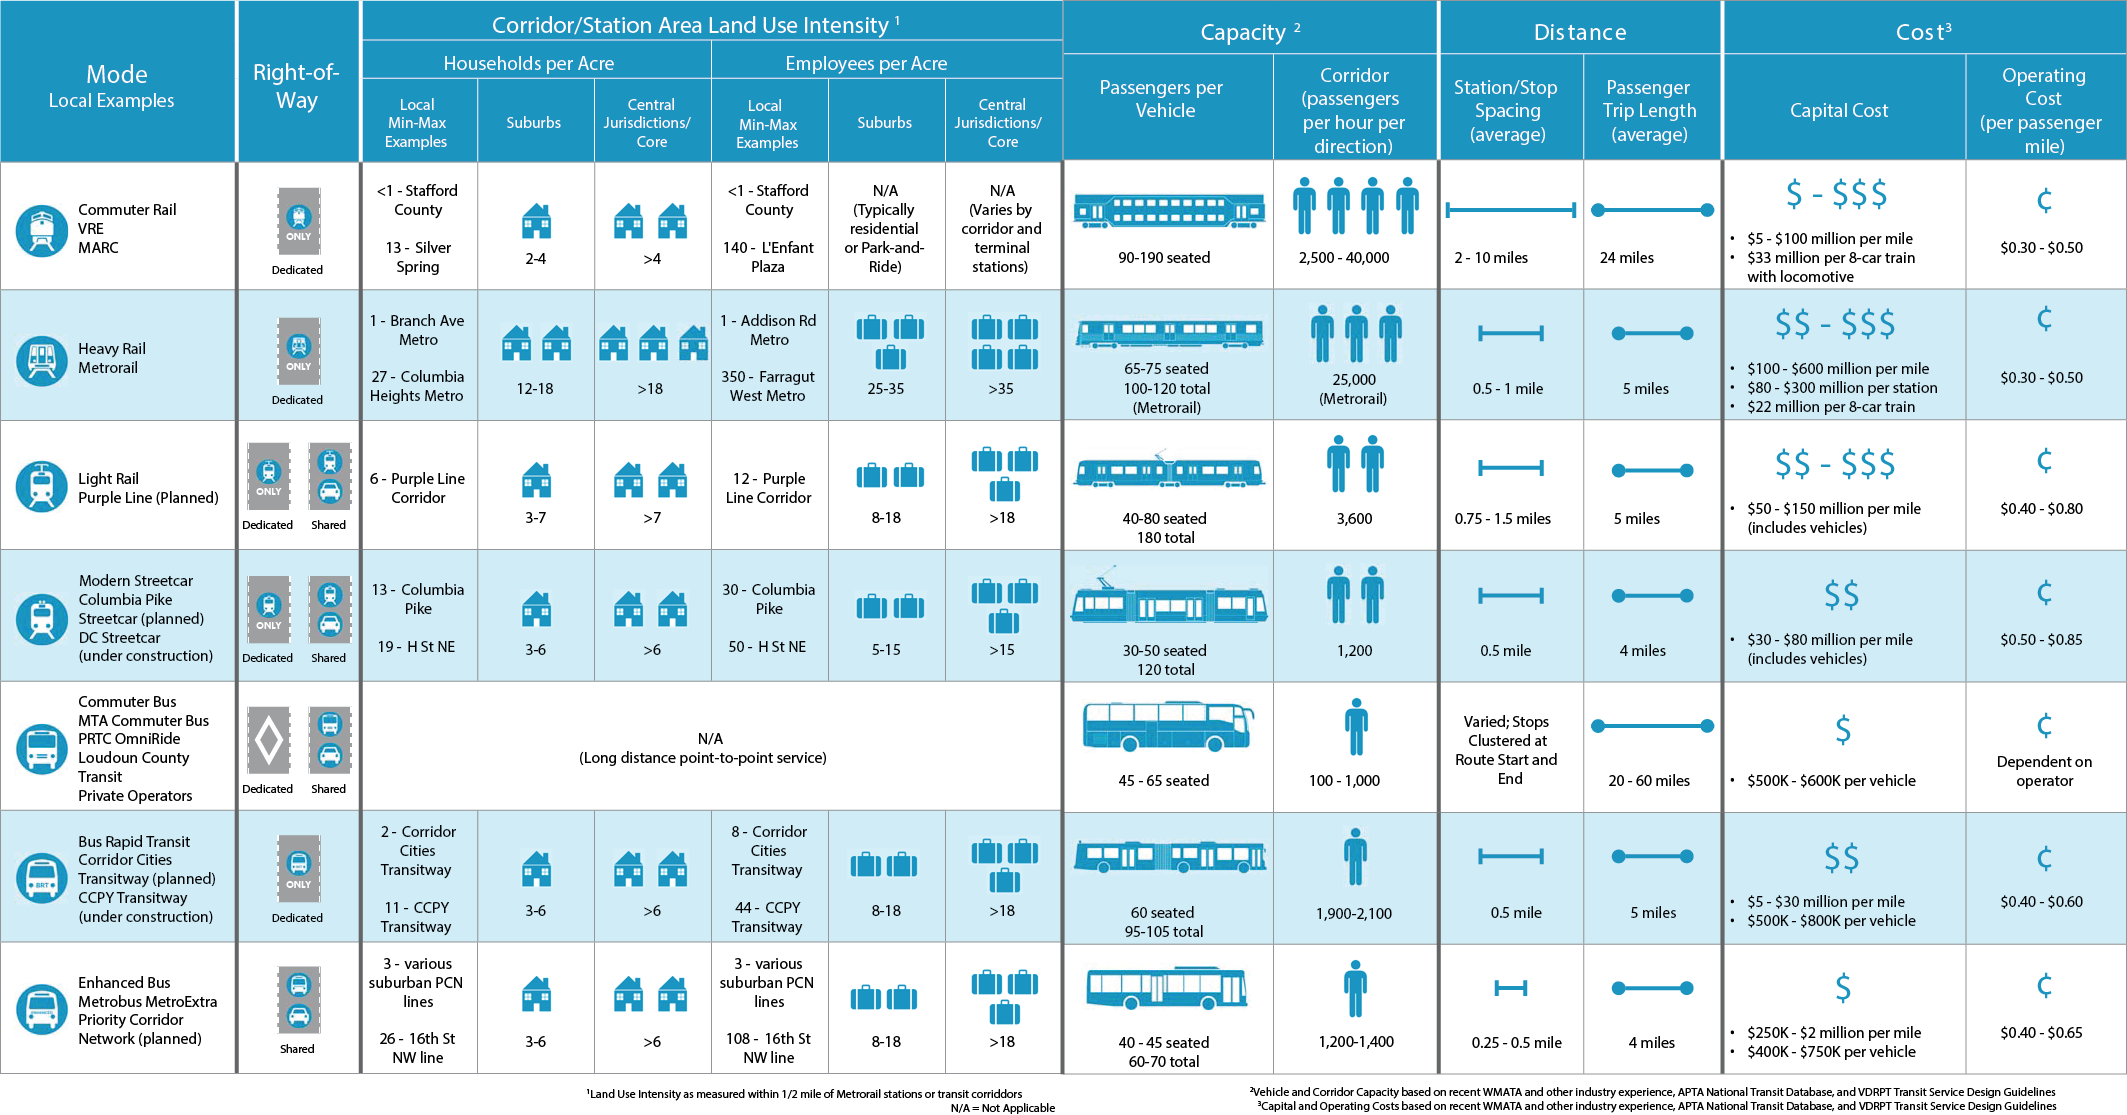
Below are example stations for each mode and the employment and/or residential density targets, along with images of the different building types that combine to meet or exceed the targets. We’d appreciate your feedback on whether they make sense to you and if they would resonate with the general public.

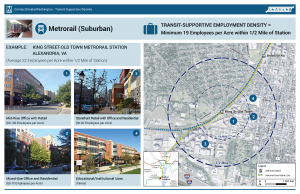
Metrorail (Suburban) Densities
Note, because of the variability in density across the Metrorail system, we created two types of Metrorail stations to estimate densities.

Employment Density - Metrorail Suburban

Read more…

Regional Transit Opportunities Explored

February 11th, 2016 2 comments

You name it, we tested it as possible opportunities to carry future demand and here’s what we found out.

Metro is completely focused on safety, reliability, and financial stability.  It’s also our job to ensure that the regional transit system improves mobility and connects communities.  So we’ve had many posts on ConnectGreaterWashington over the last few years describing the importance of a regional approach to transit planning. Posts include FAQs, how different modes compare, the paramount importance of transit-supportive land use, an approach to assessing Metrorail, BRT, and LRT expansion projects, and the overall proposed plan for Metrorail and surface transit to name a few.

List of Transit Corridors, Projects, and Plans Analyzed as Part of CGW

List of Transit Corridors, Projects, and Plans Analyzed as Part of CGW

Finally, we have completed a set of one- to two-page summaries for all the strategies, plans and projects we tested in our evaluation of future needs and opportunities. Note, these summaries are inclusive of everything that we analyzed over the course of ConnectGreaterWashington, but only some are recommended to advance. Some strategies were recommended (e.g. eight-car trains), others were not recommended (e.g. Kansas Ave. infill station), while many were partially recommended (e.g. the I-66 corridor beyond Vienna shows promise as bus rapid transit, light rail, or enhanced bus, but not Metrorail unless and until additional housing and/or jobs are guided to the station areas and new Metrorail lines are added in the core).

Due to the size of the pdfs, the summaries are divided into three documents. First, are the new Metrorail lines in the core, eight-car trains, and interline connections (pdf updated February 24, 2016). Second, are Metrorail pedestrian tunnels, extensions, and infill stations (pdf updated February 24, 2016). Third, are all of the other modes’ strategies, plans, and projects (pdf updated February 24, 2016). All documents include bookmarks to help you find the various summaries by topic area.

Each strategy, project, or plan includes:

  • A summary of the strategy;
  • The goals that were addressed;
  • The regional activity centers connected;
  • A map that shows the project or plan;
  • Key findings for each such as ridership (including new transit riders vs riders gained from other existing modes), transfers, crowding, connectivity, and surrounding density; and
  • Recommendations for this strategy.

As we and the region continue to grapple with today’s safety, operations and maintenance needs, while also planning for future growth, we will continue to refer to the CGW work undertaken to date. Let us know how you can imagine this body of work being used in the future.

First Things First

December 14th, 2015 2 comments

Secretary Foxx has issued his direction that Metro cannot consider any new rail expansion right now, and WMATA agrees!  So much so that we wrote it into our strategic plan back in 2013.  Earlier this fall, the Prince William County’s Board of Supervisors heard from WMATA about the importance of fixing Metro’s core before considering any expansion.

The Silver Line’s Phase 2 extension from Wiehle-Reston East to Dulles Airport and Loudoun County could be the last for decades to come. (photo credit: Ryan Stavely, Flickr)

As the region grows, so does the pressure for extensions of Metrorail.  The requests are frequent and common: “Extend Metro to BWI! to Centreville! to Waldorf! to Fort Belvoir!” We’ve heard and even modeled most of these requests. For a system that’s shaped and contributed tremendous economic value to the region, it only makes sense that communities outside of its immediate reach want improved access to it. WMATA Director of Planning Shyam Kannan recently took the opportunity to discuss the potential for the extension of Metrorail into Prince William County. With 80% of today’s Metrorail trips going to or through the system’s core (PDF), he noted that major core capacity improvements must be made prior to considering any additional rail extensions. While addressing core capacity has been a major part of Momentum, including initiatives like the 8-car train program, core stations, and New Blue Line Connections, the plan remains largely unfunded. With safety and state of good repair needs as Metro’s top priorities and core capacity relief put off indefinitely, any potential extensions (if they happen) are likely decades away from being built.

Read more…

Study: Just Six Tracks Carry 30% of People Across the Potomac (57 Highway Bridge Lanes Carry the Rest)

July 29th, 2015 2 comments

A new Virginia study (PDF) finds that Metro and other transit operators carry a major portion of all cross-Potomac travel in a just a few crossings, using far less space than the 57 highway bridge lanes that carry the rest. If built, an expanded bridge crossing will need transit to maximize its ability to move people across the river.

PotomacRiverStudy Map

Transit’s Role is Critical

While some media outlets focused on the study’s highway expansion recommendation, the presentation acknowledged that Metro, VRE, and other bus operators plays a major role in the movement of people across the river from Virginia to DC in the core of the region. Seeing that, we thought we we’d drill down further to estimate how many people are actually crossing the river, using which bridge, and by what mode. Supplementing the study with available transit ridership data and vehicle occupancy data (PDF), we arrived at the following estimates: Read more…

How Do Different Modes Compare?

May 14th, 2014 6 comments

The region either already has or is planning for a variety of different modes. How do they compare? The Silver Line will soon open as a Metrorail line. Later this year, a streetcar will be operating on H Street, NE with others planned for Columbia Pike in Arlington and the District. Arlington and Alexandria are jointly building a bus rapid transit (BRT) line between Crystal City and Potomac Yard. Once funding is finalized, Maryland will build the Purple Line and light rail transit (LRT) will connect New Carrollton and Bethesda. This is all in addition to the region’s existing commuter rail, commuter bus, Metrorail, Metrobus, and MetroExtra services. The region is not only expanding transit services, but it also expanding the types of transit modes that will operate. At long last, instead of talking about Portland (streetcar), Jersey City (light rail), or Cleveland (bus rapid transit), we’ll be able to point directly to services and infrastructure in our backyard or take a trip and experience the pros and cons of these modes for ourselves.

So how do the different modes compare? What kind of purposes does each serve? There are many external factors and trade-offs that influence how agencies and jurisdictions select which mode to implement.  As we see from the ongoing debates in jurisdictions across the region between LRT and BRT or streetcar and enhanced bus, there is not always one perfect choice. However, an array of transit and land use measures can provide context to the conversation. As part of ConnectGreaterWashington: The 2040 Regional Transit System Plan, we developed the below table to compare commuter rail, commuter bus, heavy rail, light rail, streetcar, bus rapid transit, and enhanced bus across land use intensity (households and employment), vehicle capacity, stop spacing, trip length, and capital and operating costs.

What do you think? Does this information better inform the rail vs bus debate? What other information would provide more clarity on what modes work where?

Comparison of High-Capacity Transit Modes

Comparison of High-Capacity Transit Modes


LA Metro thinking and investing BIG

January 28th, 2014 Comments off

The Los Angeles area is aggressively leveraging billions in local tax dollars to transform the region into a more vibrant place with a variety of transportation options.

Measure R Spending Breakdown

Measure R Spending Breakdown

The conventional wisdom today is that the days of big expensive transportation investments are over.  Los Angeles apparently didn’t get the memo.  The main transportation planning and development agency in the LA area, the Los Angeles County Metropolitan Transportation Authority (LA Metro), is currently leading the development of the nation’s largest regional transportation expansion program.  The program of projects, Measure R, was overwhelmingly approved by more than two-thirds of LA county voters in 2008, and raised the local sales tax one-half cent.  The half-cent sales tax is expected to raise $40 billion over 30 years (including an estimated $590 million in 2012) to provide the lion’s share of funding for Measure R transportation projects around the region, helping Angelenos avoid some of the area’s legendary traffic congestion.  Not satisfied with the already impressive pace of expansion, LA Metro’s Board of Directors is now exploring a second ballot measure that could come as early as 2016.

Measure R includes an impressive array of transit projects, including the Orange Line Bus Rapid Transit extension, Expo and Regional Connector light rail lines, and the Westside Subway, among others.  Below is a map of the transit projects fully or partially funded by Measure R (click on the map below for the interactive version):

Measure R Transit Map

Measure R Transit Map (source: LA Metro)

Read more…