 Jim Hamre, the Director of Metrobus Planning and Scheduling, explains that although decision-making often gets made at the local level, Metrobus is a collective regional asset that is critical to the region’s success.
Metrobus Has Long Been an Important Part of a Coordinated Regional System
For decades, Metrobus and local bus operators have coordinated to develop and enhance the regional transportation network. Local systems have strategically expanded service in places where Metrobus did not exist, was not well suited to serve, or did not have fleet or facility resources as the rail system expanded and changed travel patterns. Considerable time and effort went into the restructuring of bus services to coincide with the expansion of Metrorail to form a balanced network that generally made policy, practice and economic sense. The 1997 Regional Mobility Panel (PDF) reestablished the importance of a regional bus network, and delineated the general service responsibility among local providers and Metrobus, although the local/regional balance has changed in the intervening years.
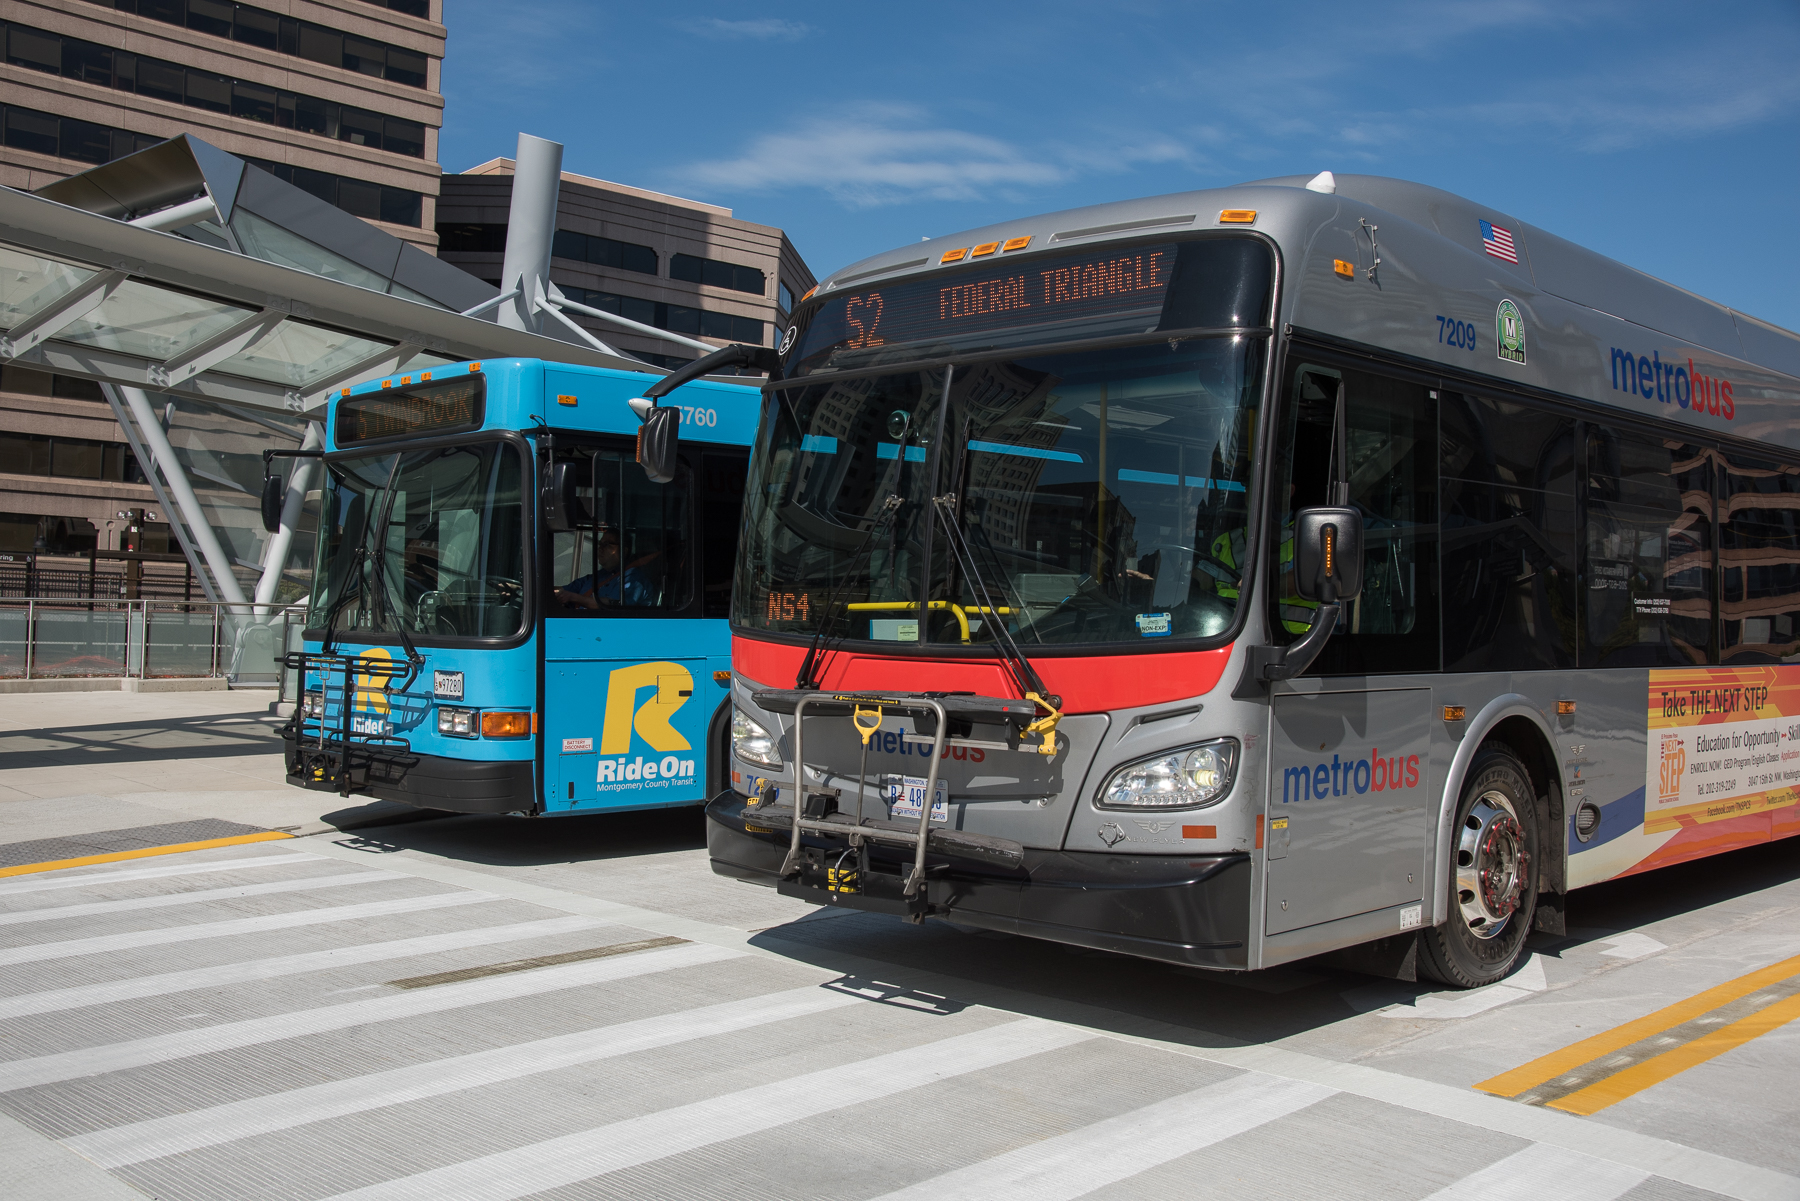
Metrobus and RideOn sharing access to the newly opened Silver Spring Transit Center. Source, WMATA.
Among other factors, Metrobus is important to the region because it: Read more…
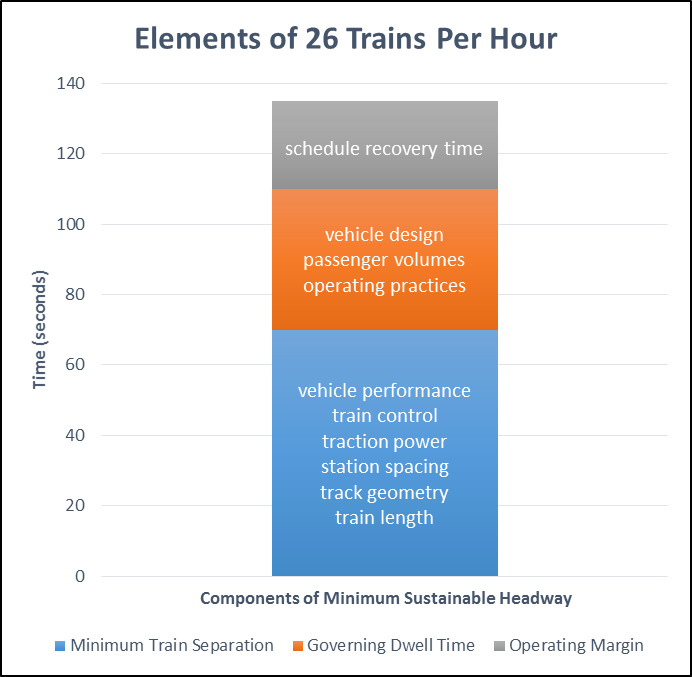
Why can’t Metrorail reliably operate more than 26 trains per hour per direction? A 2001 study defined the basis for determining this constraint.
Although it has been known for years, the July 2014 opening of the Silver Line and corresponding reduction of rush hour Blue Line service highlighted that Metro cannot schedule more than 26 trains per hour (or a train every 2-2.5 minutes) across any point in its rail network. Though it’s been discussed many times through the years, let’s explain this limit in detail now.
Read more…
We explore questions about WMATA’s creation and how decisions are made in our “Metro 101” series.
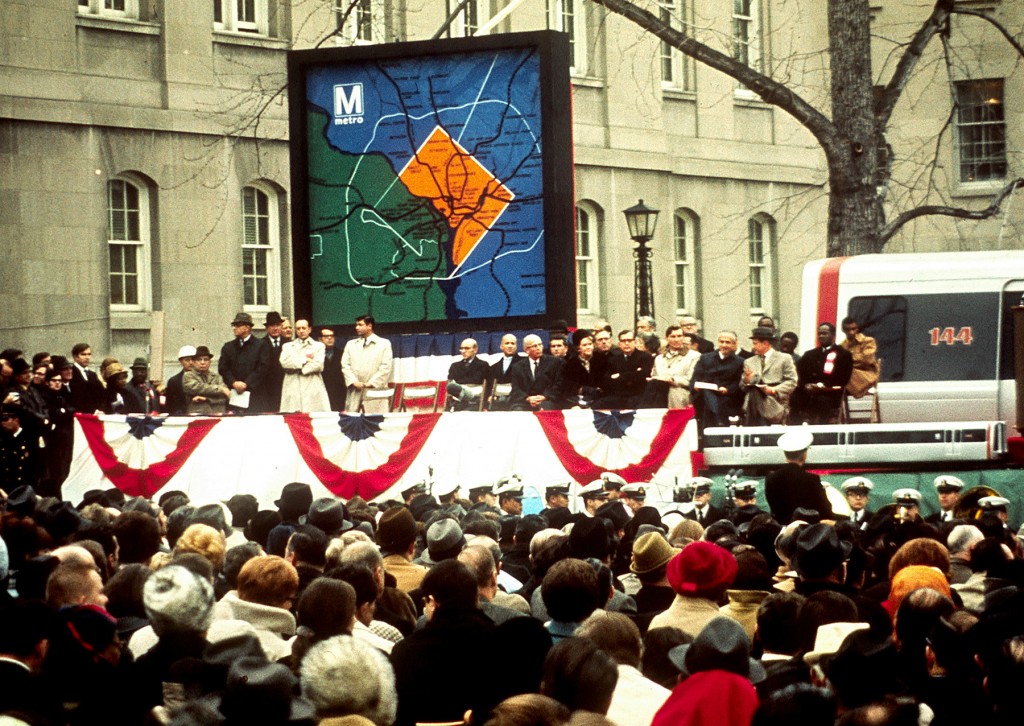
Metrorail groundbreaking at Judiciary Square (December 9, 1969)
Why was WMATA created?
WMATA was founded in 1967 to serve 3 primary functions:
- To plan, develop, finance and “cause to be operated” improved transit facilities as part of a balanced regional transportation system;
- To coordinate the operation of the public and privately owned or controlled transit facilities into a unified regional transit system;
- To serve “other regional purposes” as needed.
Read more…
Since the signing of the WMATA compact more than 40 years ago, there has been an ongoing debate about the role of Metrobus as the Washington region’s primary bus service provider.
Prior to the formation of Metrobus in 1973, bus services in the Washington region were operated by numerous private providers across the region operating on dedicated lanes, many of which were operating at a loss. In the 1970s, Metro consolidated bus service under the Metrobus brand and increased service and headways throughout the WMATA compact area. While Metro’s role as the regional rail provider has always been clear, its role as a bus provider has been more nuanced.
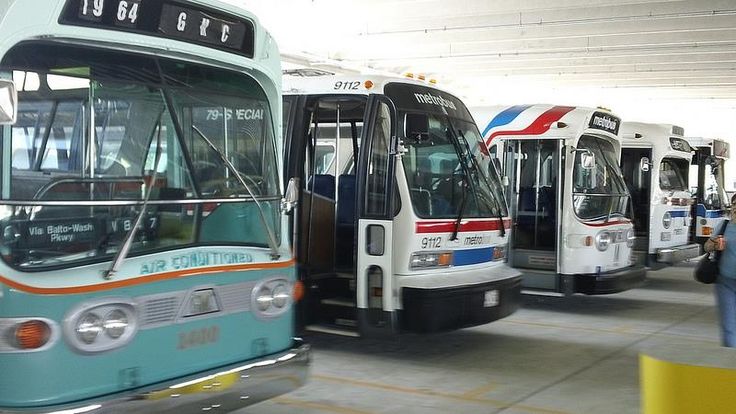
Old DC Transit and Metrobuses from the 1960s and 70s
This is the first in a series of posts which aim to provide a brief overview of the efforts undertaken over the past 20 years by Metro, and its regional partners, to balance the responsibilities and funding of Metrobus with the wants and needs of our jurisdictional partners all while maintaining our regionally focused mission.
Read more…
When it comes to impacting weekday Metro ridership, meteorologists are three times more powerful than the federal government.
Many factors influence Metrorail ridership, including the weather and the status of the federal government. As this assessment shows, extreme weather has a much bigger impact on Metrorail usage than the federal government closure for budget reasons.
In the past few months, the federal workforce was instructed to stay home for two different reasons. The first was the failed budget negotiation that resulted in the federal government shutdown in October of 2013. (We’ll call this “shutdown closure.”) The second was the winter weather forecast that closed federal offices in the Washington region. (Let’s call this “snow closure.”) These two separate government closures have had different impacts on Metrorail ridership.
First, take ridership by time of day. The graph below shows ridership by fifteen-minute interval for three days. The tallest, green line is the average of weekday entries. The other two are days that the federal government was closed due to the shutdown (Oct 8, 2013) and snow (Dec 10, 2013). Now, the purple line illustrates the ridership due to the budgetary shutdown in October 2013 and the blue line shows ridership on a federal snow day in December 2013. The purple line (budget shutdown) is not dissimilar to the green (average), but the purple line (snow shutdown) illustrates a huge ridership drop. Why would this be?
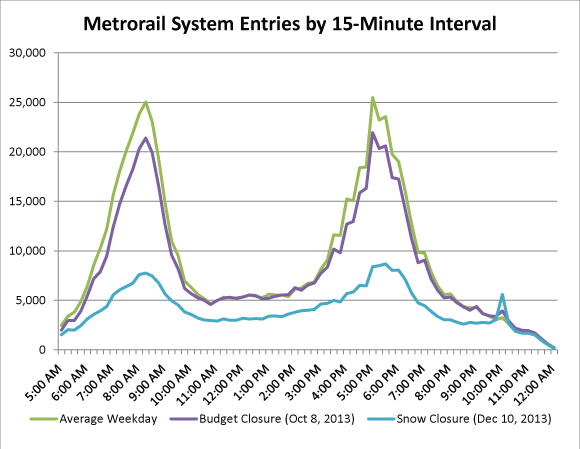
Metrorail ridership on an average day and two days the federal government was shut down. October 8, 2013 was part of the budget shutdown. December 10 2013 the fed was closed due to snow.
We can think of a few reasons for this difference.
- The budget shutdown only impacted SOME federal workers, i.e. those not deemed essential. Snow, however, impacts just about everyone.
- On snow days, area schools are often closed. Parents who have the luxury to do so sometimes stay home to look after their children who would otherwise be in school. Critically, parents who may be limited in child care options – many of whom are our customers – are especially vulnerable and often are forced to stay home because of the school closures.
- Washington is gradually evolving from a federal “company town” into a “boom town of the new economy,” a new economy less reliant on the federal government. Many of the businesses of the “new economy” were unaffected by the budget shutdown, but during extreme weather events take their cue from the federal government and give their employees the day off. According to Dr. Stephen Fuller of GMU’s Center for Regional Analysis, the Washington region is and will be “increasingly less dependent on federal spending as the driver of job growth and income generation in the local economy.”
Next, let’s look at change in ridership by station. Below are maps showing the change in ridership between a regular day and one of the government shutdown days: first budget shutdown and then snow shutdown. Read more…
About a third of Metrorail customers transfer between lines to complete their trip, and this is not too far off many of our peer transit agencies.
Everyone would prefer a “one-seat ride” (aka “transfer-free ride”) from origin to destination, but for many, transfers are a necessary part of commuting life. In fact, transfers may be even beneficial. Transfers are a part of nearly every large rail transit system with multiple lines, including Metro. As the chart below shows, 35% of Metrorail passengers change trains at some point during their journey, and that’s slightly higher – but not wildly different from – many of our peer transit systems in the U.S.
Read more…
 Two-thirds of Metrorail riders take transit, walk, or bike to Metrorail for their morning commute.
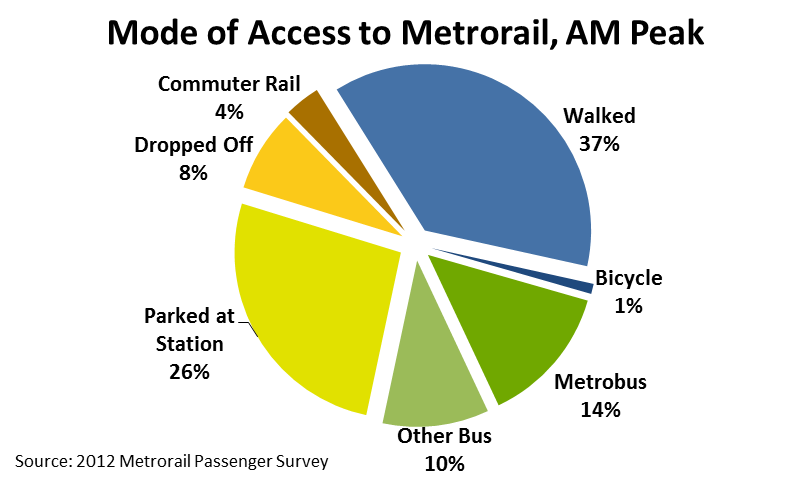
Every morning, thousands of people walk through the faregates and into Metrorail. Did you ever wonder how they get to their station? Our 2012 Metrorail Passenger Survey tells us the answer to this question, for the morning rush:
- More than a third (38%) of Metrorail riders get to the station in the morning by walking or biking.
- Another quarter arrive by bus – Metrobus, as well as other bus operators in the region.
- Another third arrive by car – most by parking at or near the station, but some by getting dropped off.
- Finally, about 4% of riders arrive via commuter rail – mostly at Union Station.
Of the 25,000 or so daily riders who access rail by “Other Bus,” the top three contributors are Fairfax Connector (6,700), Montgomery County’s RideOn (5,700), and private shuttles (4,900). Of those who parked at their station, one-third were driving from less three miles away. Carpooling to Metrorail is very low – we estimate average vehicle occupancy at 1.03 passengers per parked car.
The map below shows how the answer to “How Did They Get to the Station?” varies dramatically station to station. (For the sake of legibility on this map, I’ve simplified the access modes into 4 groups). Read more…
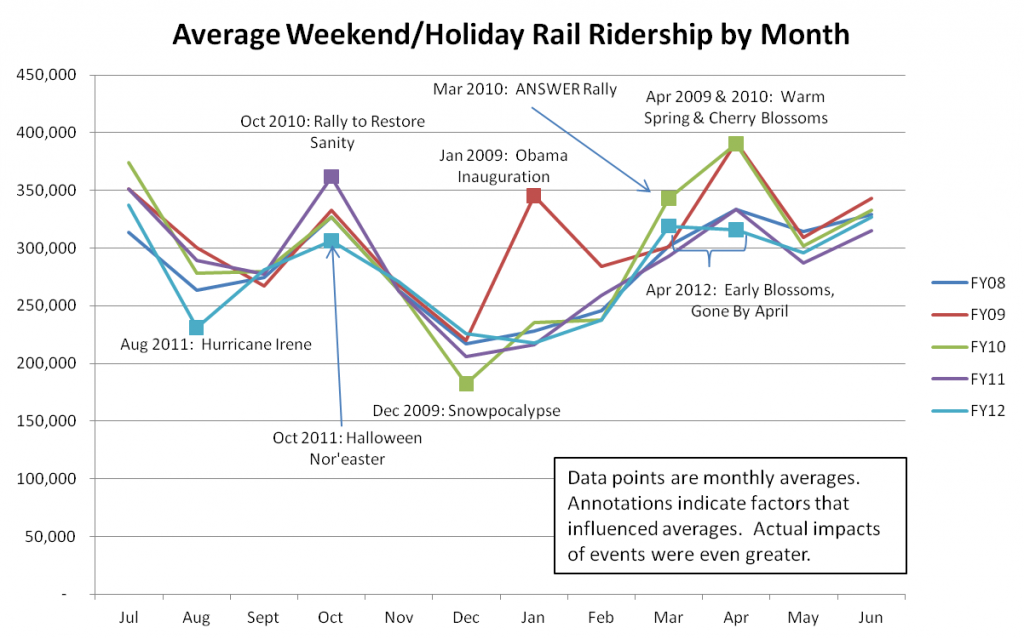
Average weekend ridership by month, FY08 to FY12.Events that impacted the average ridership during a given month are indicated with annotations.(Click for a larger version.)
A recent assessment of rail ridership over the past five years has concluded that in addition to moving people to and from work during the week, Metro also has a critical role to play in moving people to and from weekend activities and special/holiday events.
From the chart above, it is clear that Metrorail supports a large volume of travel to a wide variety of special events that are unique to the area:presidential inaugurations, issues rallies, and cultural events such as the annual Cherry Blossom Festival. Metro is more than just a commuting tool: the hundreds of thousands of trips on weekends and holidays show that the rail system is busy on weekends, too.
It is also important to note that Metrorail is not immune from the impacts of severe weather, such as the massive weekend snowstorm in December of 2009 and Hurricane Irene in August of 2011, both of which cut into ridership and reduced revenues. And because weekend trips are more often discretionary than weekday work trips, the impact of weather on weekend ridership can be much greater (in percentage terms) than on weekdays.
 Jim Hamre, the Director of Metrobus Planning and Scheduling, explains that although decision-making often gets made at the local level, Metrobus is a collective regional asset that is critical to the region’s success.


Recent Comments