Here’s your chance to analyze and visualize the movements of the Metrobus fleet.
In anticipation of the upcoming Metro Hack Night, Metrobus planning staff has generated an automated vehicle location (AVL) systems data set. The data set, for five days in October, shows the time that each Metrobus was at each stop over the course of the day, the buses’ dwell time, and a comparison of actual stop time to scheduled stop time.

Real-time arrival sings at Metrobus stops around the region are powered by automatic vehicle location (AVL) systems on-board buses.
What can be done with this kind of data? Here are a few ideas:
- Look at how the running times for routes varies across the day
- Calculate vehicle speeds across the region
- Dive deep into on-time performance
- See how dwell times affect running times, speeds, and on-time performance
- Map the movements of Metrobus vehicles over time
- Get a better understanding of Metrobus operations, including how vehicles are interlined among routes and the number of different variations of some routes
Come on techies! Dive in and find new and inspirational ways to look at this data.
Please post links to your work in the comments!
Metrobus_AVL_Oct_2016.zip (319 MB zip file)
And some brief documentation:
Metrobus AVL Data Dictionary(.docx, 13 KB)
In this guest post, Mr. Christiaan Blake, Director, WMATA Office of ADA Policy and Planning describes a new cost-cutting partnership called Abilities-Ride.

Mr. Christiaan Blake, Director, WMATA Office of ADA Policy and Planning
On September 30, the Washington Metropolitan Area Transit Authority (WMATA) issued a request for proposals (RFP) for its new Abilities-Ride program. Abilities-Ride is designed to provide MetroAccess–eligible customers with access to a general trip purpose alternative in the Prince George’s and Montgomery County sections of the MetroAccess service area. Depending on the results of the program, Abilities-Ride could be expanded to cover the entirety of the MetroAccess service area. Abilities-Ride will not be a Metro service, but instead a public-private partnership between Metro and one or more vendors that provide existing or soon-to-be established generally available on-demand service. Metro will subsidize up to $15 per eligible customer trip.
MetroAccess Sustainability
MetroAccess is the region’s designated paratransit service for people whose disabilities prevent them from using bus and/or rail services for at least some of their trips. As outlined in the Americans with Disabilities Act (ADA), paratransit services like MetroAccess were designed to be a safety net. However, in many places, including the Metro service region, demand for paratransit has grown at unsustainable rates. To address the growth in demand for MetroAccess, WMATA has been facilitating the availability of new alternative services among which MetroAccess customers could choose. The new alternatives include the Coordinated Alternatives to Paratransit Service (CAPS) pilot program for trips to/from human services agencies, and the highly successful TransportDC service that allows Washington, DC residents eligible for MetroAccess to call a cab for medical and work-related trips anywhere in DC for a flat, $5 fare. Read more…
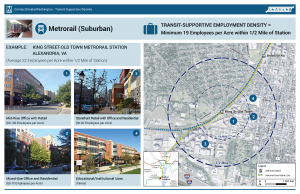
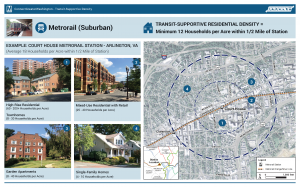
A visual of what transit supportive densities look like for different transit modes
Recently, GreaterGreaterWashington blogged about density, using Google maps 3D images to show what different densities look like in Washington, DC. Visuals like these are so important because most people hear “density”, think “Manhattan” and can’t say “no” quickly enough. Last fall, we completed work as part of ConnectGreaterWashington and the Transit Corridor Expansion Guidelines that illustrated the differences in desired employment and/or residential densities within a transit walkshed by each mode.
As is typical for planning projects, especially when expanding transit service along new corridors, density is discussed and jobs and/or households per acre targets are tossed around. But most people (full disclosure, that includes me) do not know what 4 households per acre or 150 jobs per acre looks like. It is especially important because a residential target of 12 households per acre within a half-mile of a suburban Metrorail station, for example, does not mean that every residential dwelling needs to meet that target. Instead, within the half-mile radius, the overall density should be 12 or more households per acre. That gives plenty of room to have less dense single family homes (on small lots) and more dense high rise apartments with studios and one-bedrooms.
Below are example stations for each mode and the employment and/or residential density targets, along with images of the different building types that combine to meet or exceed the targets. We’d appreciate your feedback on whether they make sense to you and if they would resonate with the general public.
Metrorail (Suburban) Densities
Note, because of the variability in density across the Metrorail system, we created two types of Metrorail stations to estimate densities.
Read more…
Agenda released for upcoming event focused on identifying rider needs in the apps & maps space.
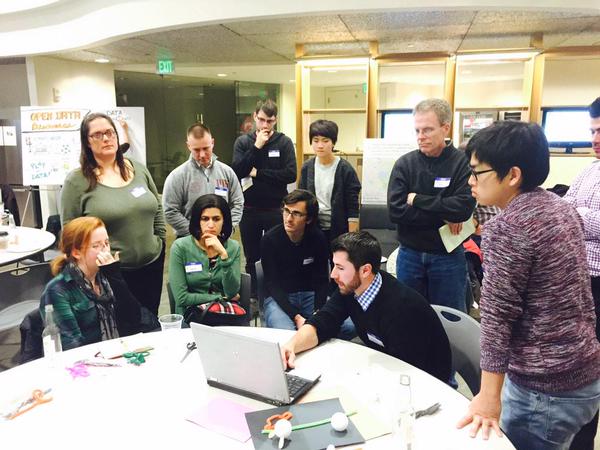
Expect name tags and group activities at our upcoming event. Photo credit Open Data Nation.
Two weeks ago we announced we were hosting an event here at Metro on October 15th to engage the developer, rider and advocate communities to uncover unmet needs and potential solutions to them. We plan to have some fun and meet new people, and we are calling it Destination Ideation.
While we are busily preparing for the event, we invite you to go ahead and check out the event agenda. (PDF)
For those who are interested but haven’t signed up yet, please go to the event page to claim your free ticket. We need a good estimate of the head-count to manage the event.
Download: agenda-destination-ideation-v2
RSVP: http://tinyurl.com/destinationideation
We are looking forward to seeing you on October 15!
Metro added an additional seven price points to SelectPass starting in August, and customers have started to take notice!
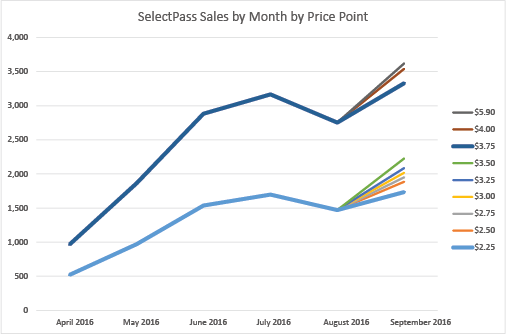
SelectPass sales by month in a stacked line graph, meaning total sales is the value of the upper-most line.
Perhaps you recall Metro is testing a new, custom-value pass. Customers “select” their usual commute trip and then can purchase a monthly pass priced at 18 days of commute travel. Since all months have more than 18 work days, this new pass offers regular customers a great deal. The pass began with two price points ($2.25 and $3.75) and included rail-only and rail-bus options.
As you may have heard, Metro expanded the SelectPass pilot to 7 new price points on August 22, for September passes. And customers have responded. As you can see in the graphic above, the base-fare pass sales for September exceeded their sales levels for July. And instead of eating into sales of the base-fare pass, the new price points are adding additional pass sales.
A recent customer experience survey polled over four thousand current or former SelectPass customers, where we learned the following: Read more…
Transit and bikes go hand in hand. Not only can riders bike to and from stations for that first and last mile, but biking is a great way to get around when Metrorail is under maintenance. It’s important that our policy makers understand the importance of having good bike infrastructure.
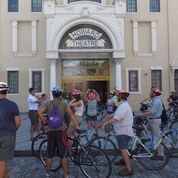
Biking to historic Howard Theater (photo courtesy of APA’s Sam Schipani)
On Sunday, September 18th, I rode around DC with a bunch of planners from across the country in town for the American Planning Association’s (APA) annual Policy and Advocacy Conference. This annual conference gears planners up to advocate for federal, state and local policies that advance good planning principles through the legislative process. There are two days of training workshops and speaker sessions and an entire day of meetings on Capitol Hill, where planners meet with their representatives to discuss planning issues and their importance to creating strong communities.
One of the training sessions sponsored by the APA Virginia Young Planners Group (YPG) was a mobile workshop on bicycle infrastructure planning and the role of the bicycle as a viable transportation option. I was there as a speaker to provide some background about bicycling as an alternative for riders trying to get around during our SafeTrack rebuilding program. Two other speakers very familiar with the biking world here in DC were on the tour as well – Jim Sebastian, who manages DDOT’s Active Transportation Branch and is their chief bike planner responsible for most of the DC bicycling infrastructure that has come on-line in the last decade and helped make DC #4 in the country for bike commuting, and Doug Smith, WABA’s Everyday Bicycling Coordinator. Read more…
Data can help inform understanding of the potential impacts and mitigating strategies for potential changes to Metrorail’s span of service.
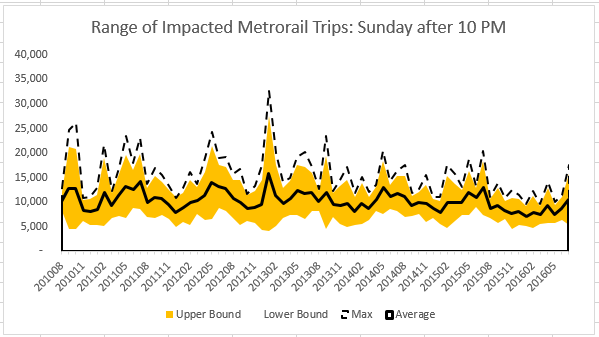
Metrorail ridership after 10 PM on Sundays, by month, since August 2010. The black line is the average, the yellow band is one standard deviation +/- average. The dashed line is the maximum.
In June of 2016, Metro began closing at midnight on weekend nights to allow more time for track work over the weekends, in support of the SafeTrack program. The Metro GM/CEO has recently announced he will pursue making this service change permanent. To meet the necessary track work requirements to get the system in a state of good repair – recommendations which the FTA and others have also made – the current budget proposal for FY 18 includes various additional early closure options, including ending Metrorail service at 10 PM on Sundays.
Staff from across the agency are currently working to assess the impact of such closures on customers and determine what strategies we might employ to replace some or all of that rail service with alternatives.
Similar to our data release related to SafeTrack, we are glad to provide ridership data to assist with analyses by our local partners and members of the transit advocacy community.
First, average, standard deviation and maximum ridership after midnight on Friday and Saturday, and after 10 PM on Sunday by month, station, and hour, from 2010 to 2016. (Excel, 13 MB) The graph above illustrates one dimension of this data: the average, usual range and maximum system ridership on Sundays by month since August 2010. The biggest spike there is during Obama’s second inauguration weekend. There is a lot to learn from this data set.
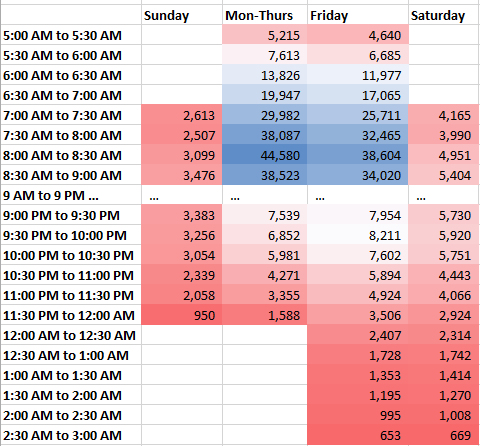
Secondly, we’ve put together Metrorail entries by half hour by day type. The full dataset is available for download, but the relevant data is presented in the image below, showing the half-hour segments that have the lowest ridership.
We have also assembled additional visualizations of ridership during the potentially impacted periods: Read more…
We want your feedback on a new online tool, Metrobus Explorer, which allows visualization of Metrobus service frequency and geography.
One of the biggest challenges facing bus transit is making the service extremely easy to understand. Metrorail stations are filled with customer information, including system maps, fare and travel time tables, station-ahead lists, and passenger information display systems (PIDS) screens, leaving little guesswork for the savvy traveler. Moreover, with limited real estate available for customer information, Metrobus stops are often at a disadvantage. While Metro continues to improve bus stops around the region — including the design and installation of new diagrammatic bus system maps — information technology is also playing an important role in filling the bus customer information gap, including BusETA, information displays, and trip planning sites and apps.
Metro’s Office of Planning is developing a new online tool called Metrobus Explorer that is geared to answer two questions about the Metrobus network: “How often do buses arrive at a given stop (or set of stops), and where do they go from there?”
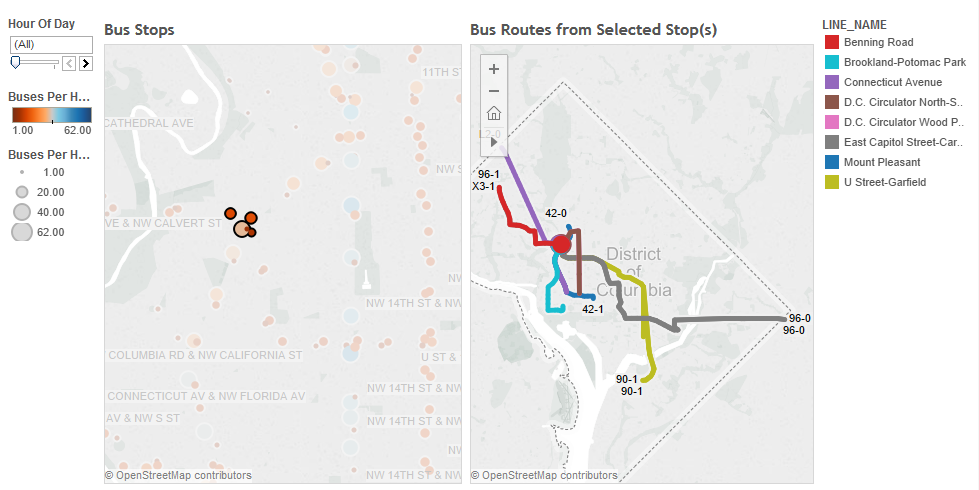
Screen shot of the bus frequency and spider map tool. Click the image to access the live tool online.
Read more…
Planning to Walk, Bike, Telework or Take Metro on September 22? Then take the pledge to go Car Free.
Car Free Day is this Thursday, September 22. Any of us who live or work in the Washington region can pledge to go Car Free or “Car Lite” (meaning some access to a car or van pool) to help raise awareness about alternative modes of travel relative to driving alone. In addition to showing your support for a good cause, you might even win a prize.

Interest in Car Free Day is widespread, from folks who don’t even own cars (see our post from a few years ago) to folks who typically drive alone to work and may need a little encouragement to try something else. Last year, more than 3,500 people pledged to go car free in the region. About 38% said they would bike, 22% would take rail, and 17% said they would use a bus as their primary mode of transportation. As with Bike to Work Day, events like Car Free Day can have a lasting impact beyond the one-day event by leading people to make changes in the ways they choose to get around. So help bring up this year’s number of pledges by signing up today.
Metro Data Day 1 will bring together Metro staff, the app developer community, riders and advocates.

Metro has some great data feeds, and app developers — from Google and Apple to Metro Hero — are consuming them to provide great tools for transit riders in the Washington DC region.
That’s great news, and yet there are opportunities to do even more! For example, we’d love to see app developers help customers plan an accessible trip – one that routes a user to station entrances where elevators are present. And this isn’t likely the only unmet need from the Metro transit rider community. There are loads of great ways to make this data more useful to you. That’s where you come in. Read more…


Recent Comments