Posts Tagged ‘walkability’

Bike and Pedestrian Infrastructure – Quantifying the Return on Investment

September 26th, 2016 Comments off

Sometimes small investments yield large returns. Building sidewalks and bike lanes to Metrorail stations increases safety and pays off two to one.

To close the loop on the last post that described our station area bike/ped project selection and evaluation process, we’ve posted the summary report online for your reading pleasure.   To skip right to the bottom line, though, we’ve been able to tie dollar amounts to certain project benefits and have calculated a total return on investment that’s nothing to sneeze at.   In short, we’ve estimated that a $13 M investment in some of the 394 top pedestrian projects leads to a $24M discounted revenue impact for Metro and its funders of the course of these projects’ useful life, a net positive benefit of $11M.  BAM!

MSIS Report Cover

In addition to the monetary returns, there are a number of other benefits that tend are challenging to quantify financially but have great value to customers and society at large.   For example:

  • New pathways shortens someone’s travel time, making Metro a more attractive option for the trip they are making;
  • New sidewalks may open up the station to an ADA customer who had to rely paratransit before to get to where s/he was going; and
  • New bike lanes provides a separation between both moving and parked cars, and the bicyclist, making her safer.

These projects are valuable indeed and the task before us (the royal ‘us’) is to ensure that they are built, thereby contributing to a more efficient use of the Metro system by maximizing the accessibility of stations.  So, let’s get cracking!

Since we collected projects from planning documents going back a few years, we anticipated that some of them might already have been built or might no longer work in the current context.  Therefore, we asked staff from our local transportation departments and planning agencies to help us “ground-truth” or update project status.  Out of the 394 top projects, we removed 194 that were already completed, no longer under consideration or that have already been funded, leaving 200 to focus on.

Not bad for a day’s work!

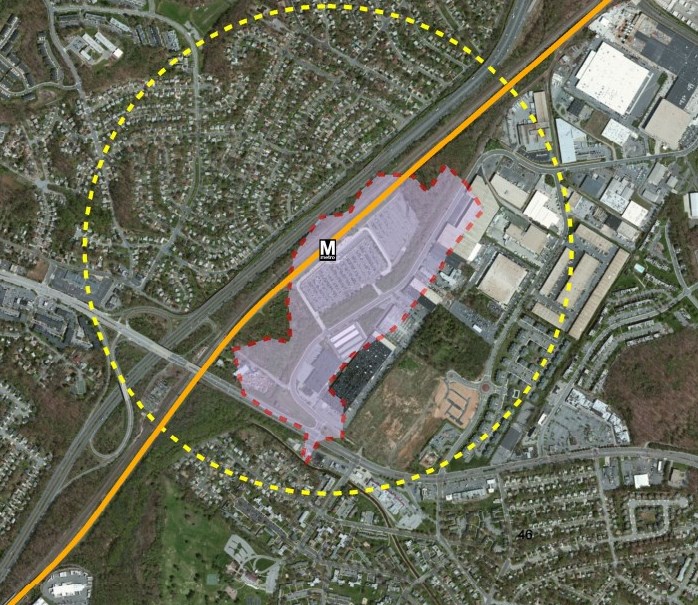
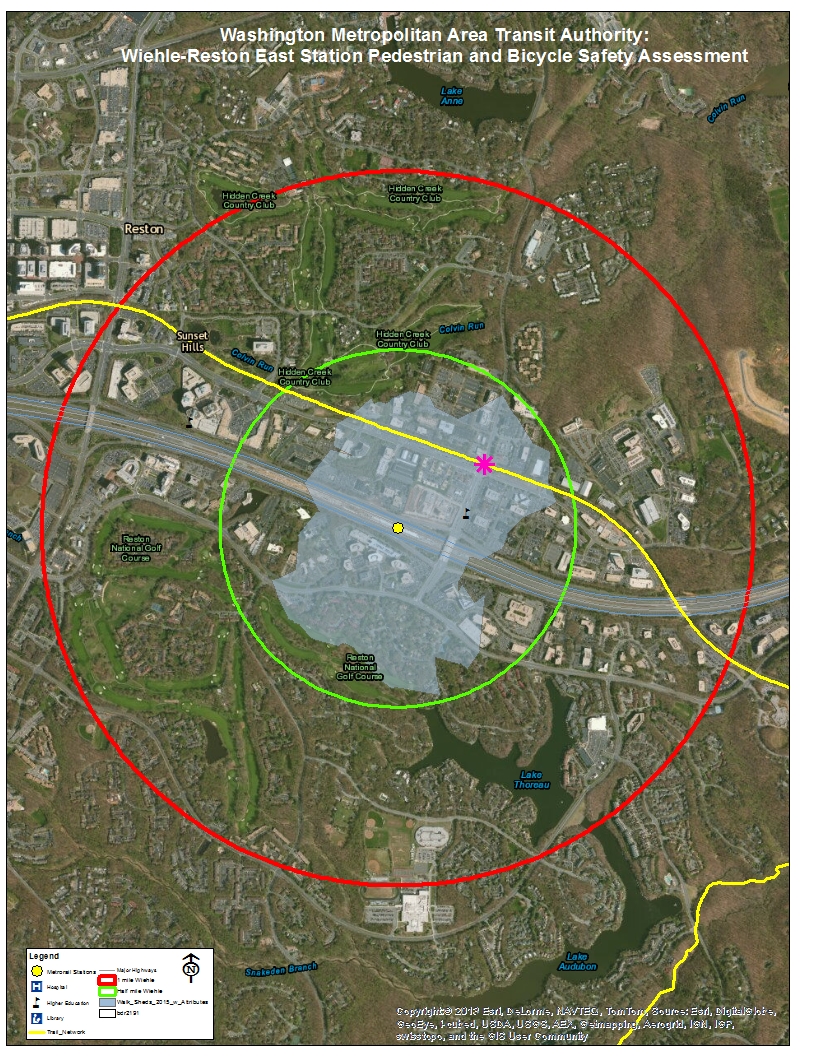
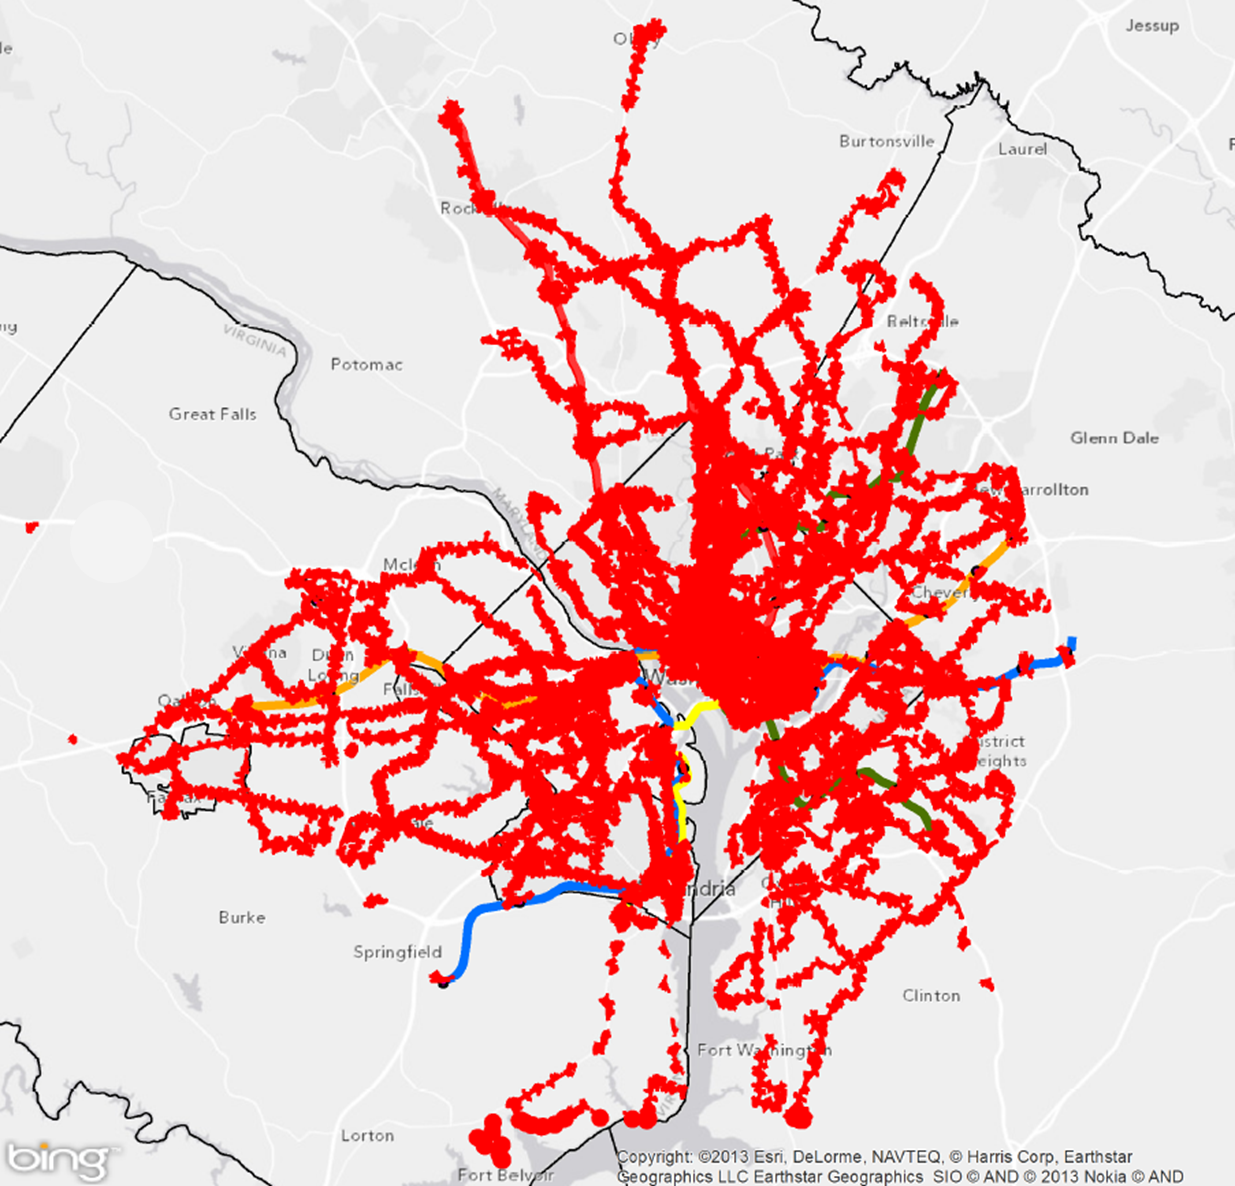
The summary report includes maps showing where the most-needed projects are located, as well as a “scorecard” detailing each project’s potential benefits as calculated in the prioritization process.  These include the safety measure defined by frequency of crashes proximate to the project, the potential ridership generated for certain projects, community facilities served, whether or not the project is located in a low income area (and, if so, how much of it falls in that area), the Walkscore, estimated cost, and a number of other useful indicators.

Read more…

Acting Regionally Pays Big Dividends (Part 3)

March 10th, 2016 Comments off

Adding jobs and households in transit-served areas not only increases Metro ridership, but also reduces and may even eliminate the subsidy that local governments pay to support Metro, meaning lower tax bills for regional residents.

(This post is part of a multi-part series* about ConnectGreaterWashington a study that WMATA completed in 2015 and its application of land use as a transportation strategy. The below post and links provide additional detail.)

In December of 2015, public and private leaders issued a call to action for the many jurisdictions in this region to start acting as one.  We’ve actually been thinking about this for some time, and their announcement timed well with our desire to share perspectives on the following questions.

Questions:

  • What if the region’s future actually approached the goals of collaborative regional plans such as Region Forward and Place + Opportunity?
  • Would WMATA and the region benefit?
  • Are there financial, social, quality of life and environmental benefits?

Answers: YES, YES, and YES!

Approach: Metro planners hypothesized that changing local jurisdictions’ and/or the region’s approach to future land use decisions, such as where to guide future jobs and population and expanding transit-supportive policies, could enable the region to better use the transportation system we already have rather than require us to spend tens of billions on new transportation projects.

Planners developed three different scenarios (A, B, and C) that used the transportation system we already have, but modified future growth policies that determine travel patterns. The below post talks only about Scenario A, which had a specific goal to increase ridership on all segments of the Metrorail system, while minimizing the potential for overcrowding on any segment in the system. The image below shows how we built Scenario A and its three iterations (A Prime, A1, A2).


Approach for Building Scenario A to make transit more efficient

Read more…

How Can the Transportation Planning Board Support Metro?

January 13th, 2016 Comments off

Metro and the Transportation Planning Board (TPB) engaged in a wide ranging discussion with TPB board members about how the TPB and the region’s jurisdictions can support Metro now and in the future. Not surprisingly, there’s a lot more to it than just predictable funding.

At the December 16th Transportation Planning Board (TPB) meeting (audio), Metro Board Member Harriet Tregoning gave the final presentation (pdf) and facilitated a discussion on Metro’s challenges and provided specific recommendations and/or opportunities for the TPB and local jurisdictions to increase their support the Authority today, tomorrow, and into the future. The focus of the discussion was specifically on plans, processes, and actions that the TPB and local jurisdictions can modify or begin that will ensure predictable funding and/or enhanced funding options, incorporate land use as a transportation strategy, increase transit-supportive land use decisions, prioritize bike and pedestrian access, and advance bus priority on the streets that local jurisdictions operate.

Last summer, TPB members requested a more extensive conversation surrounding Metro’s challenges as well as recommendations on how TPB, through its plans and processes, and local jurisdictions, through their decisions and funding, could support Metro. Metro opted to provide three presentations and the December presentation built on information provided at the November 18th meeting (audio) on Metro Fundamentals (pdf) and Momentum (pdf) that were given  by Tom Webster, Managing Director of Metro’s Office of Management and Budget, and Shyam Kannan, Managing Director of Metro’s Office of Planning. The November presentations served to ensure a baseline understanding across TPB Board members, highlight our capital and operating challenges, and identify safety, state of good repair, and longer term needs to ensure safe, reliable transit that meets the growing region. Read more…

When Work Evolves – Metrorail in the Era of the Flexible Workplace

December 21st, 2015 10 comments

Between 2007 and 2012, off-peak work trips were the fastest-growing segment of Metrorail ridership.

The traditional “rush hour” remains important, but Metrorail ridership seems to reflect a broader trend regionally – people are making more and more trips during “off peak” hours. According to the 2012 Metrorail survey, rail ridership growth was stronger in its off-peak (8 percent since 2007) than the peak (5 percent over the same time period). In certain jurisdictions – including those that have fostered re-investment in dense, walkable areas – off peak growth was into the double digits while peak growth grew more modestly. In one jurisdiction, off-peak trips grew by 50% during this period while peak trips grew at less than half that clip. 

Compact Jurisdictions Peak Off-Peak
% Change % Change
District of Columbia 8.3% 12.9%
Arlington County 18.4% 9.0%
City of Alexandria 9.5% 12.7%
Montgomery County 0.1% 5.9%
Prince George’s County -7.4% -1.4%
Fairfax County -1.4% 3.0%
City of Falls Church 21.3% 46.9%
Fairfax City 32.8% 19.4%
Compact Total 3.0% 8.0%

Data sources, Metrorail ridership surveys, 2007 and 2012.  2012 is the most recent dataset we have on trip purpose. 

In the past these trips would be for theaters, late night entertainment, or shift work, but the bulk of these off-peak trips were during the midday – almost twice the number of late night trips – and the bulk of these trips were for work. Read more…

Metro Studying Ways to Improve Bike/Ped Access to Stations

October 7th, 2015 Comments off

Improving walk and bike access is a cost effective way to increase ridership and improve the efficiency of the Metrorail network.   Where are these improvements needed and how should we (as a region) prioritize them?

Landover Walkshed

What projects might increase the size of the walk shed of the Landover Metrorail station?

In a number of earlier posts starting last summer, we’ve discussed the concept of walk sheds and explored the relationship between walkability, land use, and Metrorail ridership.  One conclusion of this effort:  grow the size of the walk shed and you’ll grow ridership.

Generally, we only have control over what happens on our own property.  While we have made great strides in identifying and prioritizing bike/ped access improvements on our own property, increasing the size of the walk sheds requires coordination with state or local agencies who own, plan, design and construct roads, sidewalks and pathways near our stations.  We know that in order to have a larger impact on walk and bike access, we need to cast a wider net and identify projects that are up to one mile from our station entrance.  We have created a plan — the Station Access Investment Strategy — to highlight some of these projects as priorities for our local partners to use as they develop their capital improvement plans. Read more…

Feds, Metro, Locals take on Pedestrian and Bike Safety at Wiehle-Reston East

July 16th, 2015 Comments off

On May 12, 2015, the Federal Transit Administration (FTA) convened an event to bring together Federal, State, regional, and local transportation officials and local stakeholders for an on-the-ground bike-ped safety assessment at the Wiehle-Reston East Metrorail station.

BaseMap_2014_Wiehle Assessment

Wiehle-Reston East: one mile bikeshed and 1/2 mile walkshed

The assessment was one of 50+ that have been occurring around the nation as part of U.S. Department of Transportation Secretary Anthony Foxx’s “Safer People Safer Streets” campaign to improve bike-ped safety across the country.  These assessments have been led by many of the US DOT agencies and operating administrations, namely: Federal Highway Administration (FHWA), National Highway Traffic Safety Administration (NHTSA), Federal Transit Administration (FTA), Federal Motor Carriers Safety Administration (FMCSA), and the Federal Railroad Administration (FRA). Each of these agencies is participating in the effort to improve bicycling and pedestrian safety, and each has particular roles and responsibilities in this effort.

The primary goal of these assessments is to:

  • facilitate relationship-building between employees of different jurisdictions who share responsibility for creating safer streets;
  • engage practitioners who typically focus on pedestrian and bicycle safety, as well as those who do not; and
  • focus on locations that have non-motorized safety challenges.

The assessment kicked-off with remarks from Deputy Secretary, Victor Mendez, who stressed the importance of agency coordination in ensuring bicycle and pedestrian safety on America’s streets, later blogging about the event on US DOT’s FastLane blog. Metro’s Director of Planning, Shyam Kannan, also gave remarks that highlighted the importance of station connectivity for increasing Metrorail ridership.  Other VIPs from Fairfax County, Virginia Department of Transportation (VDOT) and local community/advocacy groups spoke to the participants as well about the importance of the day’s events to keeping our residents safe as they travel. Read more…

A Half-Mile Walk to the Nearest Metrorail Station, Mapped

August 4th, 2014 21 comments

Here’s a map showing the walkable area around the nearest Metrorail station.

eGISBaseLTR_RailPedSheds NonOverlap

Did you ever wonder which Metrorail station is closest? Where’s the breakeven point between two stations? This map shows the areas you can actually reach within a half-mile walk along the roadway network, as we described previously. The twist this time is that I disallowed “overlap” within the GIS network analysis, so land is allotted to the closest station only, calculated by network walk distance.

What do you see in this map?  Here’s a regional view with all stations, as well.

Update 9/2/2014: the GIS source file for this map is now available for download, in geodatabase (.gdb) format.

What’s the Ideal Size for a Transit Walkshed?

July 8th, 2014 2 comments

Large transit walksheds are great, but how big is big enough?

In other posts, we have described what a transit walkshed is, and how changes can be made to the pedestrian network to increase the walkshed area.  Here, we explore how big is big enough.

The diagram below shows a half-mile circle around a transit station.  If the station were located in a field of grass or on a massive parking lot, the walkable area of the circle would be the circle itself, 100% of the half-mile buffer around the station would be accessible by foot.  Unfortunately, that wouldn’t bode well for transit use, since there wouldn’t be any origins or destinations within that walking distance.

Ideal Walkshed DiagramNow, let’s lay a perfect grid of streets across that half-mile buffer.  The street area is where people can walk, and the remaining area contains houses, shops, mixed-use development, etc.  The resulting walkshed for the station begins to look like a diamond inscribed inside the circle.   The smaller the blocks (the closer the streets are to one another) the more the walkshed resembles a perfect diamond that has a diagonal distance equal to the diameter of the circle.  If you take the area of the diamond and that of the circle and compare them, you find the walkshed (square) covers 63.7% of the circular station area buffer.

So if you have a perfect grid and get 63.7% coverage, how can you get any better?  For one, diagonal streets can increase the coverage: if two diagonal streets were added to the grid, intersecting in the center of the circle at the transit station, the square walkshed would turn into an eight-pointed star, increasing coverage even more, but not by much.

An good example of a walkshed greater than 63.7% is that of the Takoma station.  Featured in a previous post, we recently calculated a 91% coverage for Takoma.

It is difficult to pick an ideal size for a transit walkshed.    A larger percentage could be beneficial, but the additional roadway network needed to expand the coverage beyond 63.7% may result in less area dedicated to potential transit origins and destinations.  (Remember the station in the parking lot?)

What Metrorail stations do you feel have good walkshed coverage?  In  your opinion, where can we improve?


How Can The Coverage of Transit Walk Sheds Be Increased?

July 1st, 2014 2 comments

Pedestrian infrastructure can cost-effectively increase coverage of transit walk sheds.

The roadway networks of most station areas are mostly unchangeable.  Existing structures on private property create unmovable barriers and  usually prevent new roads from being added to the network.  However, there is still opportunity to add pedestrian facilities that would increase a station’s walk shed in a relatively cost-effective way.

Take the example of Southern Ave Metrorail station.  We previously noted how a large number of customers drive to the station from between one and three miles away.  We discussed several reasons for this tendency to drive to Southern Ave, including the proximity to parks on both sides of the station.  The map below shows the transit walk shed of Southern Ave station.

Current walkshed of Southern Ave station.  The area with the orange dotted border contains over 1,200 households that could be within a half mile of Metrorail if a direct pedestrian connection were built.

Current walkshed of Southern Ave station. The area with the orange dotted border contains over 1,200 households that could be within a half mile of Metrorail if a direct pedestrian connection were built.


But what if a pedestrian path could be built to connect the station to the neighborhood to the north?

If a well lit, safe pedestrian path were constructed between the station and the orange-dotted area on the map, it could expand the walkshed to include up to 1,200 additional households in DC.  This new connection would likely increase ridership at Southern Ave. and might even generate enough additional fare revenue to fund the construction of the trail.

Metro’s Office of Planning is currently evaluating the walk sheds of our rail transit stations.  What other opportunities do you see for cost-effectively increasing the walk sheds around Metrorail stations?

What’s a Transit “Walk Shed”?

June 10th, 2014 6 comments

Metro will soon be measuring how much growth happens in places that are walkable to transit. Here’s an in-depth look at how we define “walkable” to Metrorail stations and Metrobus stops.

Quarter-mile walk (by the network) for regional Metrobus stops and Metrorail stations

Areas reachable on foot from regional Metrobus stops and Metrorail stations

Metro’s new Connecting Communities metric will measure annual household growth in our region that occurs within the “transit shed” – the catchment area around transit service that generates walk ridership. And improving walkability can be an incredibly cost-effective way to reduce congestion and increase transit ridership.  Let’s take a closer look at how we defined what’s “walkable to transit.”

How Far is Walkable? First, we defined walking distance as a half-mile from Metrorail, and a quarter-mile from Metrobus, for a number of reasons:

  1. Of all the passengers who walk to Metrorail each morning, the median walking distance is just under a half-mile (0.35 miles, actually).  Riders walk farther to some stations than others, but the systemwide average is just shy of a half-mile.  Since rail riders are on average willing to walk a little under a half-mile today, it is reasonable to use a half-mile as an upper limit for walking in the future. (We don’t have similar survey data on Metrobus – yet.)
  2. The land use within a quarter- and half-mile is where we see the strongest effects on ridership on Metro today. More on this below.
  3. Academic literature supports the half-mile radius from rail transit as no better than any other distance, particularly for the link between households and ridership.
  4. Practically, setting the distance any farther than 0.50 and 0.25 miles increases overlap with other nearby stations and bus stops, which increases computational complexity. Read more…