
Ask the Professors - How Local Land Use Decisions Impact Metrorail Ridership
This post is guest-written by Chao Liu, Hiro Iseki, and Gerrit Knaap, researchers from University of Maryland’s National Center for Smart Growth, who helped Metro develop our Land Use Ridership Model.
Even though Metro doesn’t control where new jobs and households locate in the region, these decisions are critical to the agency’s ridership and financial future.
It is well known that the form and intensity of development in and near rail transit station areas can have measurable impacts on transit ridership. For these reasons, transit oriented developments (TOD) generally feature high-density construction, mixed land uses, and bike and pedestrian friendly infrastructure. But not all TODs are alike, and the effects of TOD on transit ridership are likely to depend on how well the station is connected both locally and regionally, whether the station is near the center or end of a transit corridor, and what kinds of jobs and household are located nearby.
To explore how different forms of development might impact ridership on the Washington Metrorail system, Dr. Hiroyuki Iseki and Dr. Chao Liu assisted Metro to develop a direct ridership model (DRM), called Metro’s Land Use Ridership Model. A DRM uses statistical techniques to quantify the relationship between entries and exits at rail stations and land uses nearby. This model can then be used to estimate the number of passengers who will access the station, by waking or biking, as a result of changes in land use features, transit service characteristics, and socio-demographics within the walkshed of any given station.
The direct ridership model includes a large number of variables for each station, including the density, diversity, and design of local environment; transit service and connectivity; job accessibility by auto and transit; walk score; the availability of parking; the demographics of nearby residents; the number and types of jobs nearby, and more. The model was estimated for the AM Peak, Midday, PM Peak, and Evening travel periods. The AM Peak model is best suited for estimating the increase in morning boardings that would result from locating more households near the station; the PM Peak model is best suited for estimating the increase in afternoon boardings that would result from locating more jobs near the station.

Map 1. Predicted AM Peak Entries per New Household
The impact of adding jobs and households near stations varies by station area. Map 1 above, for example, shows the estimated entries per new household in the morning peak—that is, how many additional boardings would occur in the AM peak if one additional household was located in the walkshed of the station. Stations shown by red dots gain more than 0.57 boardings per day, for each new household in the walk shed, while stations shown with green dots gain only about 0.20 boardings per day. As a concrete example, Rhode Island Row is a 274-unit, mixed-use, TOD project built on a WMATA site. Situated along the busy Red Line, the project has long been considered as a prime location for new housing development. According to the DRM model, adding 274 new households near the Rhode Island station would increase boardings by 144 passengers in the AM peak. The same development at the New Carrollton station, however, would have added only 52 passengers. This is because, compared to New Carrollton, the Rhode Island Avenue station has better job accessibility and more frequent transit service, and is thus likely to stimulate more transit ridership.
Map 2 below shows the estimated PM Peak boardings per job—that is, how many PM Peak boardings can be expected by adding one job in the walkshed of each station. The stations shown as dark blue dots gain more PM entries than the stations shown as red or gray dots. Adding 10,000 new jobs would add 3,550 boardings per day at the NoMa station, 1,341 additional boardings per day at the Friendship Heights station, and 881 boardings per day at the Greenbelt station.
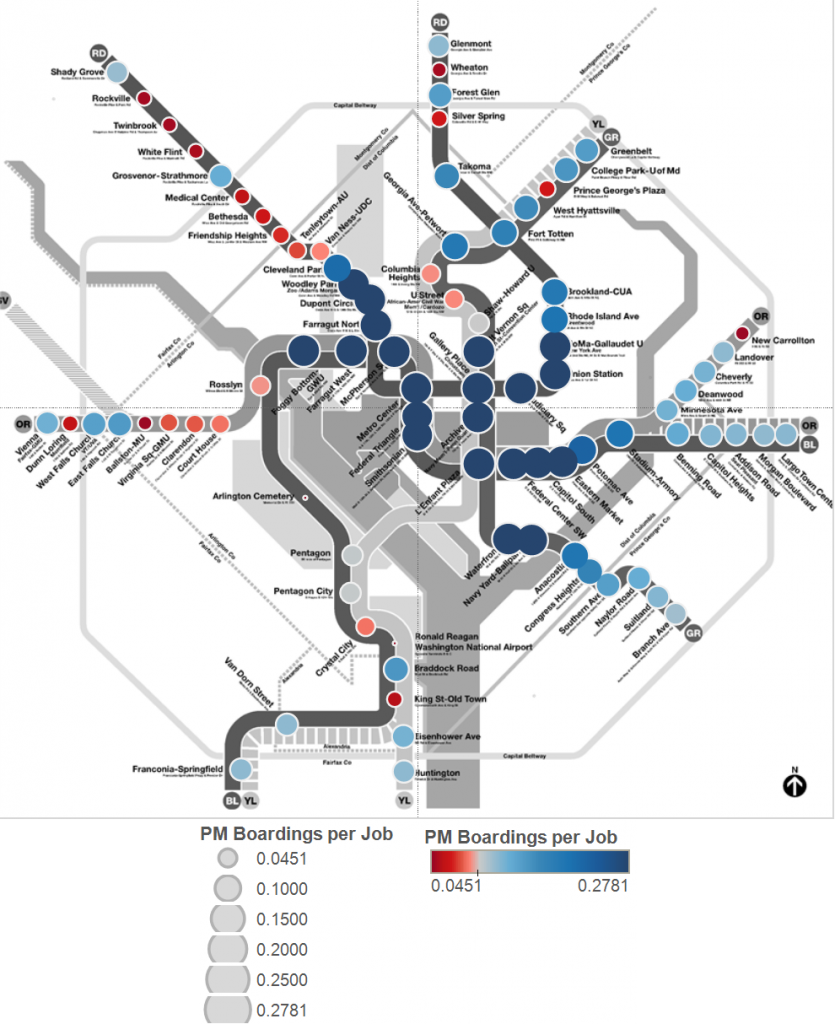
Map 2. Predicted PM Peak Entries per New Job
The results indicate that three variables have critical impacts on boardings: number of jobs, proximity to downtown, and transit service level (measured in trains per hour). The NoMa station is located near the downtown core, which is centrally located, and has a very high concentration of jobs and high levels of service. That is why NoMa, for example, would experience a greater increase in boardings for a given increase in jobs. Friendship Heights station is located a little further from the core but has good transit service and a moderate concentration of jobs. These factors would cause Friendship Heights to experience a smaller increase in boardings than NoMa for the same increase in jobs. Greenbelt station has fewer jobs located nearby, is located at the end of the Green line, has lower levels of service, and lower household accessibility. This is why more jobs at the Greenbelt station would result in the lowest increase in boardings.
In summary, the Land Use-Ridership Model provides a useful platform for testing the impacts of land use on transit ridership. The models confim that both households and jobs in transit station areas play an important role in generating ridership. Both the AM and PM Peak models suggest that stations in downtown will gain more ridership from development near transit stations, but this is also the region where Metro has the greatest capacity constraints. The location of jobs and households are not decisions over which a transit operator like Metro has any control or significant influence. But given the financial constraints and service capacity issues that Metro has to confront, the question of how development patterns can best be managed to maximize the efficiency of the region’s critical transit system is not a question that regional policy makers should ignore.
What’s Next? The NCSG team is extending this work into an econometric model to help inform fare policy. Using the origin and destination station pairs as the unit of analysis, this model will estimate fare elasticities, including: time of day, travel distance, different rider classes, Metro 2025 stations, and directions.

“The results indicate that three variables have critical impacts on boardings: [1] number of jobs, [2] proximity to downtown, and [3] transit service level (measured in trains per hour)”
Do we have any data that would allow insight into how a change in variable 3, transit service level, affected boardings for given metro stops?
Thank you