
Regional Transit Opportunities Explored
You name it, we tested it as possible opportunities to carry future demand and here’s what we found out.
Metro is completely focused on safety, reliability, and financial stability. It’s also our job to ensure that the regional transit system improves mobility and connects communities. So we’ve had many posts on ConnectGreaterWashington over the last few years describing the importance of a regional approach to transit planning. Posts include FAQs, how different modes compare, the paramount importance of transit-supportive land use, an approach to assessing Metrorail, BRT, and LRT expansion projects, and the overall proposed plan for Metrorail and surface transit to name a few.
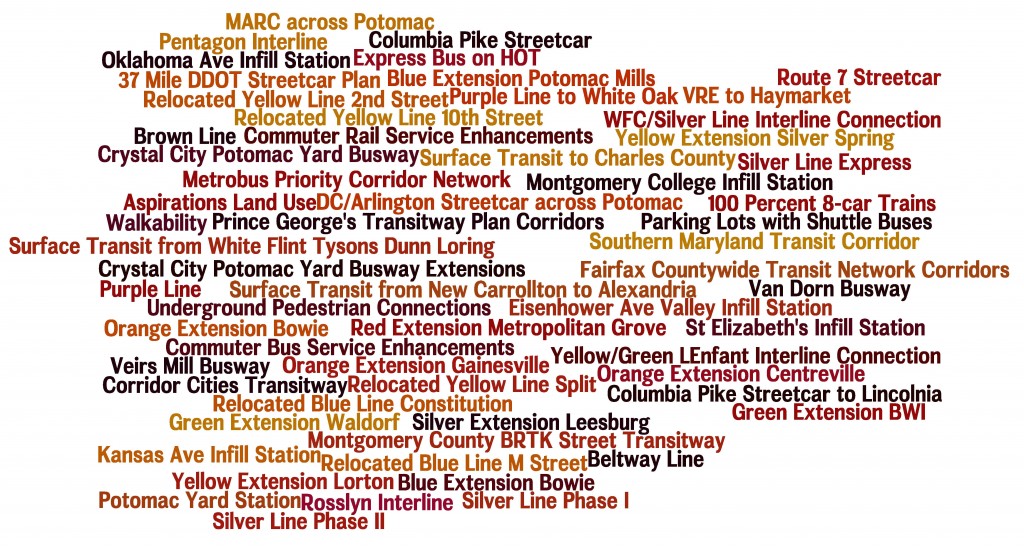
List of Transit Corridors, Projects, and Plans Analyzed as Part of CGW
Finally, we have completed a set of one- to two-page summaries for all the strategies, plans and projects we tested in our evaluation of future needs and opportunities. Note, these summaries are inclusive of everything that we analyzed over the course of ConnectGreaterWashington, but only some are recommended to advance. Some strategies were recommended (e.g. eight-car trains), others were not recommended (e.g. Kansas Ave. infill station), while many were partially recommended (e.g. the I-66 corridor beyond Vienna shows promise as bus rapid transit, light rail, or enhanced bus, but not Metrorail unless and until additional housing and/or jobs are guided to the station areas and new Metrorail lines are added in the core).
Due to the size of the pdfs, the summaries are divided into three documents. First, are the new Metrorail lines in the core, eight-car trains, and interline connections (pdf updated February 24, 2016). Second, are Metrorail pedestrian tunnels, extensions, and infill stations (pdf updated February 24, 2016). Third, are all of the other modes’ strategies, plans, and projects (pdf updated February 24, 2016). All documents include bookmarks to help you find the various summaries by topic area.
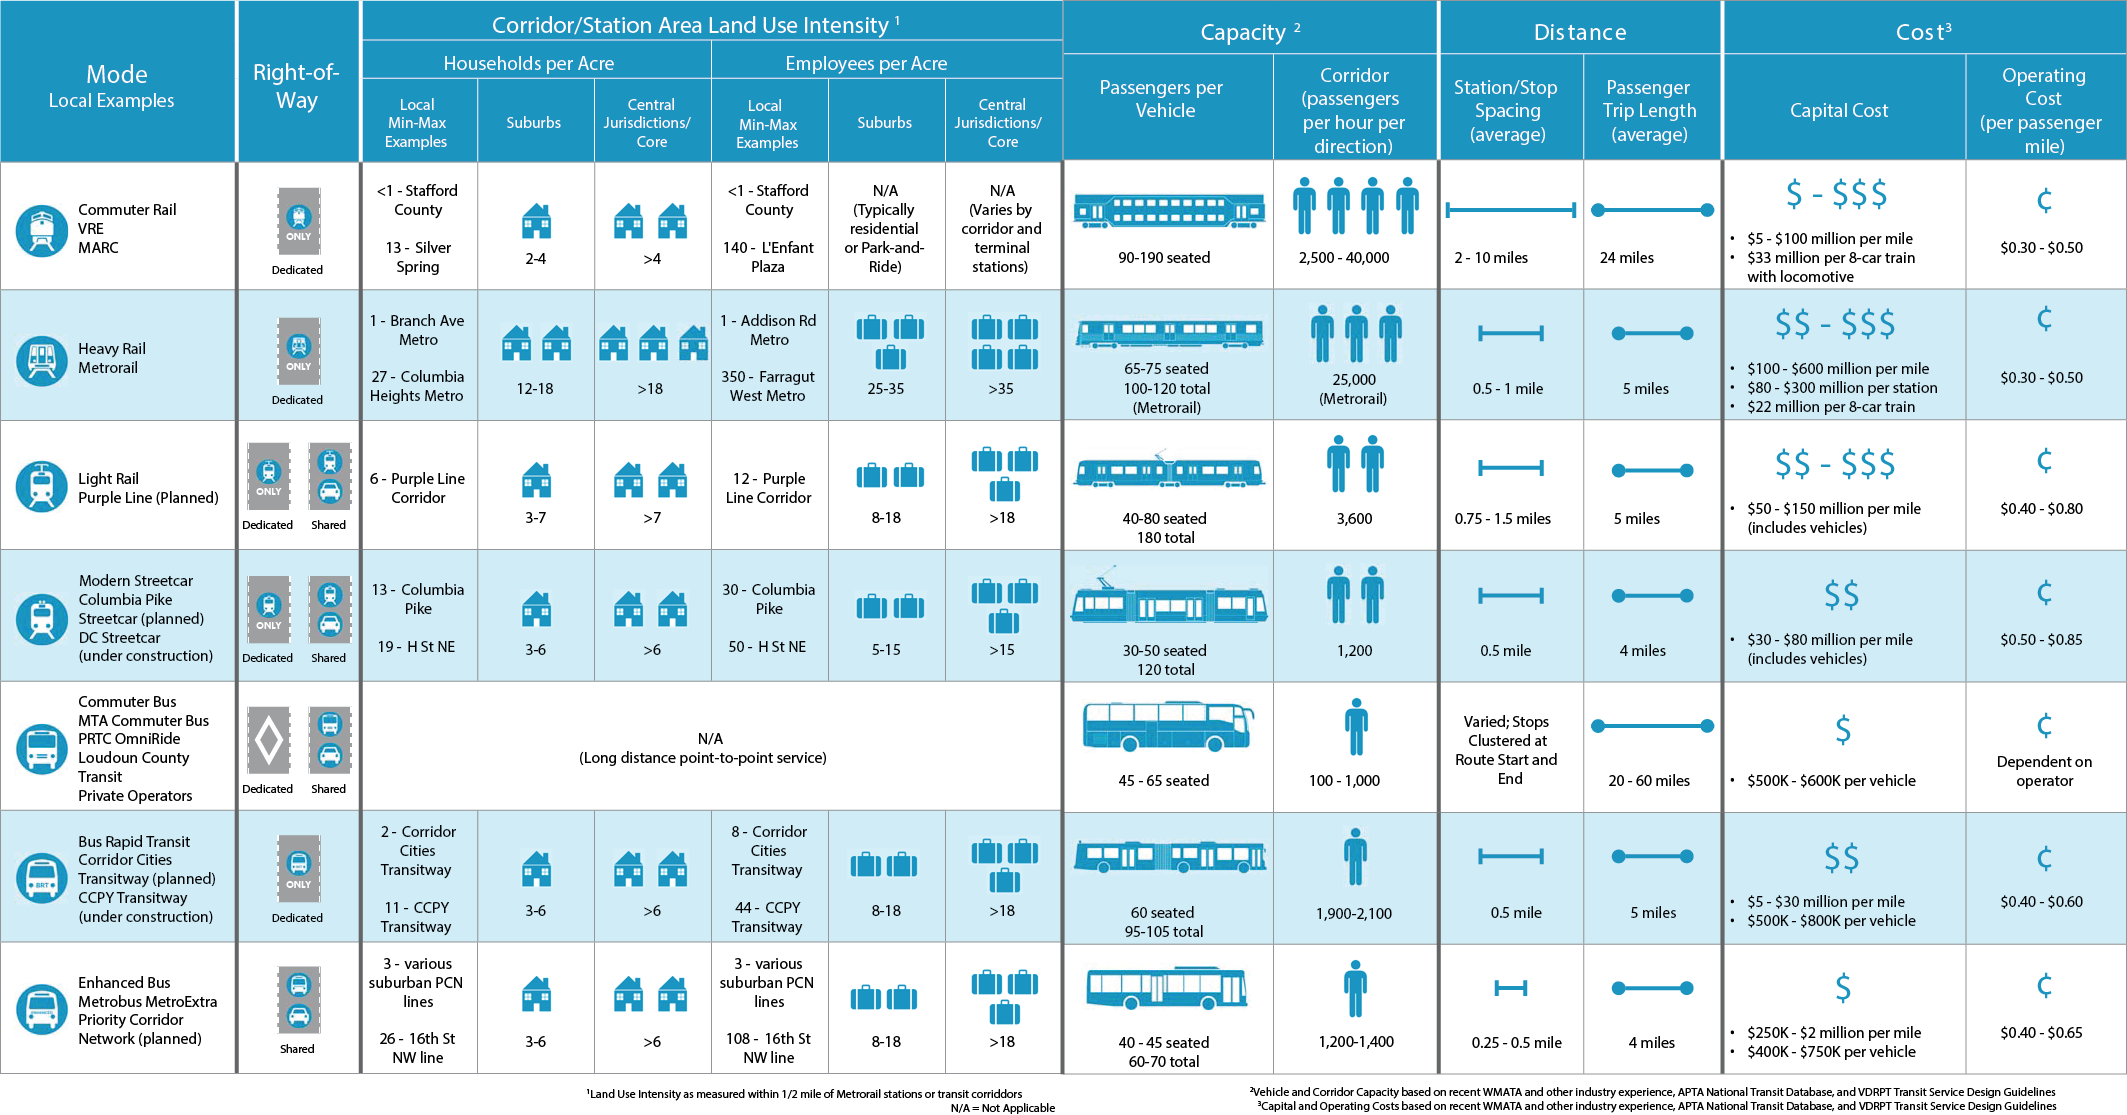
Each strategy, project, or plan includes:
- A summary of the strategy;
- The goals that were addressed;
- The regional activity centers connected;
- A map that shows the project or plan;
- Key findings for each such as ridership (including new transit riders vs riders gained from other existing modes), transfers, crowding, connectivity, and surrounding density; and
- Recommendations for this strategy.
As we and the region continue to grapple with today’s safety, operations and maintenance needs, while also planning for future growth, we will continue to refer to the CGW work undertaken to date. Let us know how you can imagine this body of work being used in the future.


Recent Comments