Posts Tagged ‘walk sheds’

Prioritizing Bike and Pedestrian Station Access Projects Near Metrorail, Part 2

November 24th, 2015 Comments off

Other than ridership potential, what are some of the other ways we can rank access projects relative to each other?

In our last post, we discussed how bike and pedestrian access projects relate back to ridership and how that relationship could be used to prioritize projects. In this post, we talk about some of the other criteria we are using to prioritize projects.

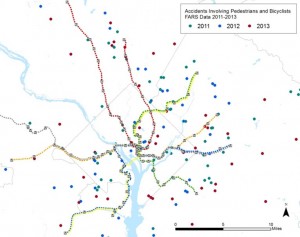
Bike and Ped. Fatalities, Sample Data Set

Bike and Pedestrian Fatalities, Sample Data Set

The first is safety. We are pulling together data about bike and pedestrian crashes near our stations that result in injuries or fatalities. We will then link these data in GIS back to the location the project, with the idea being that a new crosswalk or dedicated bike path in an area with a lot of recent crashes should score higher and deserves more attention. A safer path of travel helps not only our customers but all walkers and cyclists in these areas.

We also want to explore some other prioritization criteria. Here is what we have come up with: Read more…

Prioritizing Bike and Pedestrian Station Access Projects Near Metrorail

November 1st, 2015 Comments off

We all know improving station access is good.  But, how do we rank access projects relative to each other?   Step 1: Ridership

In our recent post, we gave you an overview of our Station Access Investment Strategy project.  We’ve identified 1,000s of recommendations for new pedestrian and bicycle infrastructure near our Metrorail stations and need a way to prioritize them.  After some thought, we’ve come up with a number of potential criteria.  In this post, we’ll discuss those that deal with ridership.

July 2014 Post on Ridership Potential from New Ped./ Bike Projects

Map of the Southern Ave walk shed from July 2014 Post on Ridership Potential from New Ped./ Bike Projects

Once again, one of key concepts we’ve been telling you about in recent months is that by improving access to stations we can grow ridership.  For stations with relatively small walk sheds, we’ll conduct a detailed analysis of what happens to the walk shed when the proposed projects are built.  For example, add a sidewalk at Cheverly and the walk shed will grow by X%.  We will then look at the amount of households and jobs in the newly connected area and, using some methods we’ve shown you in other posts, calculate the potential ridership gained by the new project.  The higher the potential ridership gain, the better the project scores.

But, we also want to understand the value of a new project to a part of the station that is already connected to the network and how this could relate back to ridership.  To do this, we’ve come up some other metrics.  They include: Read more…

Metro Studying Ways to Improve Bike/Ped Access to Stations

October 7th, 2015 Comments off

Improving walk and bike access is a cost effective way to increase ridership and improve the efficiency of the Metrorail network.   Where are these improvements needed and how should we (as a region) prioritize them?

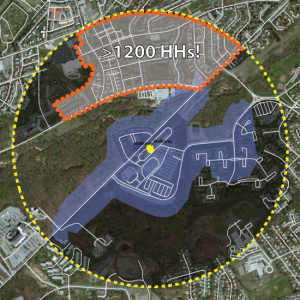
Landover Walkshed

What projects might increase the size of the walk shed of the Landover Metrorail station?

In a number of earlier posts starting last summer, we’ve discussed the concept of walk sheds and explored the relationship between walkability, land use, and Metrorail ridership.  One conclusion of this effort:  grow the size of the walk shed and you’ll grow ridership.

Generally, we only have control over what happens on our own property.  While we have made great strides in identifying and prioritizing bike/ped access improvements on our own property, increasing the size of the walk sheds requires coordination with state or local agencies who own, plan, design and construct roads, sidewalks and pathways near our stations.  We know that in order to have a larger impact on walk and bike access, we need to cast a wider net and identify projects that are up to one mile from our station entrance.  We have created a plan — the Station Access Investment Strategy — to highlight some of these projects as priorities for our local partners to use as they develop their capital improvement plans. Read more…

Rhode Island Avenue – an Opportunity to Truly Connect Communities (and Bolster WMATA Finances)

July 23rd, 2015 5 comments

Low-cost planning maneuvers could increase transit-accessibility for one thousand households and save the region $1.3 million per year!

We recently covered an exciting development project in Northeast D.C., one that will create housing and jobs right next to the Rhode Island Avenue Metro station. Because the site is located within the station’s half-mile walk shed, all those new residents, employees and shoppers are likely Metro customers, whose fares will help improve the system for everyone.

But is that the end of the story?

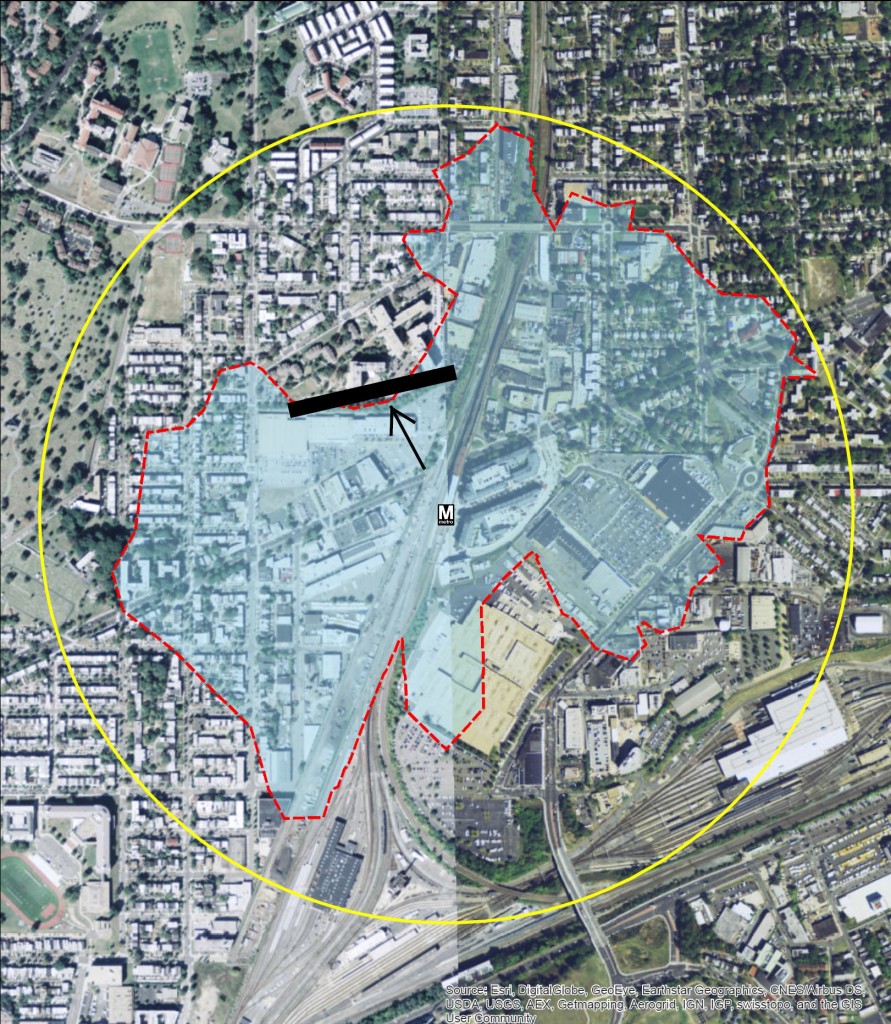
In our analysis of station walk sheds — the area within a half-mile walk of the station — we discovered that the Rhode Island Avenue walk shed is constrained by physical barriers that force pedestrians to make lengthy detours. The most notable of these is a retaining wall along the northern edge of the redevelopment site (currently the Rhode Island Center shopping mall):

RIExisting+Barrier

Current walk shed of Rhode Island Ave station, with illustration of the retaining wall.

For Edgewood residents living immediately to the north, walking to the Rhode Island Avenue Metro requires a detour around the barrier that inflates the walking distance by up to half a mile – making the total walking distance a full mile or more. While some choose to make the long hike to the station, we know that people are significantly more likely to use Metro if the station is within the half-mile walk shed.

This led us to ask: What if we make a pedestrian connection through that wall part of the large-scale redevelopment? Read more…

Vast Majority of New Office in Region Near Metro

April 22nd, 2015 2 comments

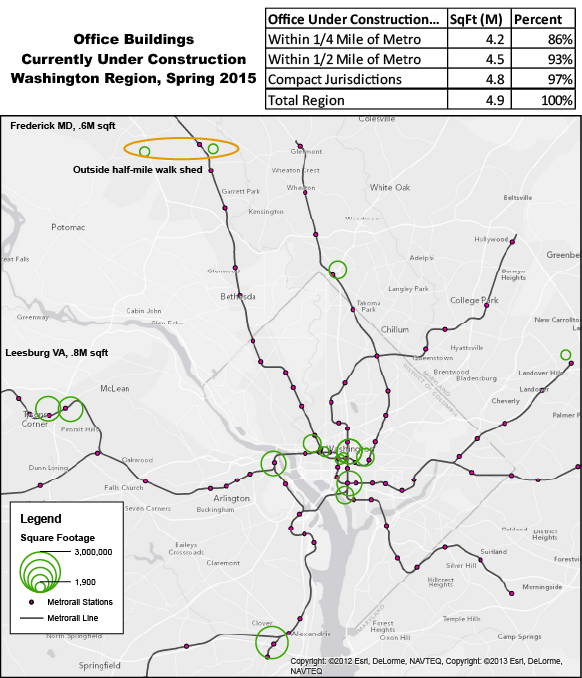
Approximately 86% of the region’s new office construction is occurring within one-quarter mile of Metrorail stations, 93% within the half-mile walk sheds.

A Washington Post article from October 2013 made a staggering assertion:  That 84% of new office construction in the region is occurring within one quarter mile of a Metrorail station, according to Jones Lang LaSalle and other data sources.  As we continue to dig into walk sheds and the land-use/transportation connection, we thought we would revisit this assertion and update it for 2015.

Since the Post article was written, we have begun to plan for near-term capacity constraints that might result from increased ridership caused by new households and jobs near Metro.  And part of this planning is gaining insight as to where and when new housing units and office space may come online through real estate industry data sources.   Through this research, we are able to update the statistic above:

86% of new office construction in the Washington region is occurring within one-quarter mile of a Metrorail station. 

UnderConstructionMap-01

New office currently under construction in the Washington region. All but four projects are within a half-mile of Metrorail.  Data from Jones, Lang, LaSalle.

Read more…

Going Up – Why the Construction Pipeline Means Higher Metrorail Ridership (Part One)

April 6th, 2015 5 comments

We’ve claimed that Transit-Oriented Development (TOD) projects in this region will be critical to Metrorail ridership and sustainability. The good news is that our assertions are grounded in statistically rigorous evaluations of TOD’s impact on Metrorail ridership – here’s how. (Part one of a two-part series).

While factors like fares, service, and the economy can certainly explain some changes in Metrorail ridership, one absolutely fundamental explanation of differences in walk ridership between stations is development.  Why does a station like Landover see only 50 riders arrive on foot each morning, and a station like Crystal City see over 3,000?  Why does a station like Bethesda see balanced ridership in all directions, where a station like Suitland is almost entirely one-direction? Development. Even a simple scatter plot shows that households alone near the station explain 70% of AM Peak walk ridership!

Planning studies have long-posited that transit-oriented development is such a key part of driving ridership, and if that is the case, then TOD is vitally important to Metro’s long-term financial sustainability.  We at Metro needed to quantify this link in a more sophisticated and system-specific way, and so we created a way to calculate the impact of land use changes (household growth, employment growth, new development) on ridership and revenue.

What is a Land Use-Ridership Model? To help, Metro’s Planning Office has built a Land Use-Ridership Model that will predict changes in Metrorail ridership as a result of occupancy changes (growth, decline, new development, etc.) in the station area.  This model helps us get very specific when it comes to modeling the impact of land use changes on ridership and revenue.  It helps us answer questions such as: “When developers build a new apartment building next to a Metrorail station how much ridership and revenue will Metro realize?”, and; “If an office building is proposed at one of four Metrorail stations, which location maximizes ridership and revenue without exacerbating core capacity constraints?”

LURM general flow

This tool is based on a rigorous understanding of the link between land use and the rail ridership we see today and is built on “direct ridership modeling techniques” found in academia.  It also focuses specifically on “walk ridership” (which constitutes 38% and 78% of our AM and PM peak ridership), since rides related to bus transfers, parking, and other access modes are less related to adjacent land uses.

To build this, we analyzed the actual quantity of walkable land uses from each station area, assembled detailed information about land uses and densities in those areas (households, jobs by industry type), and also controlled for other, non-land-use factors that shape ridership – like network accessibility. In all we worked through over 200 independent variables in our modeling and also brought in experts from the University of Maryland’s Center for Smart Growth, professors Hiroyuki Iseki, Ph.D. and Chao Liu, Ph.D., to bring their analytical and statistical firepower to the fray.

How We Built It. We defined the walkable area as a half-mile walk along a road network, so we account for barriers like highways and fences.  The half-mile cutoff is a bit longer than the median actual walk distance reported by our riders in the 2012 Metrorail Passenger Survey. For each station and its walk shed, we tested the following kinds of factors: Read more…

Walk This Way – Metrorail’s Walkshed Atlas 1.0

March 30th, 2015 15 comments

Station-area walkability is one of the most potent congestion-busting tools in the planner’s bag of tricks. Now we’ve mapped out in detail which stations are living up to their full potential – and where we need to redouble our efforts.

We’ve brought to you information about the power of station area walkability. Not only does better station access give mobility benefits to those who most need it, but it also boosts ridership and revenue and therefore lowers Metrorail’s operating subsidy. That means lower taxes for you and me.

Metro’s Office of Planning is wiring the science of walkability into WMATA’s Key Performance Indicators. We are committed to working with our partner jurisdictions to improving station area access and identifying the near-term and low-cost improvements that have big returns for ridership and revenue. And we have been working diligently to develop a comprehensive geodatabase of walk sheds and the land uses – existing, planned, and proposed – located within them.

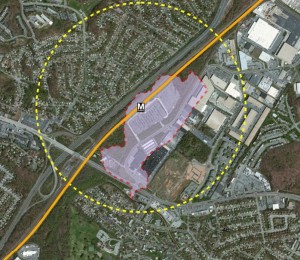
Example walk shed, extracted from the Walk Shed Atlas.

We’re also happy to release for the first time a comprehensive atlas of Metrorail walk sheds that includes some of the data that the Office of Planning uses to calculate ridership potential and evaluate investment needs. You’ll notice that each station area has a unique “footprint” and that in almost every case, the walkshed footprint is related to the overall performance of the station (as defined by all-day boardings).

A few notes here: Read more…