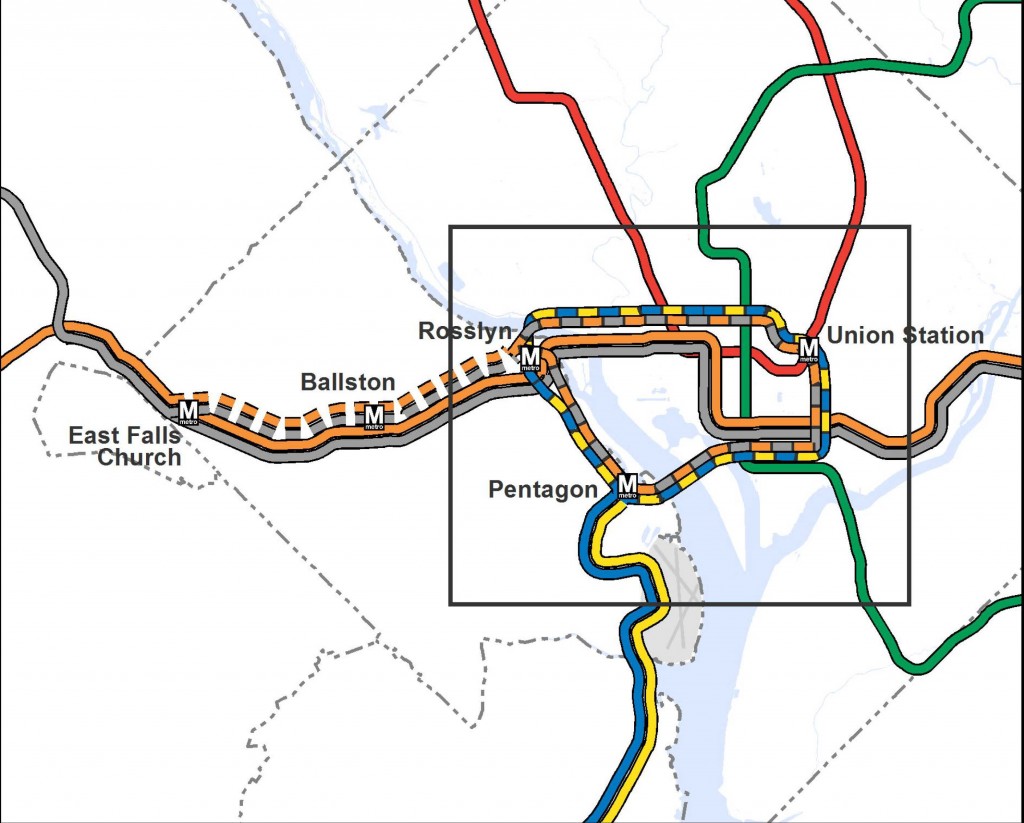
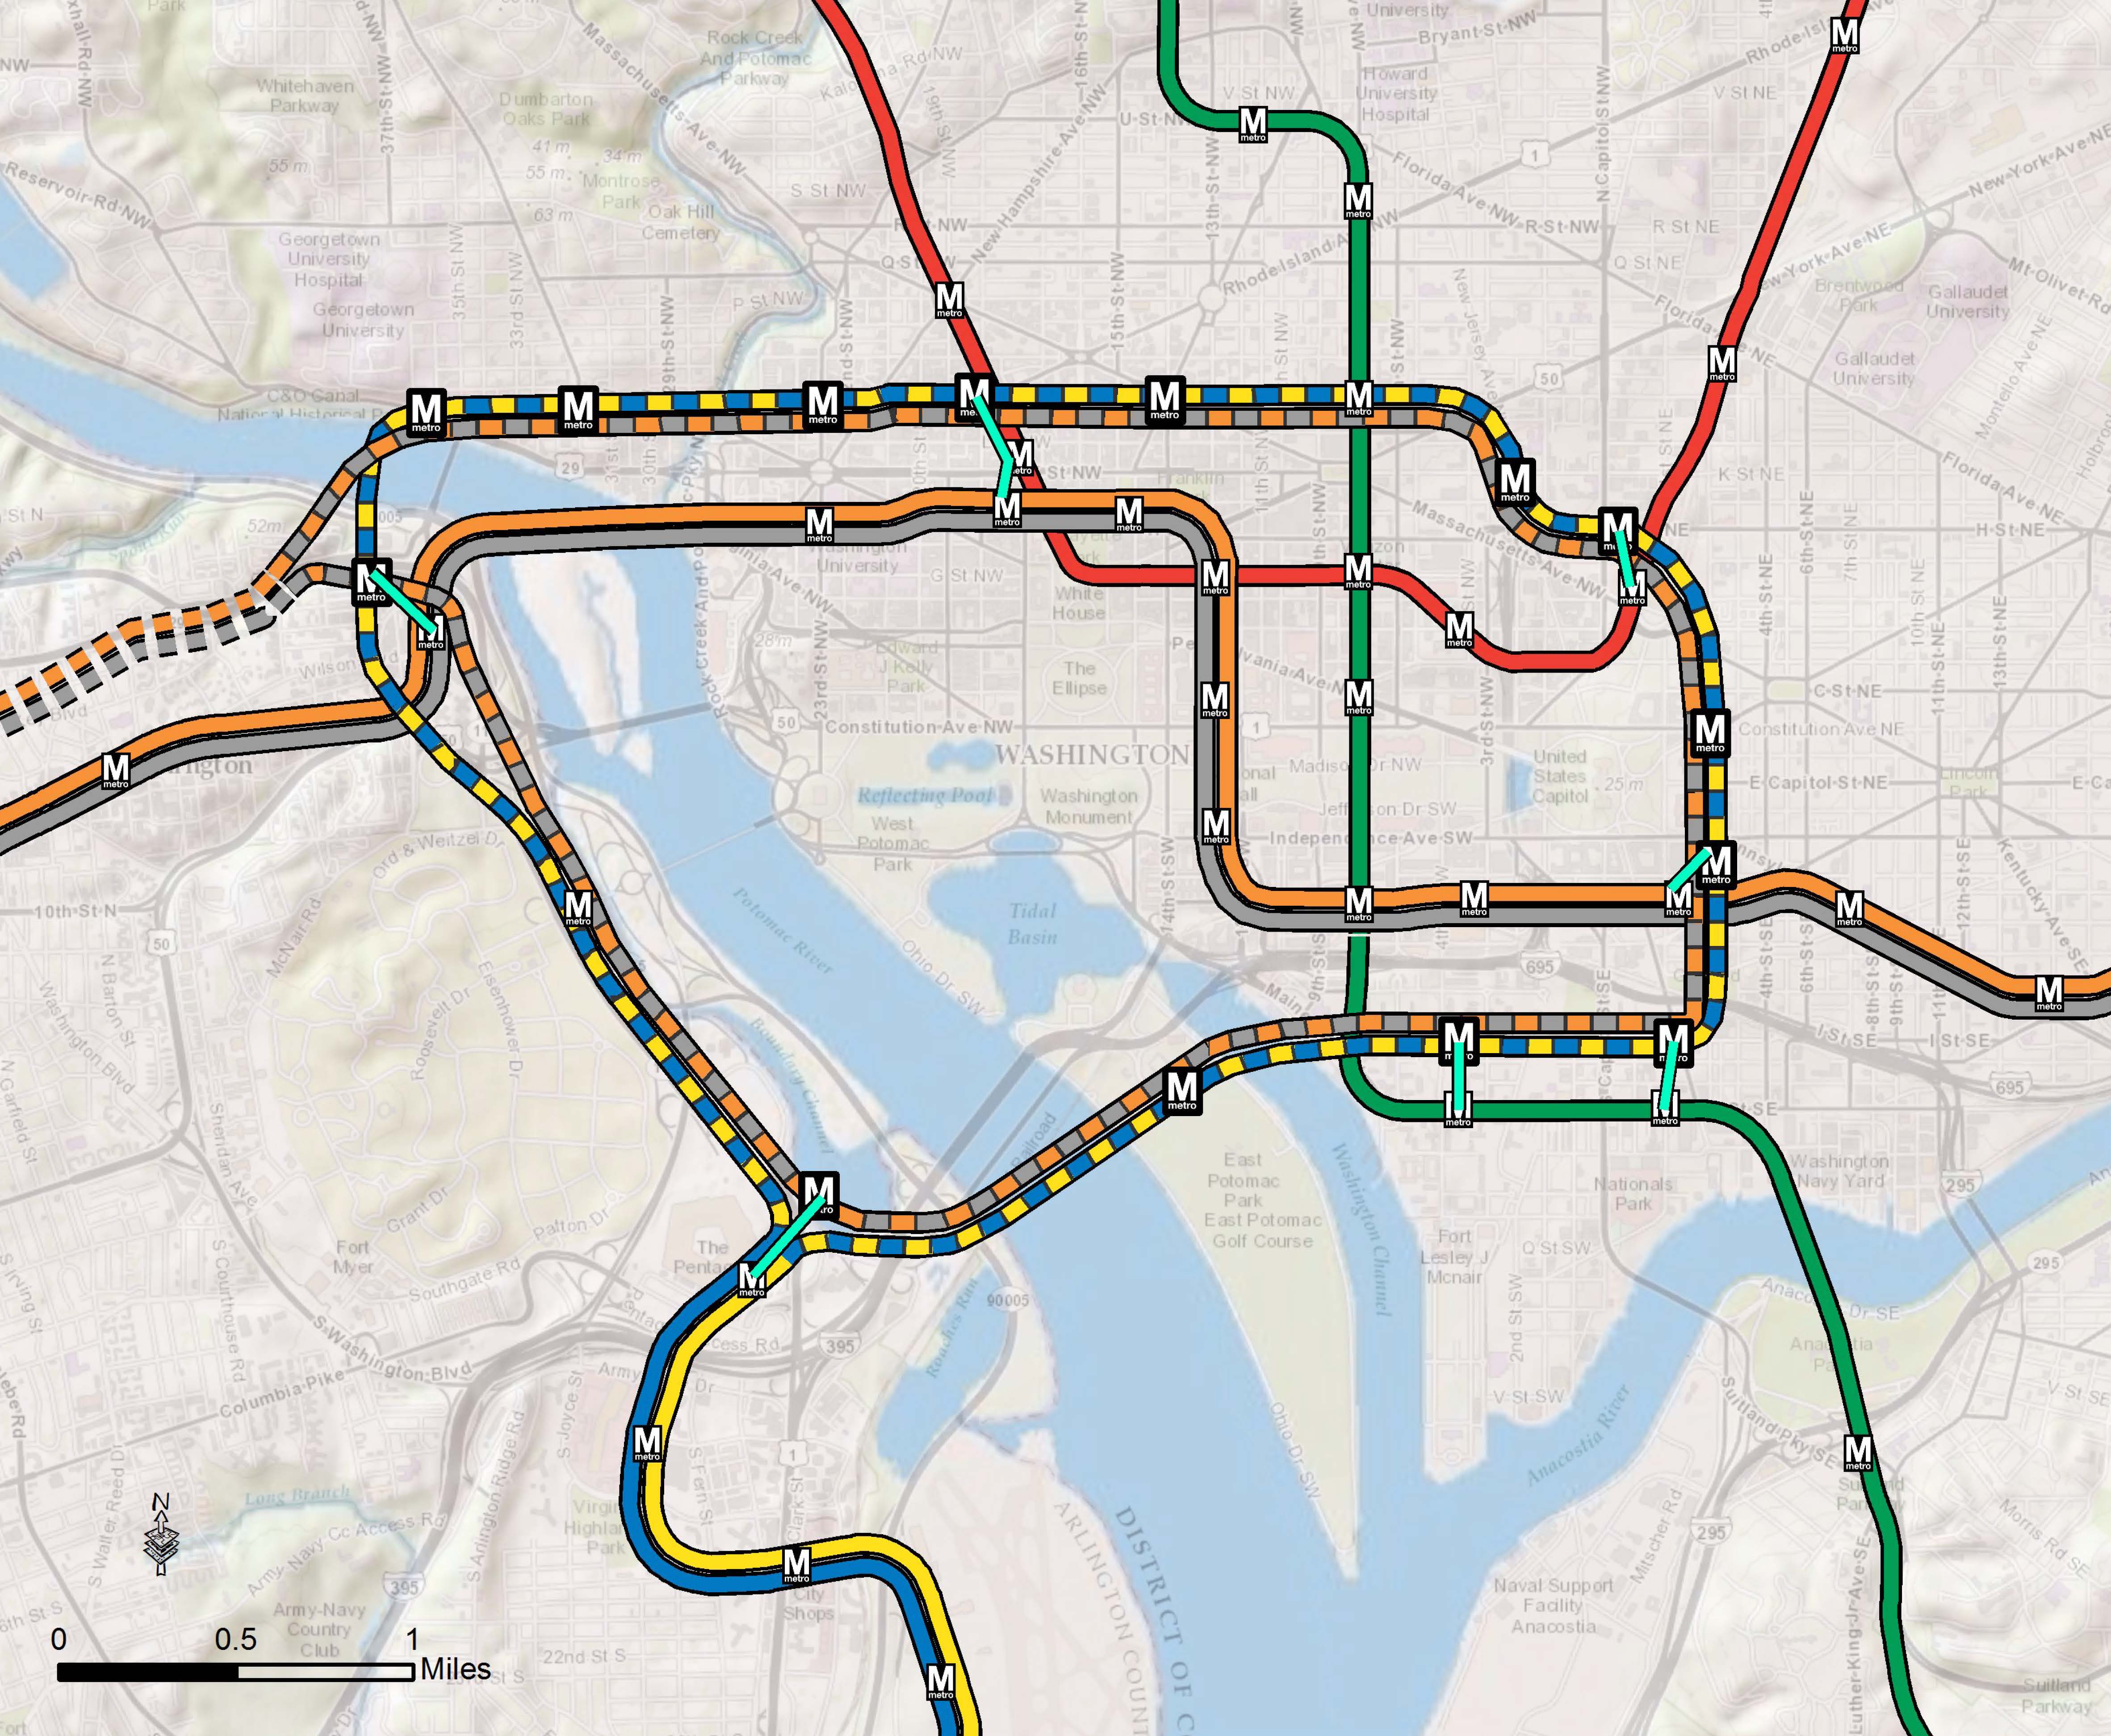
Step right up and check out the proposed 2040 core Metrorail configuration with new Blue and Yellow Lines and a third line in Virginia!
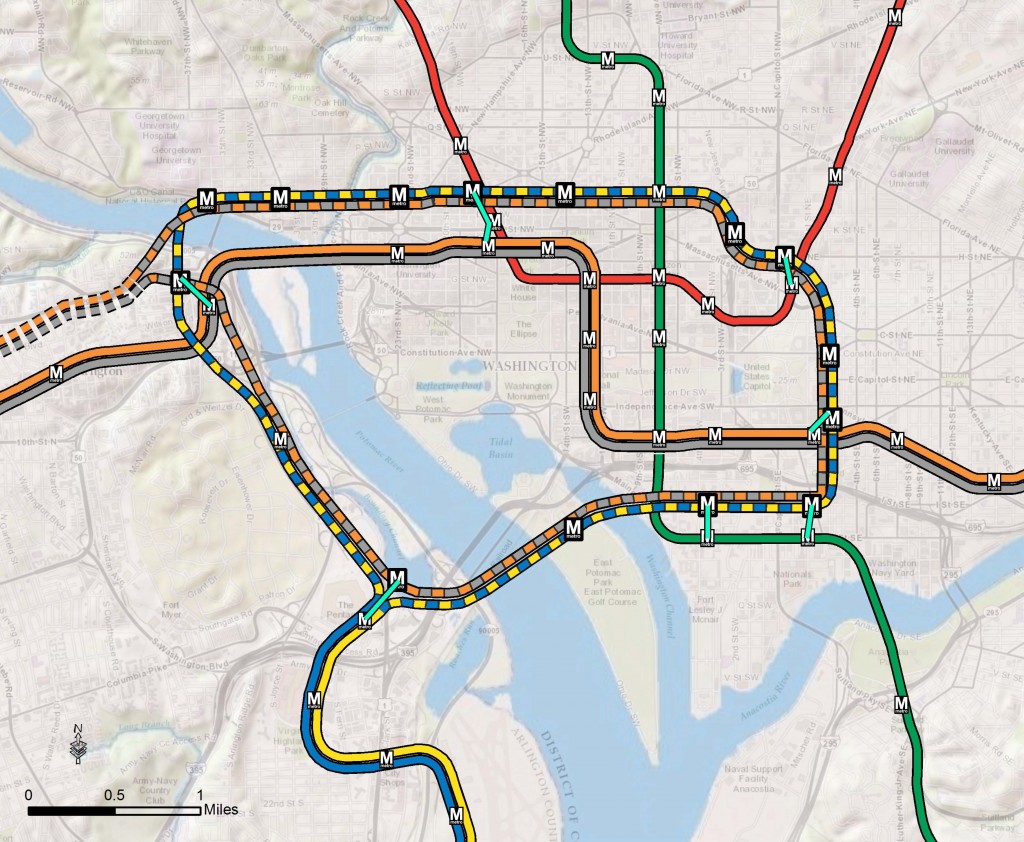
Proposed 2040 Metrorail Core Configuration
Proposed 2040 Metrorail Network
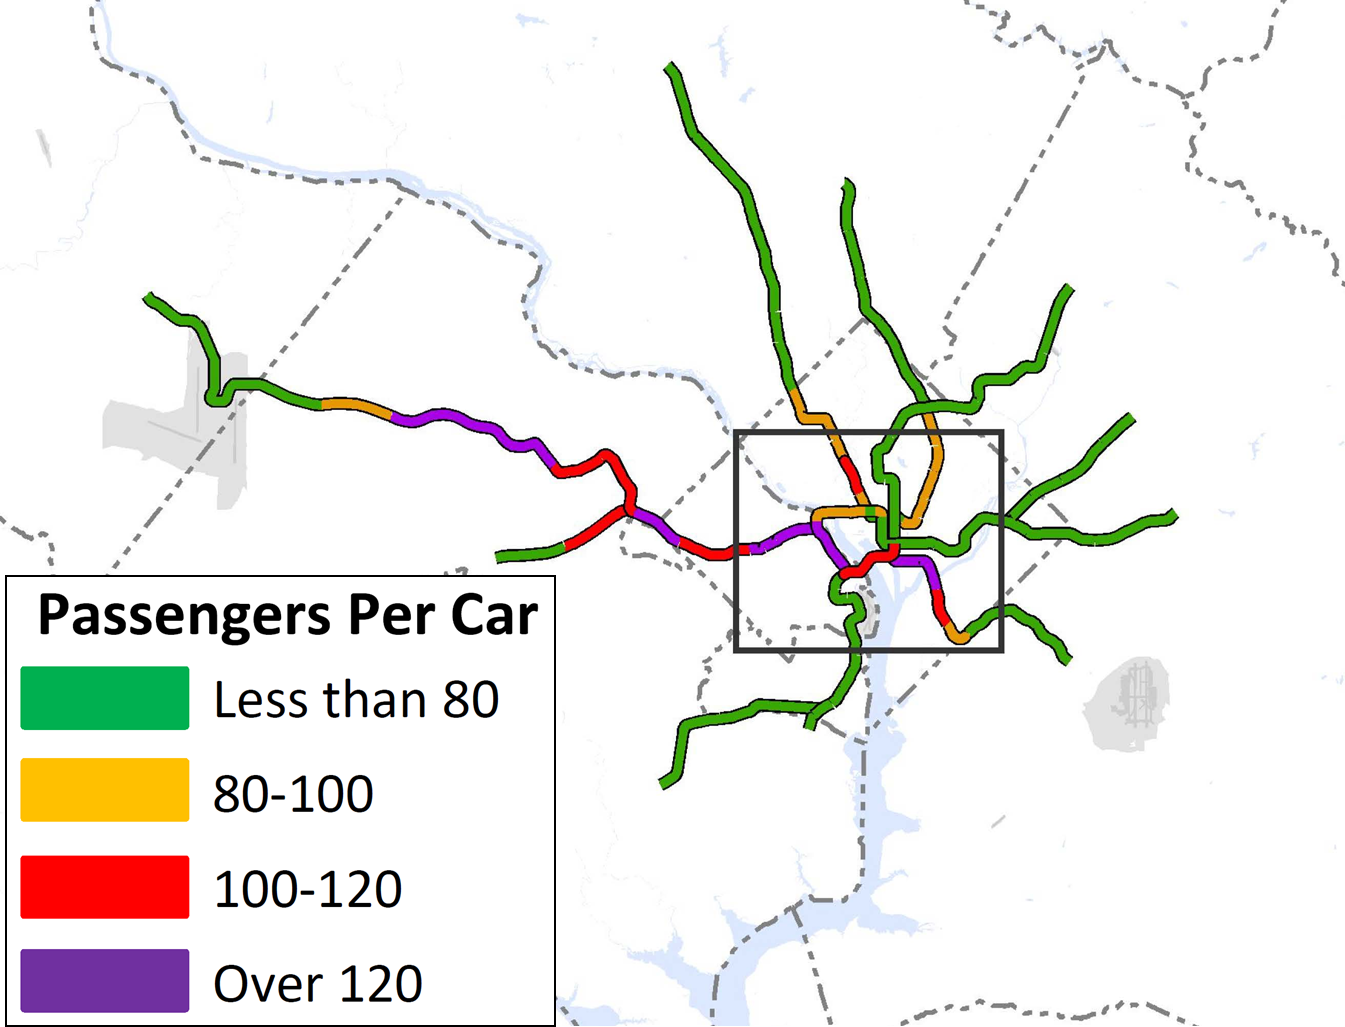
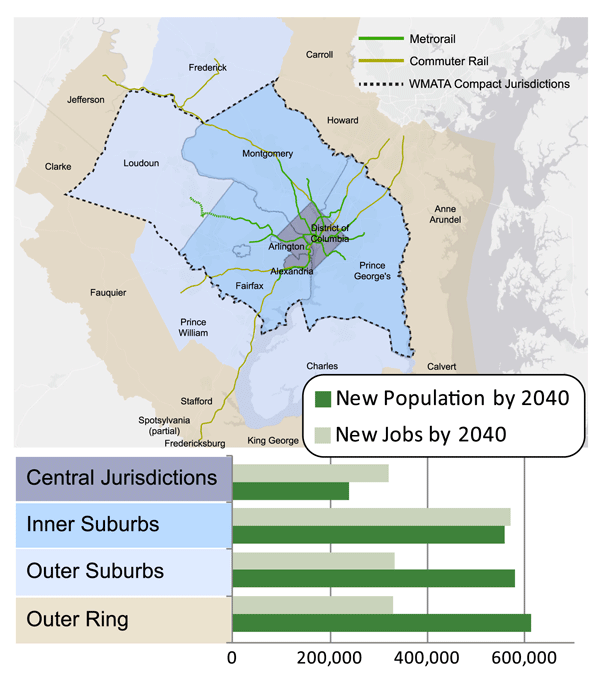
What does this network do? The proposed rail network shown above is expected to reduce future crowding on Metrorail, provide enough capacity for future development, and expand the reach of transit in the region, especially to regional activity centers.
Why are we proposing it? This rail network is part of the 2040 Regional Transit System Plan (RTSP). Its purpose is to develop the rail and surface transit network for 2040 that meets the needs of the growing Washington DC region.
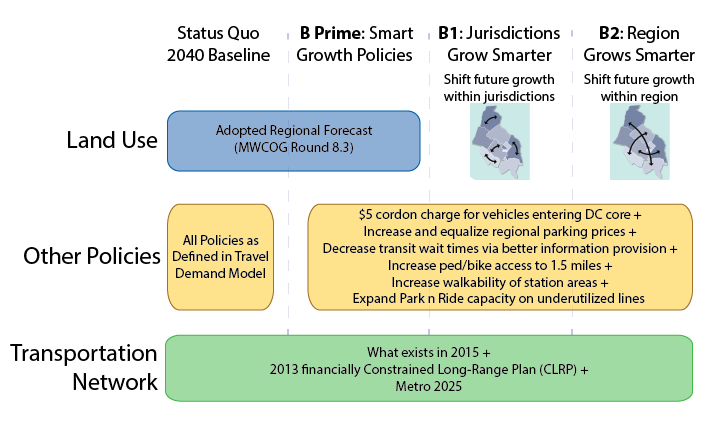
What else have we considered? About a month ago, we posted about some of the possible long-range changes to the Metrorail core that we are considering as part of the RTSP. We analyzed four different core configurations, gathered your comments, and the final configuration for the core is shown above. As many of you commented, it is a combination of two of the scenarios (Scenarios B and C).
Next Steps: The next and final step for the RTSP is to use this configuration, along with the high capacity surface corridors, to conduct a final round of analysis. The output will provide us with information on ridership, mode share, levels of crowding, transfers, etc. and ultimately a final network for 2040.
Let us know what you think!
A few extra notes:
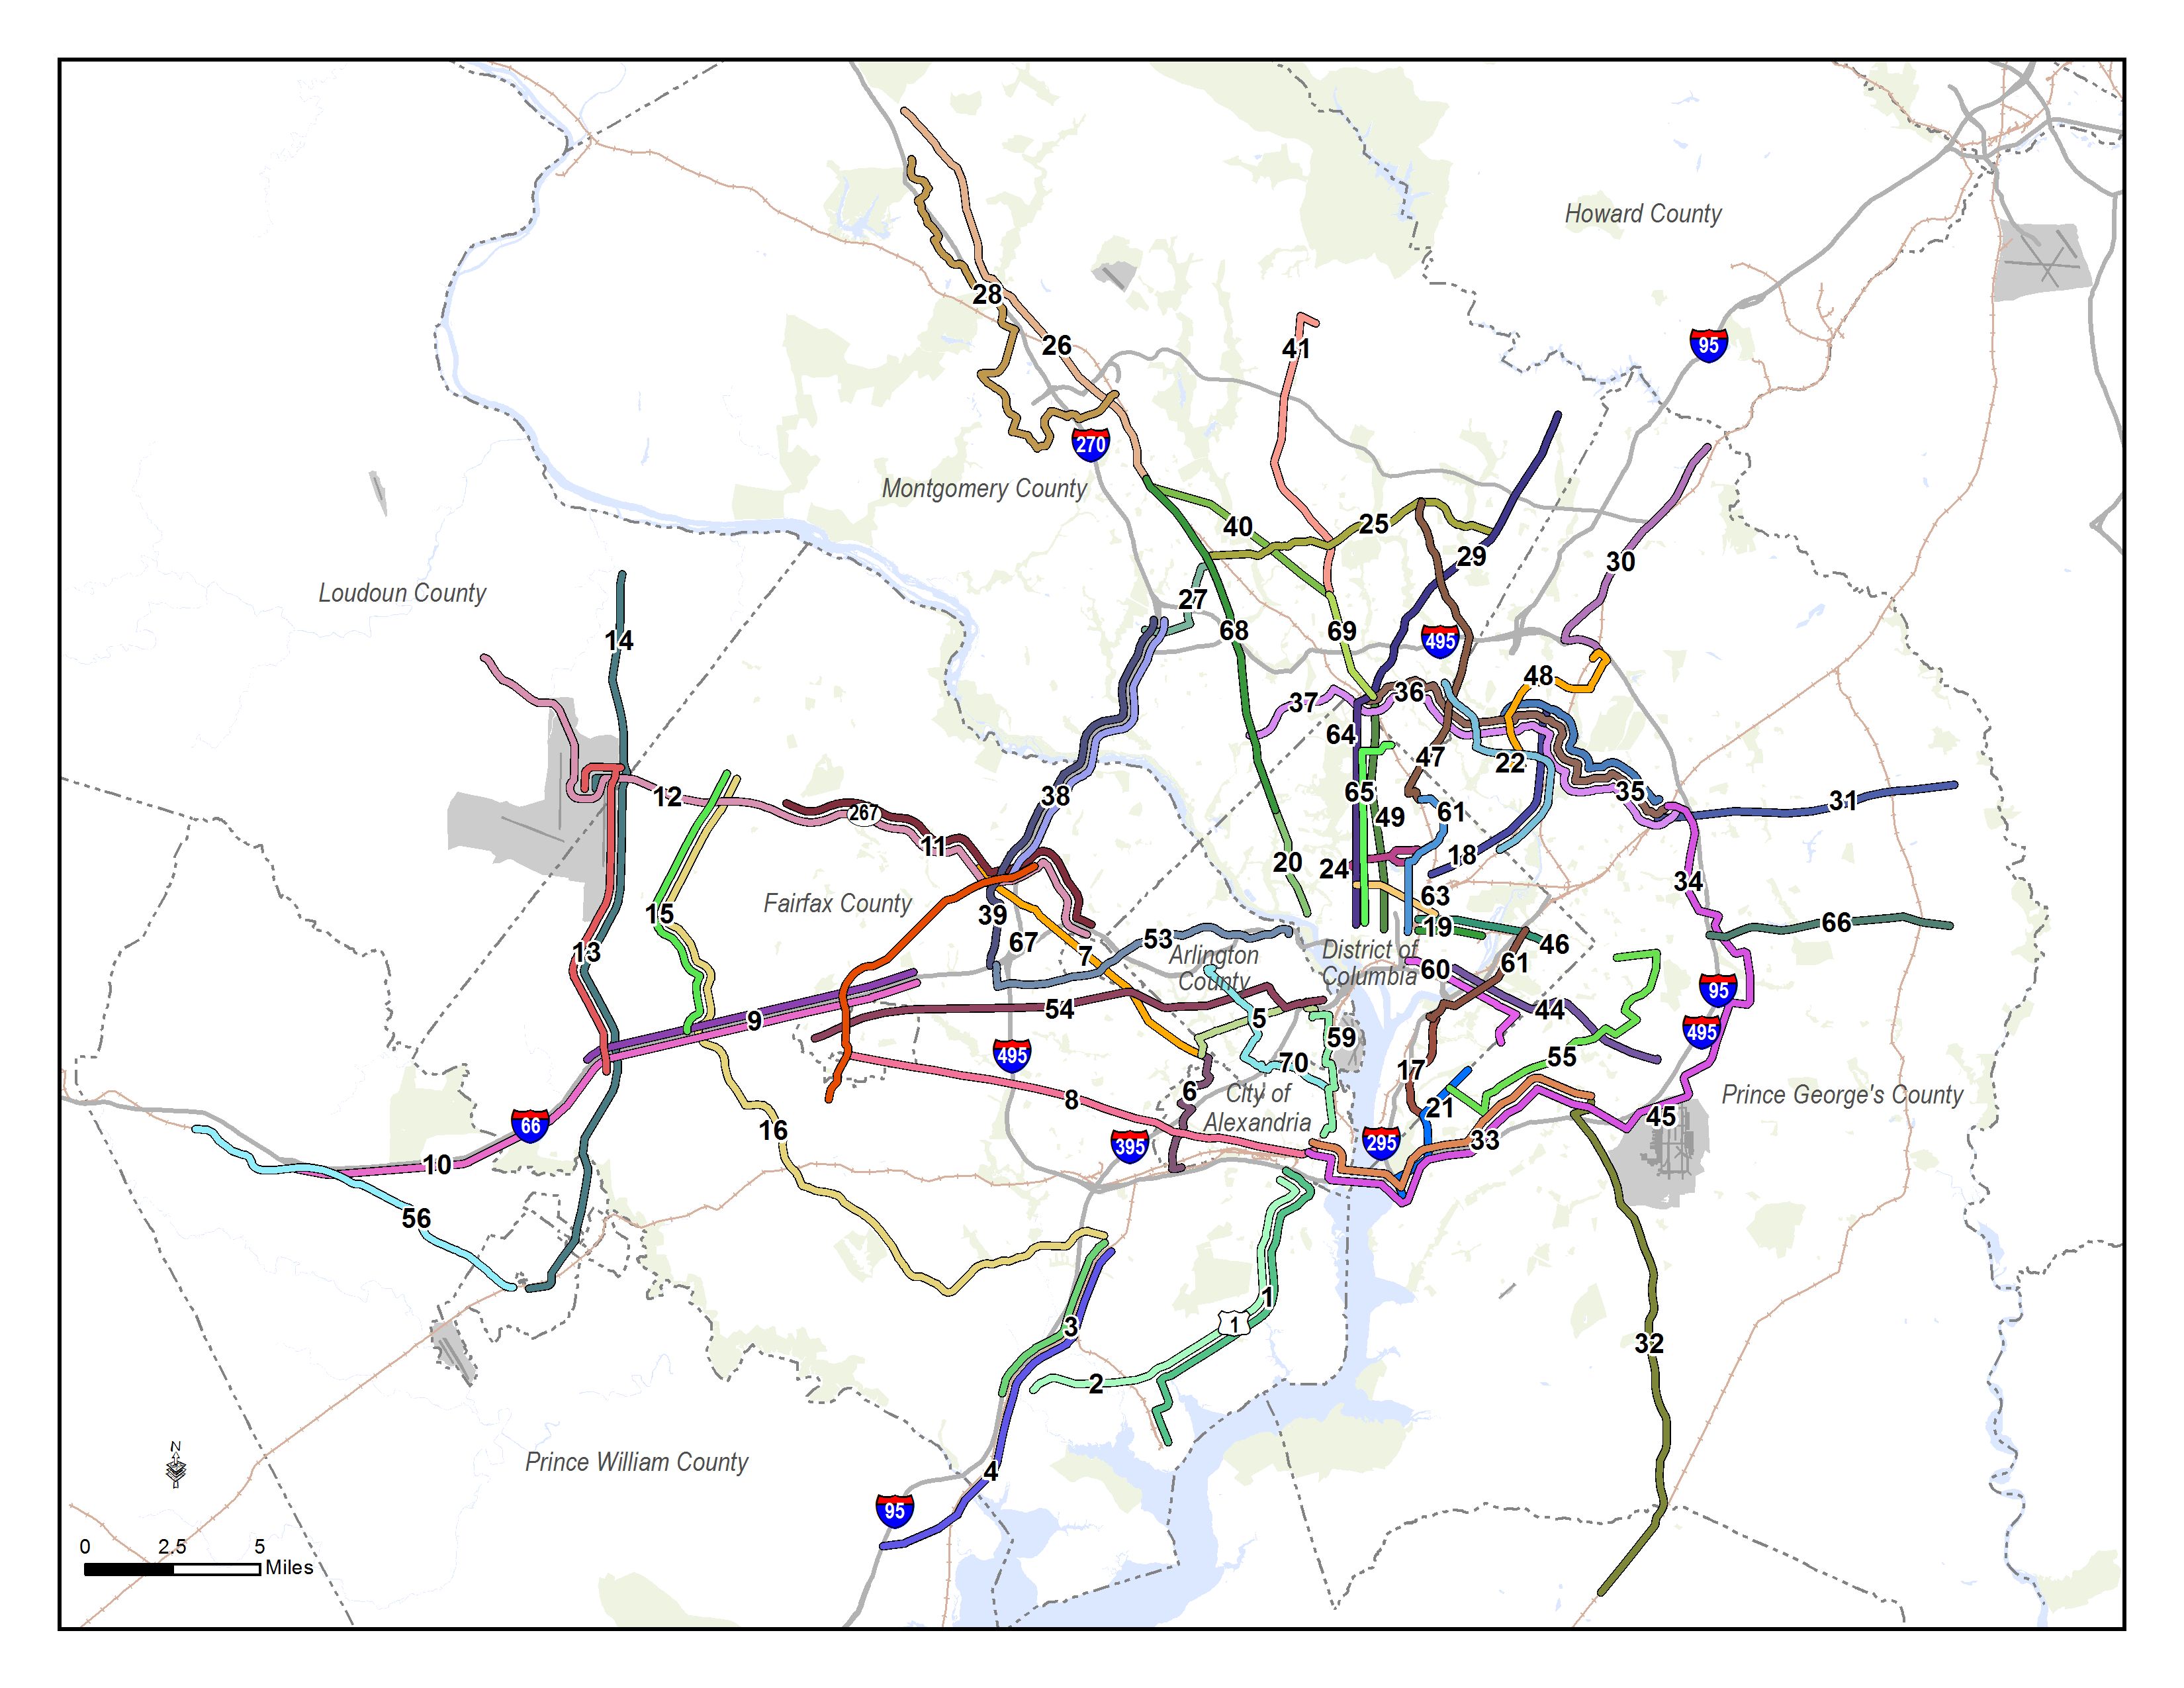
(1) The Metrorail network shown in this post will be layered with an extensive high capacity surface transit network to expand transit and meet the needs of employment and population growth in the region.
(2) For the plan to have validity and acceptability across the region and within the federal planning process, it is based on the region’s adopted cooperative land use forecast for 2040. We used the Aspirations Land Use scenario to stress test the core of the system, but ultimately the plan needs to start with the region’s adopted land use. As follow on work to this plan, we will be testing different land uses to see what else we can learn to improve long-range plans.
(3) All of the lines shown, as well as all of the high capacity surface transit corridors, will need corridor studies, alternatives analyses, and full engineering studies. This cannot be done at a regional level, but would need to happen on a project by project, line by line level. So, while we are showing a new Blue Line on M Street, it very well could be on N or P Streets.


 You’ve been diligently telling us what you think our priorities should be and we’ve listened. We’ve been hard at work putting the final touches on Momentum: The Next Generation of Metro and Metro’s Board endorsed the plan today.


Recent Comments