‘Metrorail Studies’

MetroRail – Designed for Performance

January 19th, 2017 Comments off

Though it has several key constraints, the Metrorail System’s capacity compares favorably with its peers and even out-performs them in several key measures.

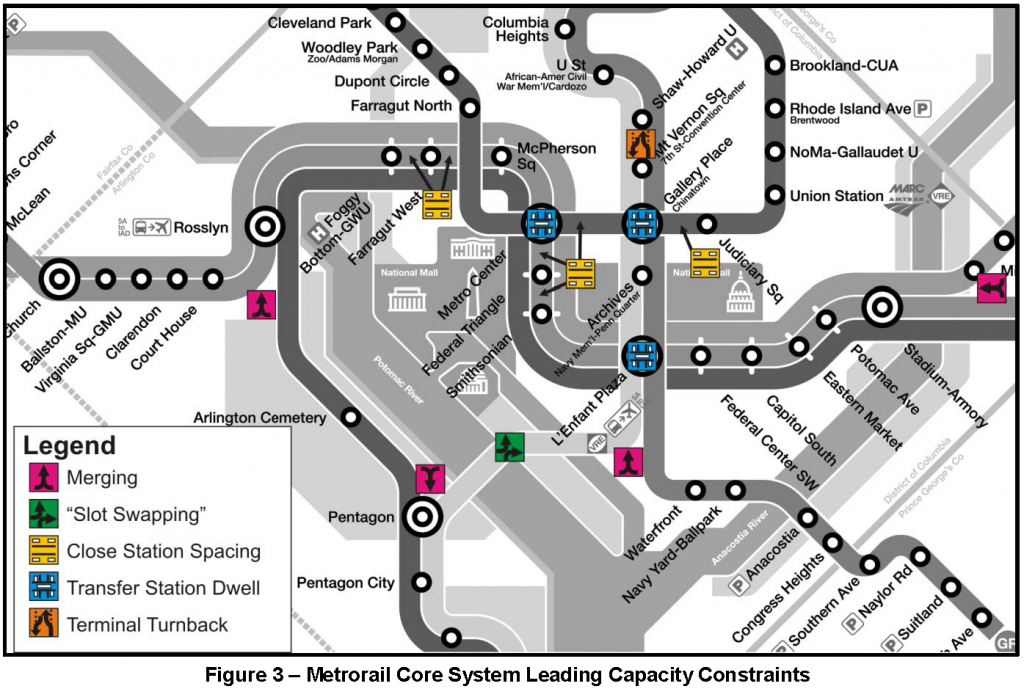
In a previous post, we explained that Metro doesn’t schedule more than 26 trains per hour at any point in an effort to balance reliability with high capacity operations. But it also raises some interesting questions: How does Metrorail’s capacity compare to peers? How does Metrorail compare to its peers in terms of train throughput and what are the specific constraints that prevent trains from operating more frequently? Are there any ways to increase the capacity of the existing system beyond 26 trains per hour?

We developed a white paper (PDF) to answer those questions. Some of the findings might surprise some Metroskeptics or armchair transit planners, but Metrorail has among the highest capacity infrastructure in the industry, which – when in a state of good repair – allow it to outperform its peers in a number of key areas.

core-constraint-graphic Read more…

Beyond Rush Hour – Taking a Peek at the Off-Peak

November 18th, 2015 3 comments

Metrorail ridership isn’t only about rush hour! Here’s a deeper look at why off-peak riders travel, and what segments are most traveled.

You may not be surprised that the peak period travel on Metrorail is dominated by commuting and business related trips.  Every day from opening to 9:30am, nearly 90 percent of passengers travel to work and business.  However do you know that over almost a third of daily ridership takes place in the off peak?  This post explores what is happening during weekday off-peak periods.

The weekday “off-peak” time typically refers to the weekday midday period (9:30am to 3:00pm) and the weekday evening period (from 7:00pm to closing), excluding late night service on Friday and Saturdays between midnight and 3:00am. In recent years, weekday off-peak travel demand has remained stable at 32 percent of the daily ridership, with the midday ridership at 19-20 percent and the evening ridership at 12 percent.

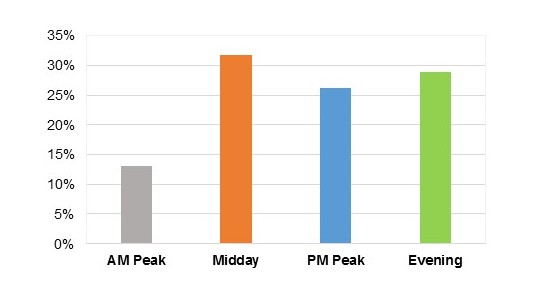
Most non-work trips, such as personal, recreational, and shopping trips, occur during the off-peak times and are spread fairly evenly between the midday and evening, as illustrated in Figure 1. 

blog figure

Figure 1: Percentage of Non-Work Trips by Time of Day (2012 Metrorail Passenger Survey)


The off-peak, non-work travel market has showed strong growth between 2007 and 2012 (our last two passenger surveys where we can distinguish between work and non-work travel). According to the Metrorail passenger surveys, off-peak non-work trips grew by 15 percent for the midday and evening from 2007 to 2012, higher than the 9 percent increase in the daily non-work trips. Read more…

Metro Studying Ways to Improve Bike/Ped Access to Stations

October 7th, 2015 Comments off

Improving walk and bike access is a cost effective way to increase ridership and improve the efficiency of the Metrorail network.   Where are these improvements needed and how should we (as a region) prioritize them?

Landover Walkshed

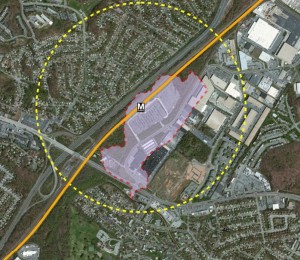
What projects might increase the size of the walk shed of the Landover Metrorail station?

In a number of earlier posts starting last summer, we’ve discussed the concept of walk sheds and explored the relationship between walkability, land use, and Metrorail ridership.  One conclusion of this effort:  grow the size of the walk shed and you’ll grow ridership.

Generally, we only have control over what happens on our own property.  While we have made great strides in identifying and prioritizing bike/ped access improvements on our own property, increasing the size of the walk sheds requires coordination with state or local agencies who own, plan, design and construct roads, sidewalks and pathways near our stations.  We know that in order to have a larger impact on walk and bike access, we need to cast a wider net and identify projects that are up to one mile from our station entrance.  We have created a plan — the Station Access Investment Strategy — to highlight some of these projects as priorities for our local partners to use as they develop their capital improvement plans. Read more…

Ask the Professors – How Local Land Use Decisions Impact Metrorail Ridership

August 24th, 2015 1 comment

This post is guest-written by Chao Liu, Hiro Iseki, and Gerrit Knaap, researchers from University of Maryland’s National Center for Smart Growth, who helped Metro develop our Land Use Ridership Model.

Even though Metro doesn’t control where new jobs and households locate in the region, these decisions are critical to the agency’s ridership and financial future. 

It is well known that the form and intensity of development in and near rail transit station areas can have measurable impacts on transit ridership.  For these reasons, transit oriented developments (TOD) generally feature high-density construction, mixed land uses, and bike and pedestrian friendly infrastructure.  But not all TODs are alike, and the effects of TOD on transit ridership are likely to depend on how well the station is connected both locally and regionally, whether the station is near the center or end of a transit corridor, and what kinds of jobs and household are located nearby.

To explore how different forms of development might impact ridership on the Washington Metrorail system, Dr. Hiroyuki Iseki and Dr. Chao Liu assisted Metro to develop a direct ridership model (DRM), called Metro’s Land Use Ridership Model.  A DRM uses statistical techniques to quantify the relationship between entries and exits at rail stations and land uses nearby.  This model can then be used to estimate the number of passengers who will access the station, by waking or biking, as a result of changes in land use features, transit service characteristics, and socio-demographics within the walkshed of any given station.

The direct ridership model includes a large number of variables for each station, including the density, diversity, and design of local environment; transit service and connectivity; job accessibility by auto and transit; walk score; the availability of parking; the demographics of nearby residents; the number and types of jobs nearby, and more.  The model was estimated for the AM Peak, Midday, PM Peak, and Evening travel periods.  The AM Peak model is best suited for estimating the increase in morning boardings that would result from locating more households near the station; the PM Peak model is best suited for estimating the increase in afternoon boardings that would result from locating more jobs near the station.
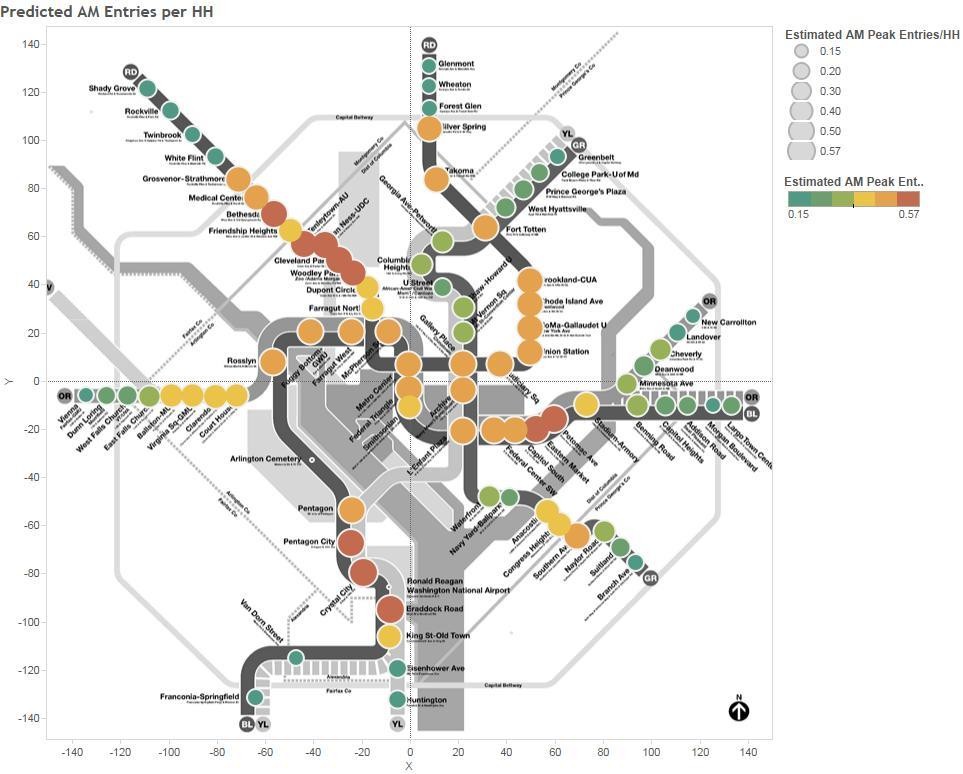
Pedicted AM Peak Entries per New HH

Map 1. Predicted AM Peak Entries per New Household

The impact of adding jobs and households near stations varies by station area.  Map 1 above, for example, shows the estimated entries per new household in the morning peak—that is, how many additional boardings would occur in the AM peak if one additional household was located in the walkshed of the station.  Stations shown by red dots gain more than 0.57 boardings per day, for each new household in the walk shed, while stations shown with green dots gain only about 0.20 boardings per day. As a concrete example, Rhode Island Row is a 274-unit, mixed-use, TOD project built on a WMATA site.  Situated along the busy Red Line, the project has long been considered as a prime location for new housing development.  According to the DRM model, adding 274 new households near the Rhode Island station would increase boardings by 144 passengers in the AM peak.  The same development at the New Carrollton station, however, would have added only 52 passengers.  This is because, compared to New Carrollton, the Rhode Island Avenue station has better job accessibility and more frequent transit service, and is thus likely to stimulate more transit ridership. Read more…

A Half-Mile Walk to the Nearest Metrorail Station, Mapped

August 4th, 2014 21 comments

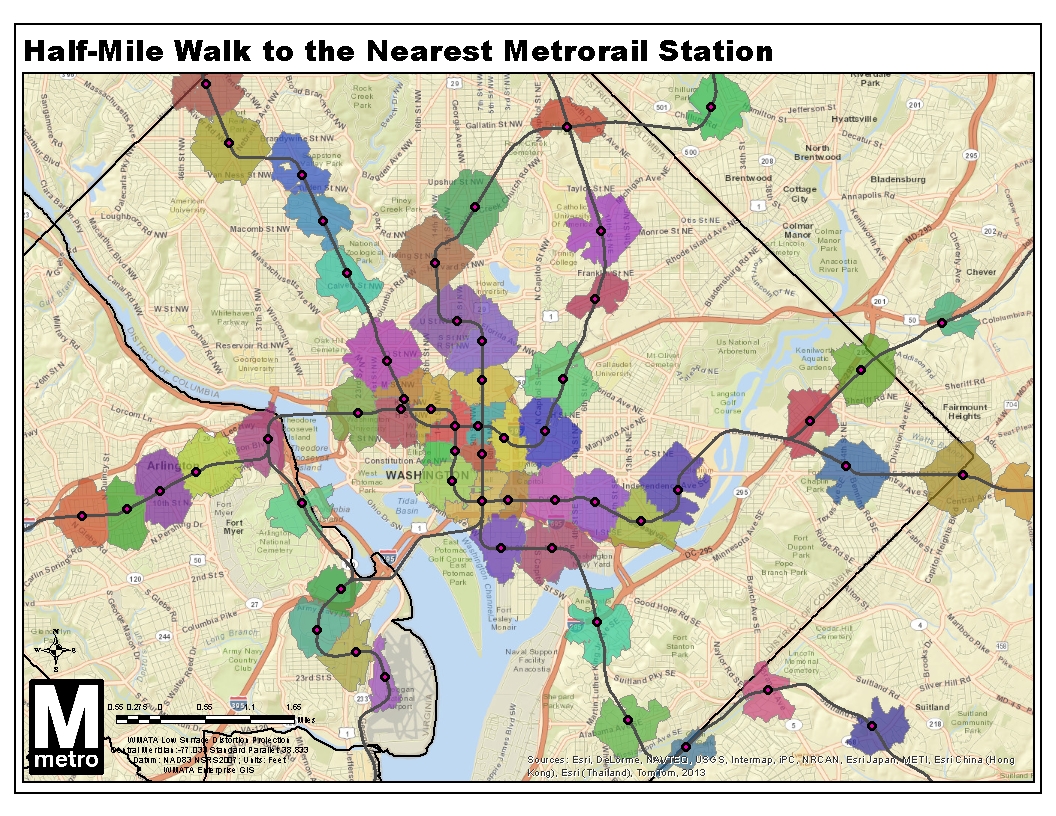
Here’s a map showing the walkable area around the nearest Metrorail station.

eGISBaseLTR_RailPedSheds NonOverlap

Did you ever wonder which Metrorail station is closest? Where’s the breakeven point between two stations? This map shows the areas you can actually reach within a half-mile walk along the roadway network, as we described previously. The twist this time is that I disallowed “overlap” within the GIS network analysis, so land is allotted to the closest station only, calculated by network walk distance.

What do you see in this map?  Here’s a regional view with all stations, as well.

Update 9/2/2014: the GIS source file for this map is now available for download, in geodatabase (.gdb) format.

Study Recommends New Mezzanine to Connect Red/Purple at Silver Spring

July 10th, 2014 3 comments

To handle future ridership demand, Silver Spring may need a new mezzanine to connect Metrorail to the planned Purple Line light rail station.

Last year, we began a study looking at potential station capacity issues at Silver Spring.  The assessment determined that the demand at the Silver Spring Metrorail station (entries and exits) is adequately served by the existing station infrastructure.   Since then, the study has assessed the future conditions that will be impacted both by ridership growth due to growth of jobs and households in the station area, but also the arrival of the Purple Line light rail to Silver Spring.

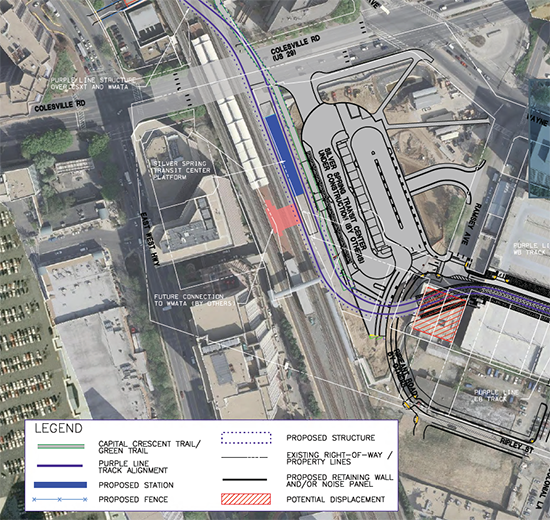
Purple Line station and potential Metrorail connection at Silver Spring.  Source, purplelinemd.com, PDF.

Purple Line station and potential Metrorail connection at Silver Spring. Source, purplelinemd.com, PDF.

The Purple Line station at Silver Spring is planned as an elevated platform and mezzanine, with the mezzanine connecting to the top floor of Silver Spring Transit Center, Metropolitan Branch Trail, and  Ripley Street to the south.   The elevated light rail platform will be approximately 80 feet above the street, about the height of the current MARC pedestrian bridge.  The MTA design team envisioned a possible direct connection between Metrorail and the Purple Line, as illustrated in the red shape in the center of the above image.  Without such a connection, riders transferring between Metrorail and the Purple Line at Silver Spring would have to descend those 80 feet to the ground level, enter an existing Metrorail mezzanine, and then ascend again to the Red Line platform. Read more…

New Blue Line Connections Revisited

July 3rd, 2014 25 comments

A recent Metro study determined that a Rosslyn bypass is infeasible but a second Metrorail station in Rosslyn to restore frequent peak period Blue Line service is possible.

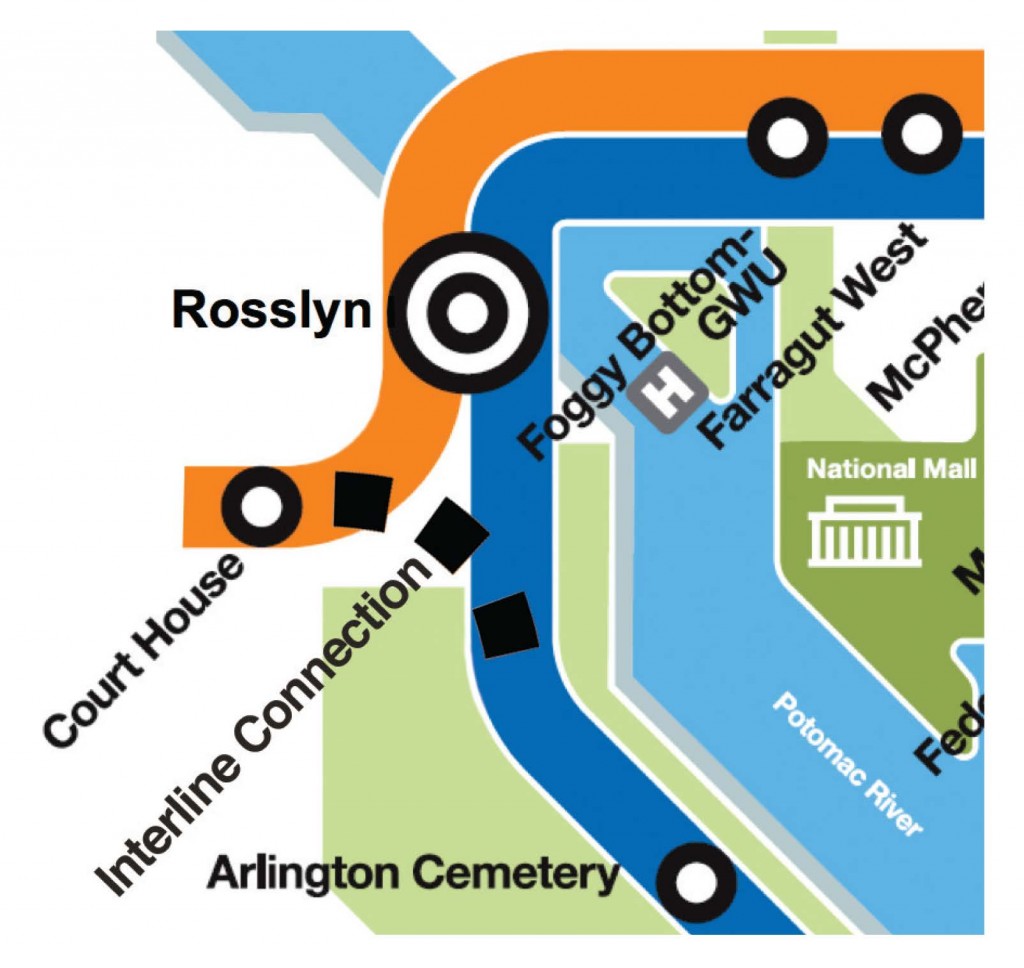
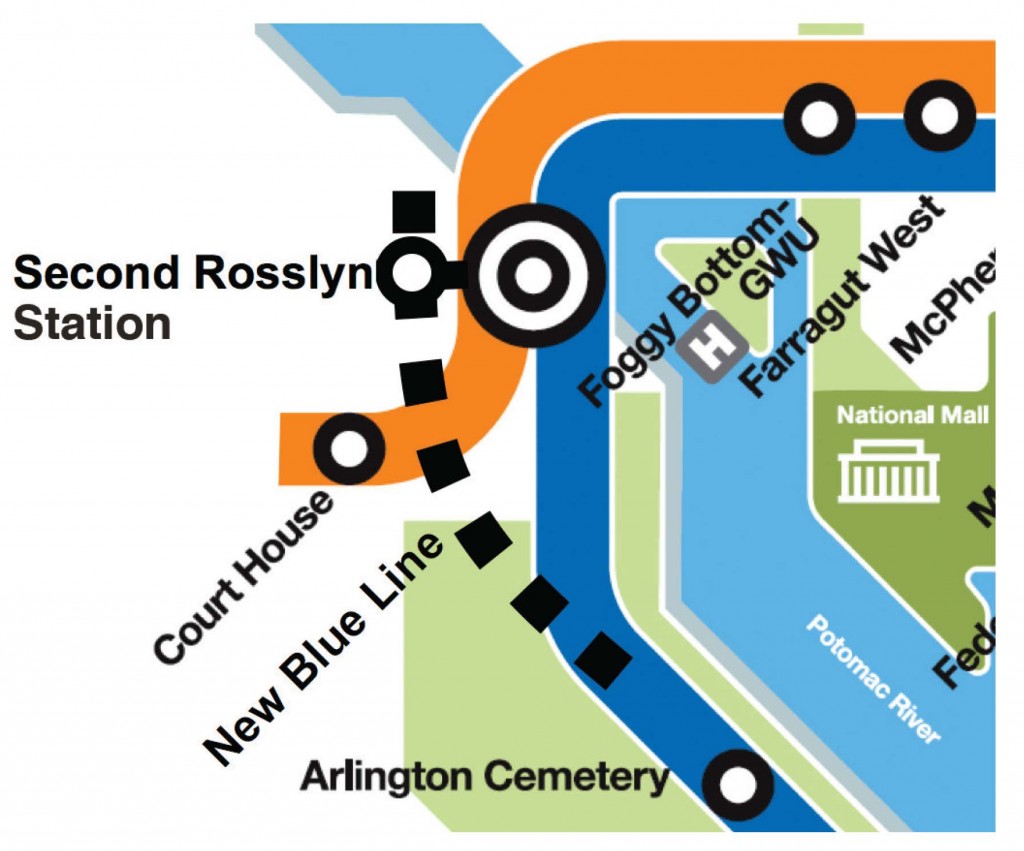
In a post last year describing the strategies in Metro 2025, we described some options for new Blue Line connections.  The first was a Rosslyn bypass that would allow some Blue Line trains to connect directly to the Orange Line at Court House.  The second was a second Rosslyn station that would connect to the current Rosslyn station via an underground walkway.  Both of these options, illustrated in the graphics below, would allow increased frequencies on the Blue Line during peak periods.

Graphic for Rosslyn Interline ConnectionGraphic for Second Rosslyn Station

Metro recently completed a study that evaluated these two options (pdf).  The bad news is that the Rosslyn bypass (interline connection) was deemed infeasible.  This is due to the location of building foundations and the turning radius required by the track.

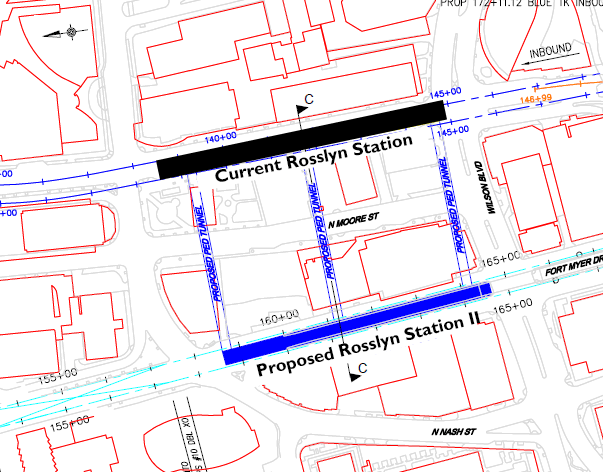
However, the second Rosslyn station was deemed feasible, as illustrated in the map below.

second_rosslyn

Location for a proposed second Rosslyn Station, including three potential options for a pedestrian walkway.

This new Metrorail station would connect to the current Rosslyn station via one underground walkway.

Metro Office of Planning is submitting the second Rosslyn station for project development funding.


Where Are Low-Income and Minority Metrorail Riders?

October 9th, 2013 5 comments

The demographics of Metrorail riders change dramatically station to station, and reflect the race and income divisions of our region.

As part of Metro’s Title VI program, we spend time making sure we don’t disproportionately impact low-income and minority riders when we change and deliver service, change fares, and other policy changes. Our 2012 Metrorail Passenger Survey tells us a good deal of information about the race and income ranges of our riders, by where they are going, and when they travel.  We conduct this research ourselves, giving us an extremely robust dataset on our riders. These survey responses are a key source of data underlying our Title VI analyses. In many ways, these results confirm that our region remains a Region Divided by income and race – across a noticeable east-west divide.

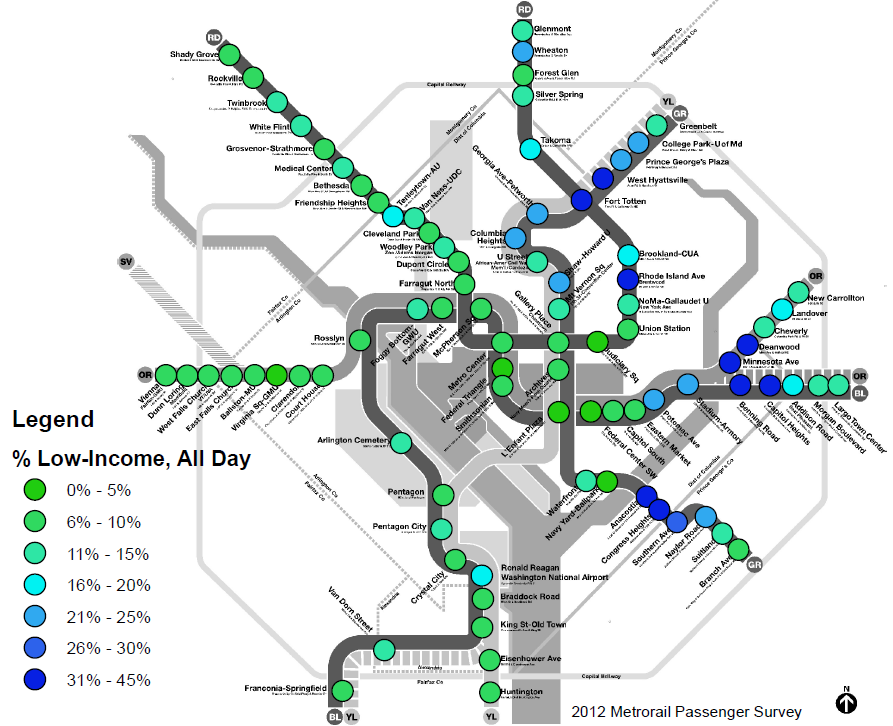
The map below shows low-income Metrorail riders by origin station, for a typical weekday in May 2012. Metro defines low-income as a rider with a household income less than $30,000 per year. Low-income ridership is somewhat concentrated in several areas, such as the inner southeast Green Line, and inner stations on the eastern Blue and Orange lines. The Green Line between Prince George’s Plaza and Shaw-Howard is also home to relatively large proportions of low-income riders.

No single station is more than 45% low-income.

hghg

Average Metrorail ridership is 11% low-income, but can range from 3% to 40% station to station.

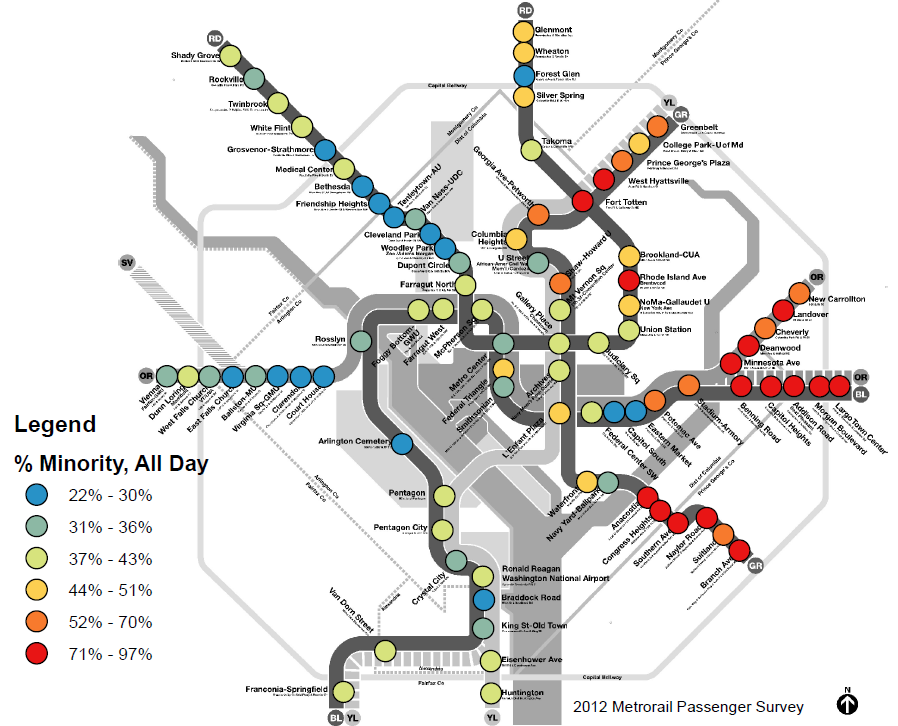
The next map shows minority Metrorail ridership by origin station, again for a weekday in May 2012. For Title VI purposes, a minority is defined as anyone who self-identifies as other than White, Non-Hispanic on our passenger survey. Minority ridership is concentrated most heavily on the eastern side of the rail network, but is also spread across other areas of the network as well – e.g., Wheaton and Glenmont, the Green-Yellow line. No single station is less than 22% minority.

Average Metrorail ridership is 42% minority, but the rail system shows an east-west divide, similar to the divisions facing our region. Some stations are over 90% minority ridership, while others are as low as 22%.

Average Metrorail ridership is 42% minority, but the rail system shows an east-west divide, similar to the divisions facing our region. Some stations are over 90% minority ridership, while others are as low as 22%.

We remain mindful of the travel patterns of low-income and minority riders, and use this data to help avoid disproportionate impacts to these riders when we make changes to the system. For example, we analyzed the impacts of the Silver Line at the passenger-trip level, looking at impacts and demographics at the individual origin-destination (O-D) pair level.

What patterns do you see here? Does anything jump out at you?

Categories: Metrorail Studies Tags:

Silver Spring Capacity Analysis Study Under Way

September 6th, 2013 Comments off

Metro is addresses crowding, integration of Purple Line in new Silver Spring Capacity Analysis.

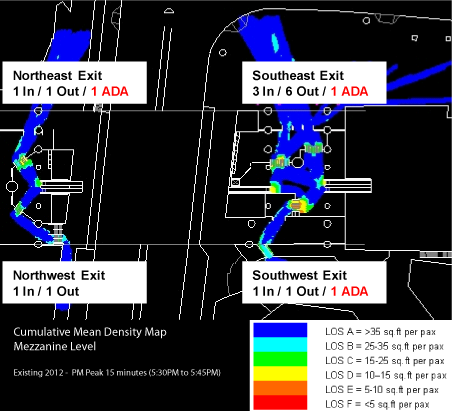
Metro staff have recently kicked off a capacity analysis of the Silver Spring station. The purpose of this study is to evaluate how well the station is functioning currently in terms of access and egress, vertical circulation, and faregate crowding. The study is also looking at how to accommodate growth in demand due to the opening of the Purple Line as well as increasing job and household density in Silver Spring and the region between now and 2030.

queuing heat map

The current conditions assessment is nearly complete, and shows that the station is performing well under normal conditions.  The graphic above is a cumulative mean density map, illustrating the average amount of “elbow room” each passenger has during the peak 15 minutes.  It shows that the current configuration of faregates at the two mezzanines (north is to the upper left corner) is adequate to service PM peak period demand, with only a little crowding (orange) near some faregates.

This post focuses on the PM peak period because Silver Spring has more station exits in the PM peak than the AM peak:  exiting passengers all disembark the train at the same time, which can cause queues to form at escalators and faregates.  Passengers entering the station, however, tend to trickle in and don’t put as much of a strain on station facilities.   These passengers can crowd the platform waiting areas, which will also be evaluated under this study.

Read more…

L’Enfant Plaza Station Capacity Improvements Study

December 6th, 2012 Comments off

The L’Enfant Plaza Station is one of busiest stations in the Metrorail system and handles thousands of passenger transfers on four of the five Metrorail lines.  It ranks third among all stations in absolute ridership growth over the last five years.

Earlier this year, Metro initiated a station capacity improvements study, similar to previous studies that evaluated the feasibility of station access and capacity improvements and station circulation enhancements at Gallery Pl-Chinatown and Union Stations.  The purpose of this study is to identify and address the physical and operational internal capacity constraints of L’Enfant Plaza Station.  Both short-term and long-term capacity enhancement solutions will be sought with operational improvements and constructability in mind.

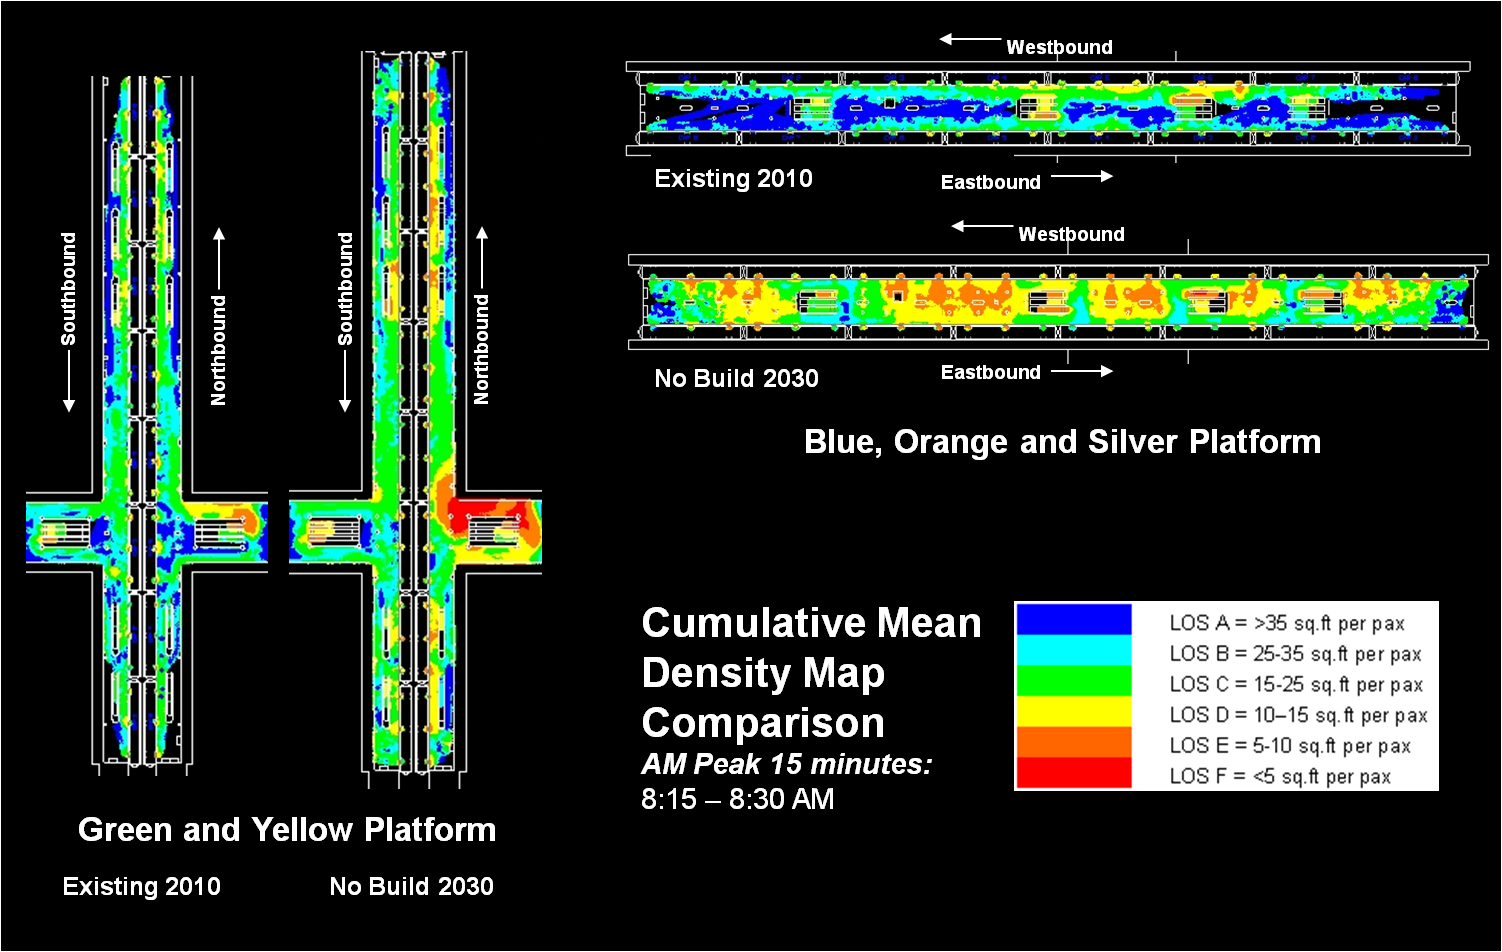
Current and Future “Hot-Spots” at L’Enfant Plaza Station Platforms during the AM Peak

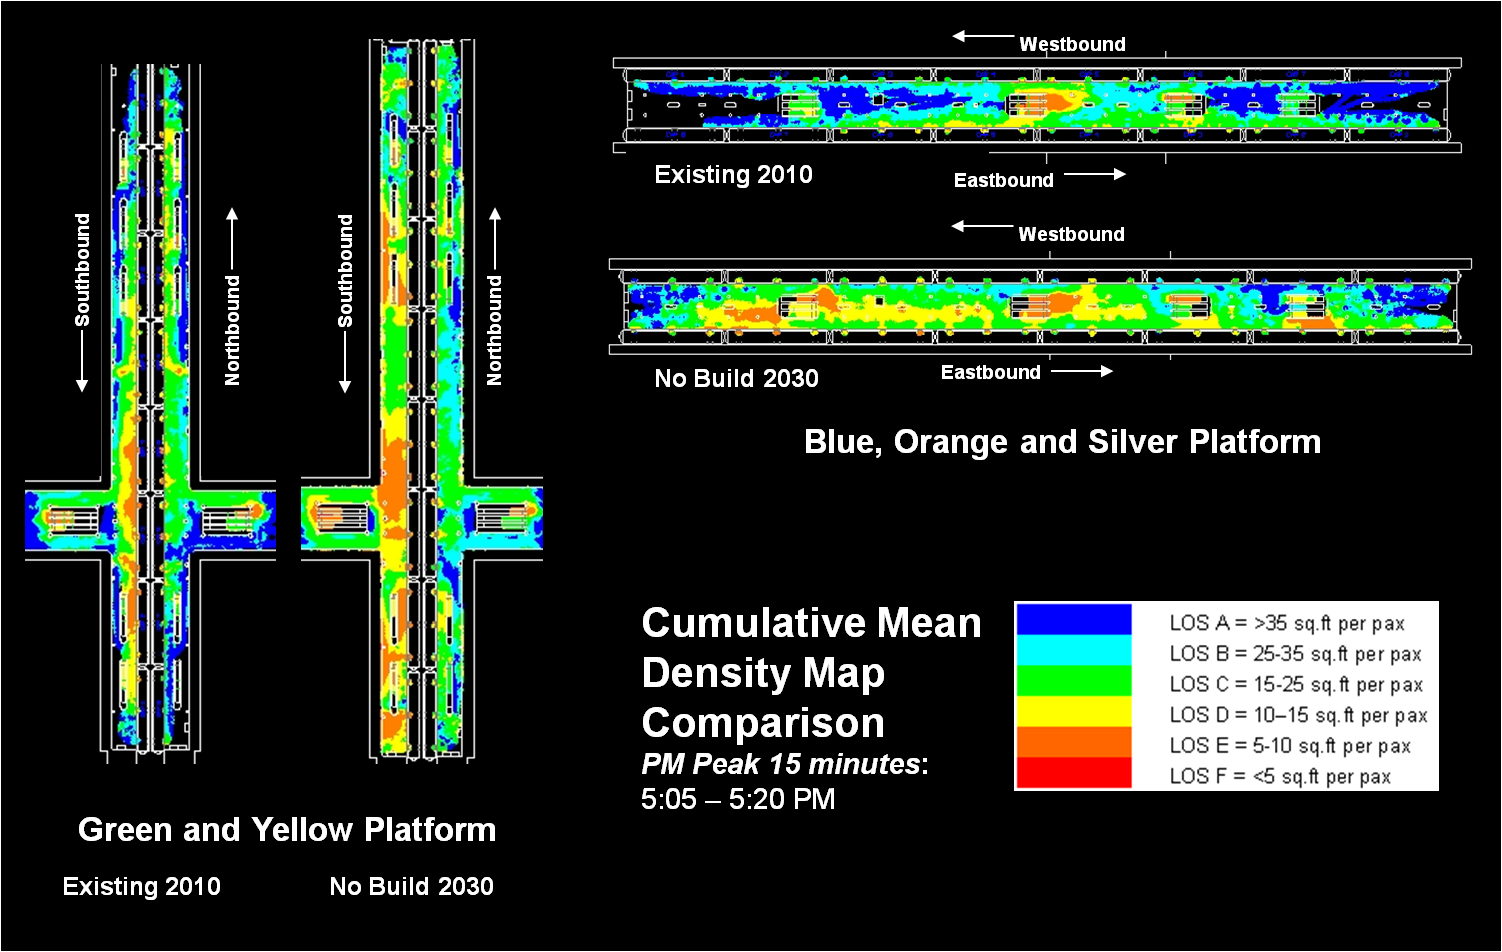
In order to assess the current and future conditions within L’Enfant station, Metro has used a pedestrian simulation tool that enables the quantification of crowded conditions.  The maps included here show existing and future condition profiles of the upper and lower level platforms within the station.  Future conditions were estimated using MWCOG/TPB travel demand model, Metrorail ridership growth forecasts and Metro origin-destination data sources.  Cumulative mean density maps help to identify “hot-spots” within the station – areas where high levels of crowding are sustained.

Analysis of current pedestrian activity during the AM peak 15-minute interval showed that the station currently operates at safe levels on both platforms in the morning peak hour, and identified a large volume of transfers between the northbound upper platform where Green and Yellow lines run and the westbound lower platform where Orange and Blue lines operate.   By year 2030, however, these conditions are expected to worsen with growth of transfers.  The levels of crowding in the transfer areas leading to the lower platform intensify due to increased passenger flows and space restrictions adjacent to escalators.  Also, high passenger densities are shown to occur at the westbound Orange and Blue platform during the morning rush hours.

A reversed pattern of crowding is shown between the eastbound lower platform and the southbound upper platform for the returning passengers during the PM peak 15-minute interval.  As expected, conditions worsen with increased passenger flows and transfer activity forecast for 2030 on the southbound upper platform.

Current and Future “Hot-Spots” at L’Enfant Plaza Station Platforms during the PM Peak

Given the existing and future “no-build” scenarios presented here, Metro is currently working to develop short and long-term design alternatives for detailed evaluation.  Stay posted for additional simulation and conceptual design results as they become available.