
ConnectGreaterWashington - a Vision for a Responsible and Prosperous Future (Part 2)
Investing in the region’s activity centers that have high-capacity, high-frequency transit and enhancing them as proposed in the Place+Opportunity report is part and parcel to preserving the economic competitiveness of the region AND creating a financially-sustainable Metrorail system.
(This post is part of a multi-part series about ![]() ConnectGreaterWashington and the study’s application of land use as a transportation strategy. Part one of the series discussed why Metro cares about land use and the potential benefits of assessing growth from a regional perspective. Part two below outlines the study’s goals, assumptions, and approach.)
ConnectGreaterWashington and the study’s application of land use as a transportation strategy. Part one of the series discussed why Metro cares about land use and the potential benefits of assessing growth from a regional perspective. Part two below outlines the study’s goals, assumptions, and approach.)
WMATA planners posited that changes to local jurisdictions’ and/or the region’s approach to land use and other policies would enable better use of the transportation system this region already built rather than require it to spend billions on new projects. Money is not falling from trees to expand transit — the region hasn’t even agreed to fund enough rail cars to run all eight car trains! So, if the region can’t (or won’t) invest in transit to keep up with growth, then we need to carefully evaluate how the growth we are forecasting can use the infrastructure we already have. Can the region’s growth, rather than necessitate billions of dollars in new infrastructure, be thoughtfully planned to better utilize the roadway and transit systems we already have? What would that mean to the region, its finances, and to Metro’s operating subsidies that its funding partners pay annually?
We developed an Executive Summary (pdf) that summarizes our approach and findings. These posts are infinitely more detailed, but you can certainly glean the key points from the Executive Summary.
The Basics
First and foremost, this study did not seek to develop an optimal land use or in any way socially engineer where future population and jobs should go. These are “what if” scenarios to provide context, data, and information to citizens, decision makers, and elected officials as the region grapples with future job and population growth, demand for transit, and development of walkable communities. This study sought to consider where future growth could go, and worked only with the regional growth anticipated to exist in this region in forecasts from 2020 through 2040. The modeling left existing jobs and population exactly where they exist today and was mindful that anything already in the development pipeline was far enough along to be assumed as “in place”.
Second, we followed the place types defined in Place+Opportunity as they were identified, developed, and defined by local jurisdictional planning staff and the Metropolitan Washington Council of Governments (MWCOG). Why? Because we wanted this study to be as realistic as possible and remain true to the nature of the activity centers and the jurisdictions that informed their types and densities. Additionally, Place+Opportunity was completed recently (2014) and had significant support and direct input from the jurisdictions and the region.
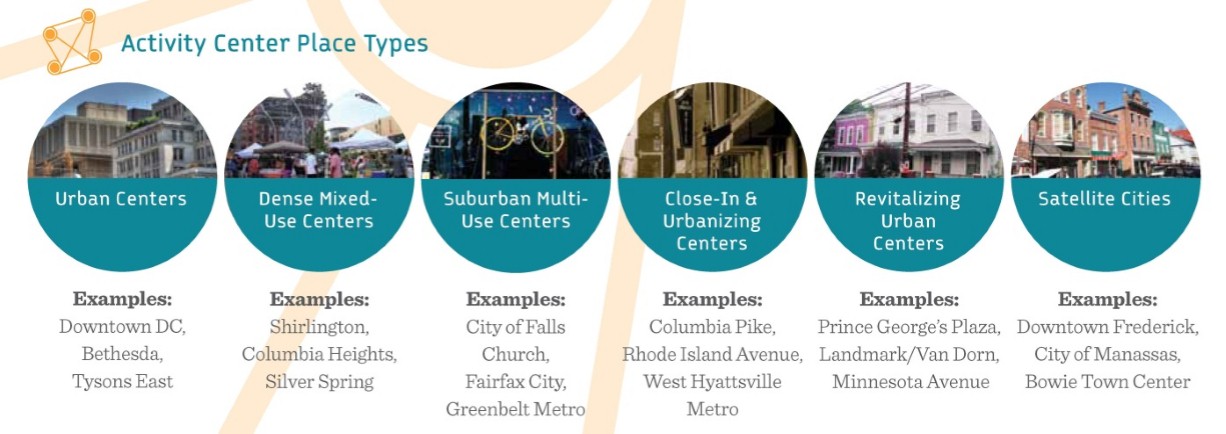
Place+Opportunity Place Types
Goals - What Are We Trying to Solve? - and the Resulting Scenarios
Simply, we tested scenarios to try to solve some of the vexing long-term WMATA challenges, such as (1) unbalanced demand across the Metrorail system, with some over crowded segments and others with few riders, (2) growing operating costs, resulting in the growth of jurisdictional subsidies, and (3) increasing travel times on rail and bus, resulting in unreliable travel for customers. We developed three scenarios around these goals as below:
- Scenario A: Efficient Transit - How can we increase ridership on all segments of the Metrorail system, while minimizing the potential for overcrowding on any segment in the system?
- Scenario B: Cost-Effective Transit - How can we increase ridership, which will reduce the subsidy that the jurisdictions pay annually to support Metrorail operations?
- Scenario C: Maintain Current (2013) Travel Times - How can we take pressure of peak period travel to maintain travel times at 2013 levels for transit passengers and highway drivers?
(Fun fact: the benefit of trying to solve WMATA’s challenges resulted in resolving some of the regional transportation and economic development challenges such as the east-west divide, increasing travel times, increasing vehicle miles traveled (VMT), increasing emissions, and many more.)
Each scenario will receive a follow up post. In the meantime, put on your thinking caps. How would you change land use and other policies such as pricing, parking, teleworking, bicycling, walking, etc. to make meet these goals?
Study Principles - What Were Our Constraints and Assumptions?
Scenario modeling is tricky and it is pretty easy to make the “what ifs” so outlandish that the results have no credibility. Therefore, we had some principles that we steadfastly adhered to over the course of the project. These were as follows: (Tread lightly - wonkiness ahead!)
- Do maintain the population and employment totals within the region’s cooperative forecast. These forecasts are created/updated annually by the jurisdictions’ planning departments and MWCOG. This means that we didn’t “take” jobs or people from Baltimore or Philadelphia or somewhere else outside of the region.
- Do vary job and population totals within and across jurisdictions. The forecast jobs and population are just that - forecasts. There’s nothing that says they are set in stone or have to be placed exactly as proposed.
- Do move only jobs and population that are forecast from 2020-2040. Anything on the ground today, stays where it is. Anything forecast to occur between 2015-2020 was considered too far along in the permitting process and also remained where it is. Everything else was considered fair game.
- Do prioritize regional activity centers that have or will have high capacity high frequency transit by 2040. There are currently 141 activity centers, but as shown below, only 86 RACs (61 percent) currently have or will have high-capacity, high-frequency transit service by 2040. Adding more people and jobs to the other activity centers where driving is the only option is counter to growing “smart”.
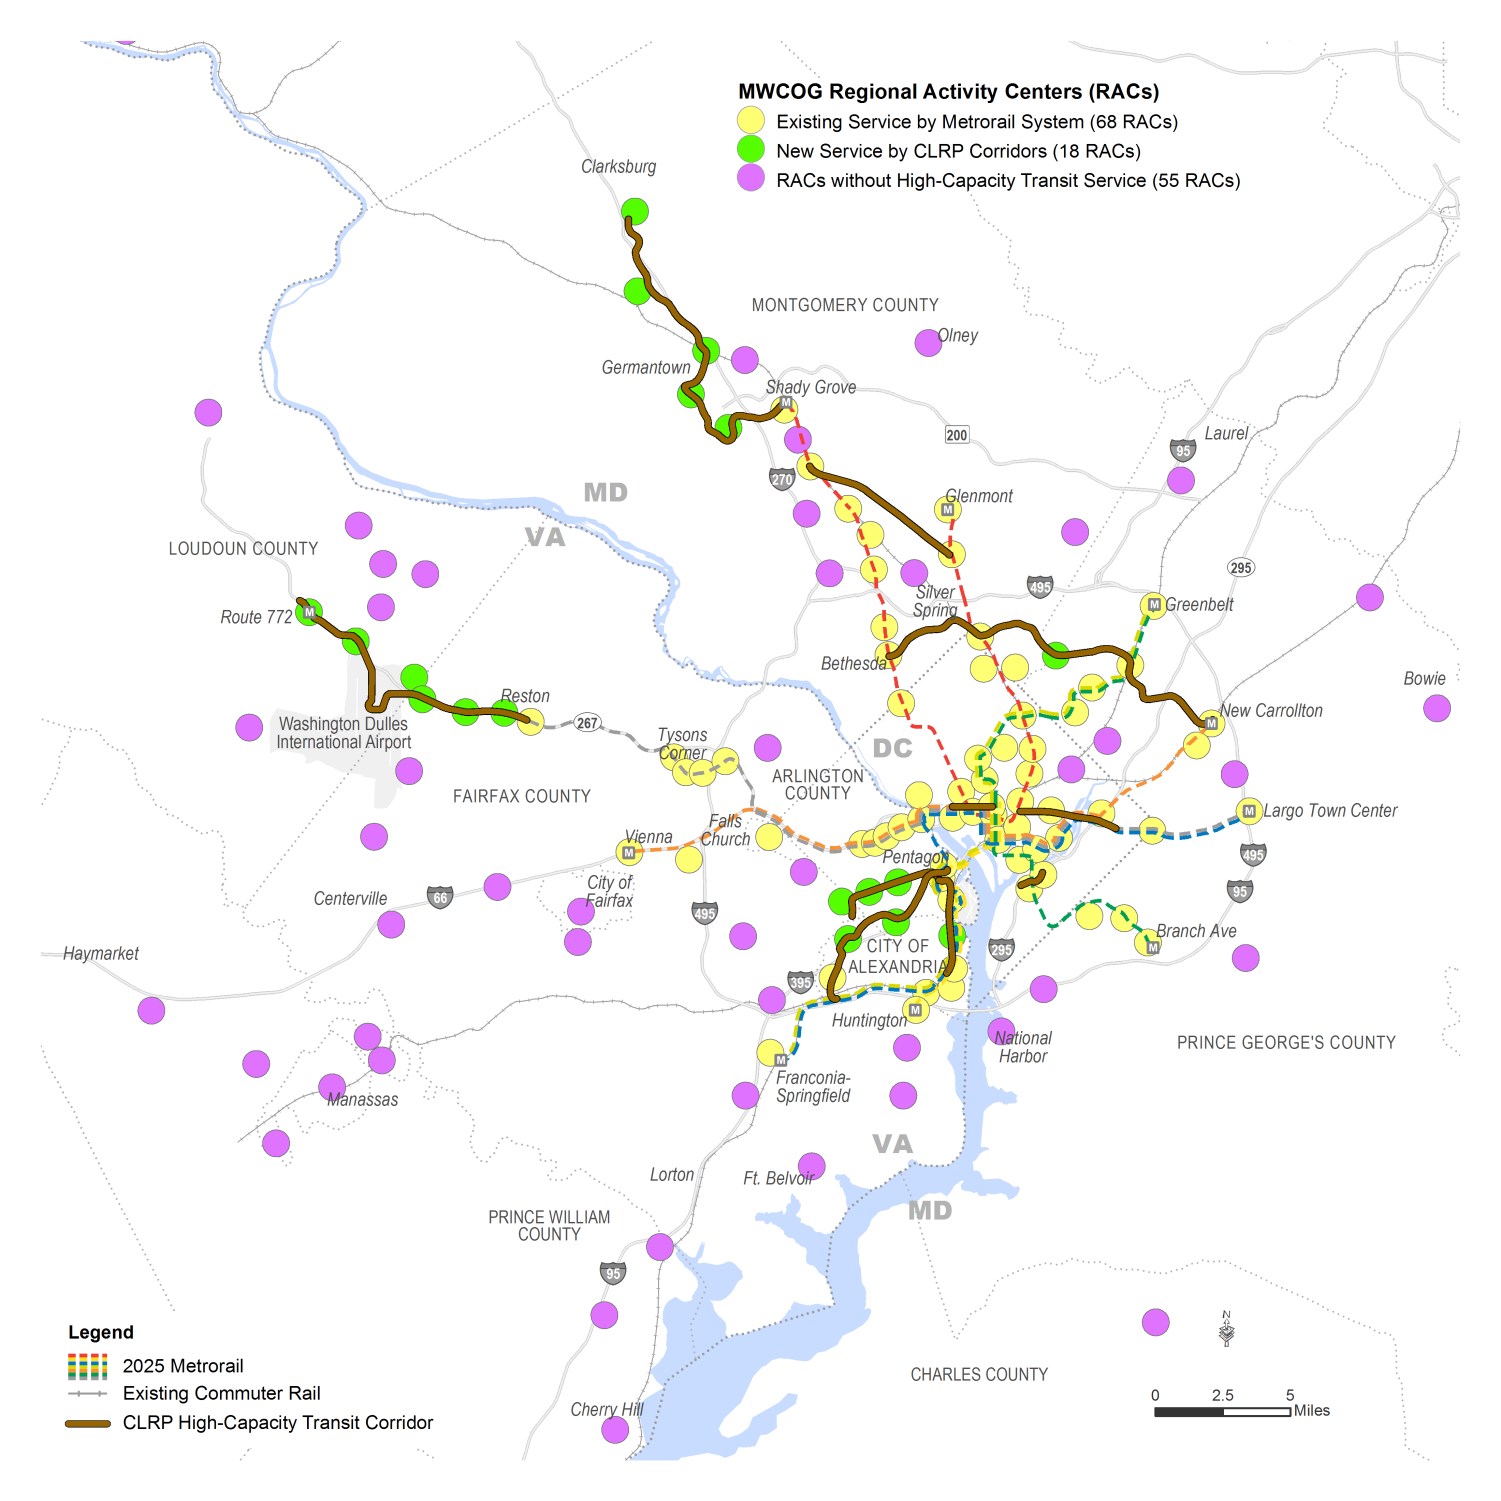
Regional Activity Centers Served and Unserved by High-Capacity, High-Frequency Transit
- Do use the same baseline transportation network for 2040. This enabled us to see what the impacts were of land use and/or policy changes. The assumed 2040 network included what was on the ground in 2014 + all projects in the 2013 Financially Constrained Long Range Plan (CLRP) + Metro 2025, as shown in the image below.
Baseline 2040 Transit Network
- Do honor the reality that this region does not intend to Manhattan-ize (or Bethesda-ize) our regional activity centers (RAC). Building out the activity centers that have high-capacity, high-frequency transit as developed by the local jurisdictions and outlined in MWCOG’s Place+Opportunity report was the outer bound of future densities envisioned in this study.
Any other fundamental assumptions would you include?
Wonky enough for you? The remainder of the blog posts in this series will give more details of the scenarios, outcomes, and where we go from here. Stay tuned!

Recent Comments