Ridership Increases Expected for Cherry Blossom Festival
During the National Cherry Blossom Festival, Metrorail ridership increases on average by 7% on weekdays and 50% on Saturdays.
Metrorail ridership is impacted by a variety of factors, from special events to weather to government shutdowns. One event that brings visitors to the region — and to Metrorail — in droves is the annual National Cherry Blossom Festival. In anticipation of this year’s festival, we performed some analysis on how, when and where the blossom viewers impacted ridership on the Metrorail system.
In general, Metrorail ridership increases on average by 7% on weekdays and up to 53% on Saturdays during the festival. On days with nice weather, ridership has increased up to 10% on weekdays and 70% on Saturdays!
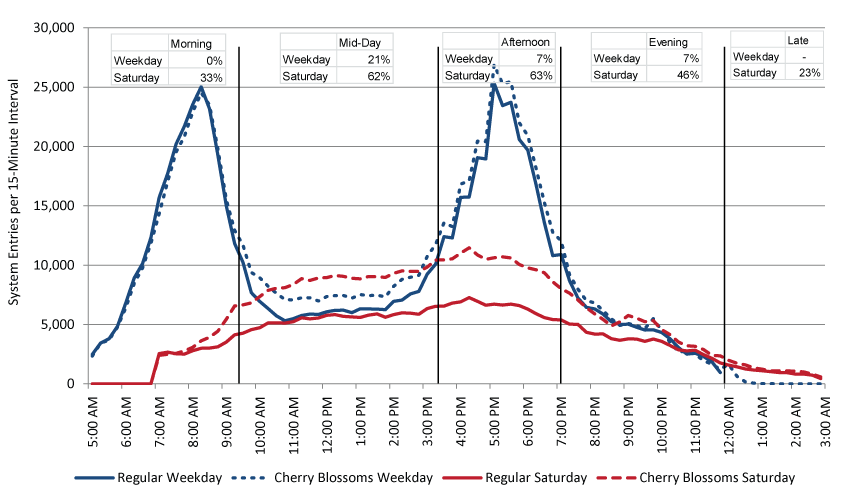
As the figure below shows, during the weekdays there is no impact in the morning, a large (21%) increase of activity during the mid day and then a 7% increase thereafter.
Saturdays are another story all together. Ridership increases up to 63% during mid day and afternoon periods on days during the festival, with a total ridership increase above 50%. Even morning and “late” night ridership increases significantly during this period.

Metrorail system entries by quarter-hour interval, Regular Weekday, Cherry Blossom Weekday, Regular Saturday and Cherry Blossom Saturday. Click chart for larger version.
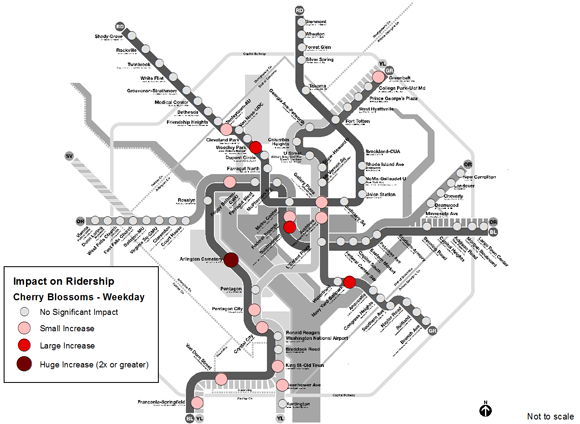
When looking at change in ridership by station in the maps below, some obvious conclusions can be drawn.
On weekdays, the ridership at Arlington Cemetery doubles, and Smithsonian, Woodley Park and Navy Yard see large increases in ridership. It is likely that visitors who come to town for the blossoms also stop by the National Zoo as well, to round out their visit to the capital city. Cherry blossom season also corresponds with the beginning of the baseball season, explaining the increases in ridership at Navy Yard. Increases at suburban stations such as Greenbelt and Franconia-Springfield are likely due to visitors making use of Metro’s park-and-ride facilities to spend a day in Washington. It is likely that suburban and end-of-line stations that show no increase (Vienna, Shady Grove, etc.) are those where Metro parking facilities fill to capacity on regular weekdays, leaving no additional capacity for visitors to park and ride.
The table below shows the top ten Metrorail stations by increases in ridership due to cherry blossoms on weekdays.
| Rank | Station | Ridership Increase | Multiple of Normal Day |
| 1 | Arlington Cemetery | 104% | 2.04 X |
| 2 | Smithsonian* | 77% | 1.77 X |
| 3 | Woodley Park-Zoo | 35% | 1.35 X |
| 4 | Navy Yard | 27% | 1.27 X |
| 5 | Gallery Place-Chinatown* | 24% | 1.24 X |
| 6 | Federal Triangle | 23% | 1.23 X |
| 7 | Eisenhower Avenue | 21% | 1.21 X |
| 8 | Foggy Bottom* | 17% | 1.17 X |
| 9 | Franconia-Springfield | 15% | 1.15 X |
| 10 | Crystal City | 15% | 1.15 X |
* Station identified for expansion improvements in Metro 2025.
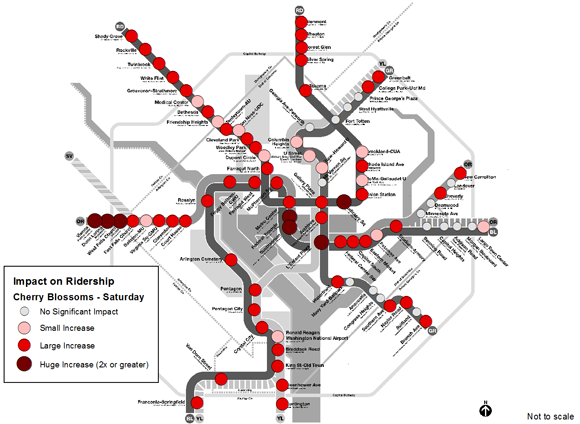
On Saturdays, the distribution of ridership increase by station is completely different. Without commuters filling park-and-ride lots, the suburban stations light up with huge increases in ridership over normal Saturdays. The stations closest to the Tidal Basin — Federal Triangle, Smithsonian and L’Enfant Plaza — also double in ridership over normal Saturdays. Large increases at nearly all other stations may indicate locals getting out to explore the beauty of the National Mall in spring time as well.

- Change in ridership due to cherry blossoms, Saturdays 2013.
This map might also illustrate the east-west divide: there are much greater increases on the western side of the region, with some suburban stations doubling in ridership, while many stations with parking on the east side of the region showing no significant impact. This map has similarities to the map of average rider income by station.
The table below shows the Metrorail stations with the largest increases in ridership due to cherry blossoms on Saturdays.
| Rank | Station | Percent Increase | Multiple of Normal Day |
| 1 | Smithsonian* | 239% | 3.39 X |
| 2 | Federal Triangle | 215% | 3.15 X |
| 3 | West Falls Church | 139% | 2.39 X |
| 4 | Vienna* | 131% | 2.31 X |
| 5 | L’Enfant Plaza* | 124% | 2.24 X |
| 6 | Dunn Loring | 123% | 2.23 X |
| 7 | Judiciary Square | 107% | 2.07 X |
| 8 | Silver Spring | 94% | 1.94 X |
| 9 | Arlington Cemetery | 85% | 1.85 X |
| 10 | Glenmont | 84% | 1.84 X |
* Station identified for expansion improvements in Metro 2025.
Metro 2025, the short-term aspect of Momentum, Metro’s strategic plan, calls for capacity expansion improvements at many Metrorail stations across the region, including widening of mezzanines and installation of new escalators and stairs. Many of the stations identified above are included in the Metro 2025 Core Station Improvements initiative, including Smithsonian, Gallery Place-Chinatown, Foggy Bottom, Vienna and L’Enfant Plaza. Currently, L’Enfant Plaza exceeds Metro’s planning standard for “vertical circulation” (movement between platforms, mezzanines and station entrances) on average weekdays, and the design of the Gallery Place-Chinatown station results in platform crowding. The additional ridership due to special events such as the National Cherry Blossom Festival adds to normal weekday ridership, and exacerbates current, regularly occurring crowding.
Metro will initiate a “track work hiatus” during this period of increased weekend ridership, to ensure that visitors from far and near are not disrupted by our rebuilding schedule. And the data above will assist with the allocation of customer service staff to help provide information and manage crowds.
During Cherry Blossom season, do you head downtown and enjoy the festivities, or stay in and avoid the crowds? What other patterns might you see here?
The data used for this analysis is available for download.
Download File: cherry_blossom_data_download.xls (MS Excel, 37KB)


Metro’s come a long way. I remember when I was provided with data like this and told I could not share it publicly because it was a security risk.
You mention Smithsonian – what work is being done there now? I cannot find a reference to it anywhere, but the entire station by the platforms is a sea of Metro’s “blue walls”.