Posts Tagged ‘ridership’

The Long View: Fiscal Year 2015 Bus and Rail Ridership Summary

September 22nd, 2015 Comments off

As Fiscal Year 2015 drew to a close last month, we figured it’s time to take the long view: how did ridership do this year?

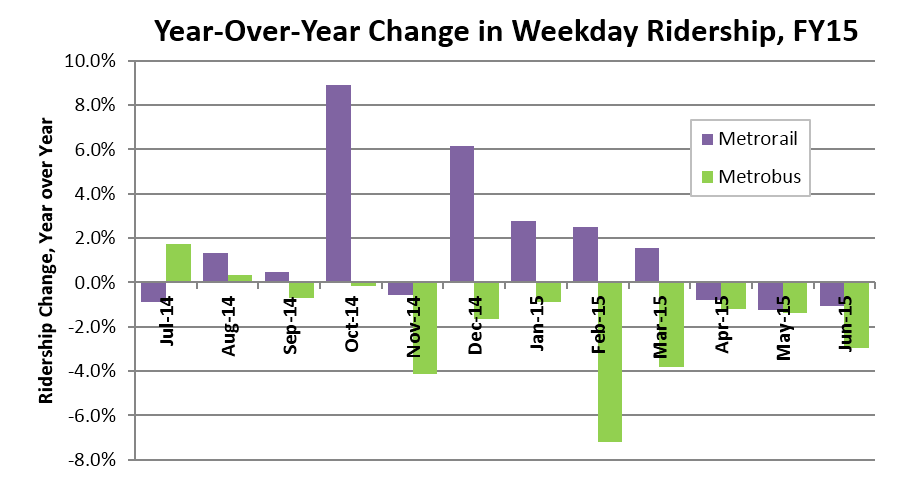
On the whole, for an average weekday over the last year:

  • Rail ridership was up by 1.5%, in part due to the introduction of the Silver Line.
  • Bus ridership was down by 1.4.
  • Rail ridership was up largely due to the federal government shutdown in October of FY14.
  • Metrorail had a good fall and winter, while Metrobus started the fiscal year well but struggled in the winter and spring months.

FY2015 Ridership Year in Review

Seasonal Trends. All changes in ridership are best shown as a comparison to the same time last year, because ridership rises and falls as the seasons change. Traditionally, ridership is lowest in the winter, and peaks twice: one in late March/early April for the Cherry Blossoms, and then again in June and July when tourists and outdoor activities are in full swing. August is usually slow, and then ridership levels stabilize again in the fall. Read more…

Big Sustainability Gains at WMATA

August 27th, 2015 Comments off

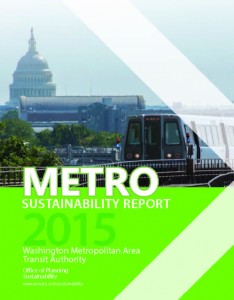
Metro has released its first sustainability report, with aggressive performance targets to guide the Authority and the region on the path to becoming the most sustainable in the nation.

Metro Sustainability Report 2015

Metro Sustainability Report 2015

As Metro’s Silver Line celebrated its first year of service in July it is timely to revisit the Metro’s first Sustainability Report. Released in April, the report outlines the sustainability benefits that the Silver Line and the Metro system as a whole bring to the region. The opening of the Silver Line has resulted in mode shift changes — as indicated by a 15% reduction in peak hour traffic at multiple intersections along Route 123 — combined with emerging transit-oriented development and walkability improvements around the Silver Line.  These  underscore the Authority’s progress towards the ridership, climate change and connected communities goals of Metro’s Sustainability Initiative – as documented in the Authority’s first annual report.

Tell us what you think of Metro’s sustainability efforts and we are always listening to new ideas for potential projects. Submit your ideas online or email them to planning@wmata.com.


Ask the Professors – How Local Land Use Decisions Impact Metrorail Ridership

August 24th, 2015 1 comment

This post is guest-written by Chao Liu, Hiro Iseki, and Gerrit Knaap, researchers from University of Maryland’s National Center for Smart Growth, who helped Metro develop our Land Use Ridership Model.

Even though Metro doesn’t control where new jobs and households locate in the region, these decisions are critical to the agency’s ridership and financial future. 

It is well known that the form and intensity of development in and near rail transit station areas can have measurable impacts on transit ridership.  For these reasons, transit oriented developments (TOD) generally feature high-density construction, mixed land uses, and bike and pedestrian friendly infrastructure.  But not all TODs are alike, and the effects of TOD on transit ridership are likely to depend on how well the station is connected both locally and regionally, whether the station is near the center or end of a transit corridor, and what kinds of jobs and household are located nearby.

To explore how different forms of development might impact ridership on the Washington Metrorail system, Dr. Hiroyuki Iseki and Dr. Chao Liu assisted Metro to develop a direct ridership model (DRM), called Metro’s Land Use Ridership Model.  A DRM uses statistical techniques to quantify the relationship between entries and exits at rail stations and land uses nearby.  This model can then be used to estimate the number of passengers who will access the station, by waking or biking, as a result of changes in land use features, transit service characteristics, and socio-demographics within the walkshed of any given station.

The direct ridership model includes a large number of variables for each station, including the density, diversity, and design of local environment; transit service and connectivity; job accessibility by auto and transit; walk score; the availability of parking; the demographics of nearby residents; the number and types of jobs nearby, and more.  The model was estimated for the AM Peak, Midday, PM Peak, and Evening travel periods.  The AM Peak model is best suited for estimating the increase in morning boardings that would result from locating more households near the station; the PM Peak model is best suited for estimating the increase in afternoon boardings that would result from locating more jobs near the station.
Pedicted AM Peak Entries per New HH

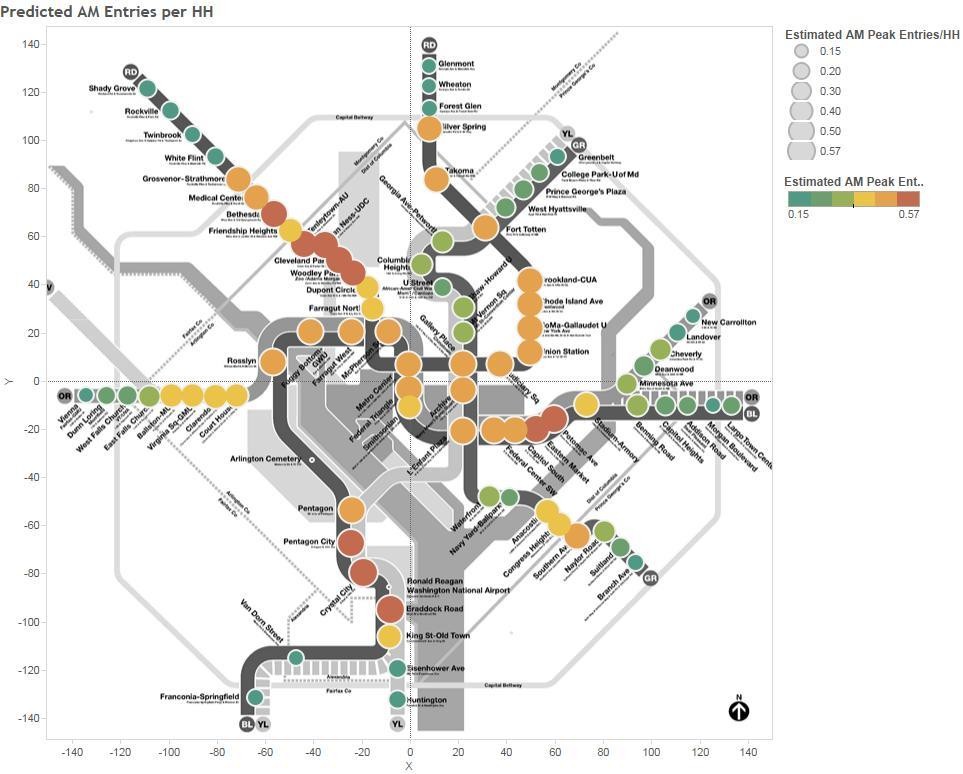
Map 1. Predicted AM Peak Entries per New Household

The impact of adding jobs and households near stations varies by station area.  Map 1 above, for example, shows the estimated entries per new household in the morning peak—that is, how many additional boardings would occur in the AM peak if one additional household was located in the walkshed of the station.  Stations shown by red dots gain more than 0.57 boardings per day, for each new household in the walk shed, while stations shown with green dots gain only about 0.20 boardings per day. As a concrete example, Rhode Island Row is a 274-unit, mixed-use, TOD project built on a WMATA site.  Situated along the busy Red Line, the project has long been considered as a prime location for new housing development.  According to the DRM model, adding 274 new households near the Rhode Island station would increase boardings by 144 passengers in the AM peak.  The same development at the New Carrollton station, however, would have added only 52 passengers.  This is because, compared to New Carrollton, the Rhode Island Avenue station has better job accessibility and more frequent transit service, and is thus likely to stimulate more transit ridership. Read more…

Rhode Island Avenue – an Opportunity to Truly Connect Communities (and Bolster WMATA Finances)

July 23rd, 2015 5 comments

Low-cost planning maneuvers could increase transit-accessibility for one thousand households and save the region $1.3 million per year!

We recently covered an exciting development project in Northeast D.C., one that will create housing and jobs right next to the Rhode Island Avenue Metro station. Because the site is located within the station’s half-mile walk shed, all those new residents, employees and shoppers are likely Metro customers, whose fares will help improve the system for everyone.

But is that the end of the story?

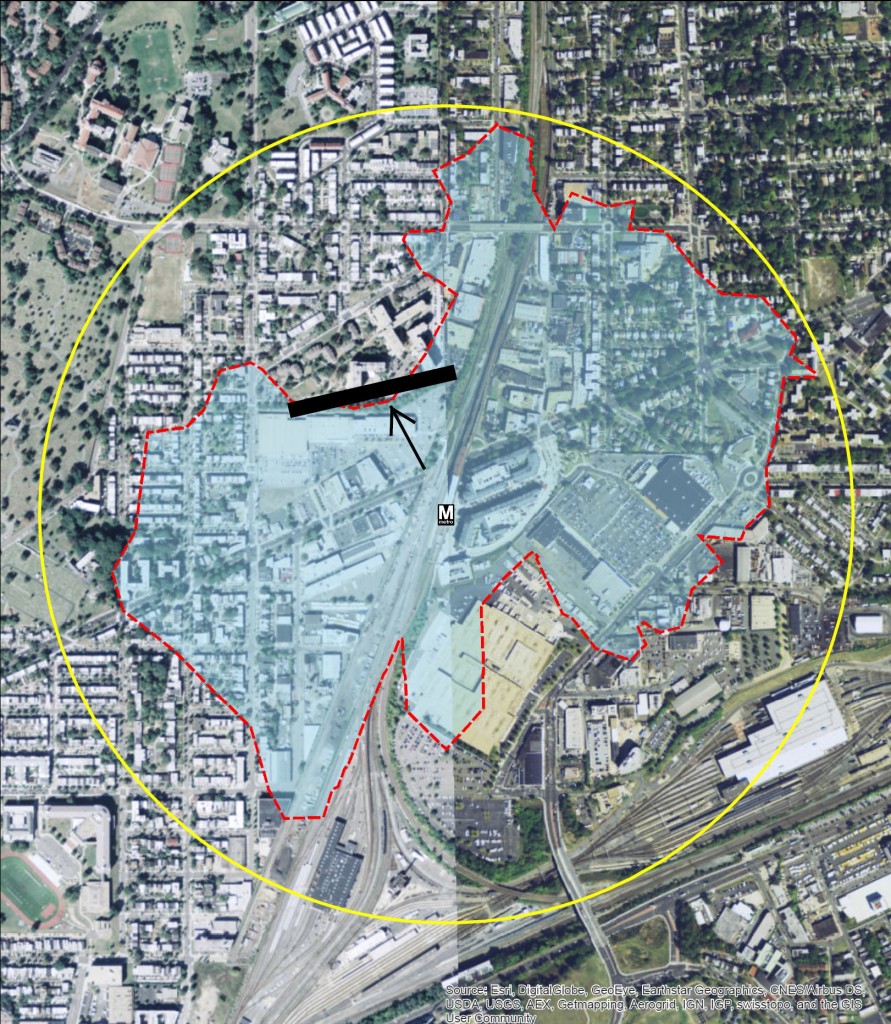
In our analysis of station walk sheds — the area within a half-mile walk of the station — we discovered that the Rhode Island Avenue walk shed is constrained by physical barriers that force pedestrians to make lengthy detours. The most notable of these is a retaining wall along the northern edge of the redevelopment site (currently the Rhode Island Center shopping mall):

RIExisting+Barrier

Current walk shed of Rhode Island Ave station, with illustration of the retaining wall.

For Edgewood residents living immediately to the north, walking to the Rhode Island Avenue Metro requires a detour around the barrier that inflates the walking distance by up to half a mile – making the total walking distance a full mile or more. While some choose to make the long hike to the station, we know that people are significantly more likely to use Metro if the station is within the half-mile walk shed.

This led us to ask: What if we make a pedestrian connection through that wall part of the large-scale redevelopment? Read more…

All Aboard! Metro Welcomes New Development Planned at Rhode Island Avenue

July 22nd, 2015 Comments off

A redevelopment project planned for Rhode Island Avenue Metro station, one of the largest such projects in the District, could bring $2.3M per year in new fare revenue for Metrorail.

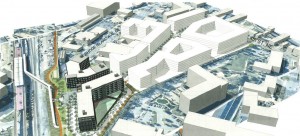
A venture led by MRP Realty is proposing a mega project near the Rhode Island Avenue metro station, which when constructed would add over 1,500 residential units and retail to that transit-oriented community.  That’s fantastic news for the District, which needs household growth to resolve its structural fiscal deficit, and also for Metro and the region, which benefits each time we add transit-oriented development that drives ridership and revenue.

Image Courtesy MRP Realty

Image Courtesy MRP Realty

At Metro we find this especially exciting because it is yet another example of how changes in development are in part fueling a ridership resurgence.  Our Land Use-Ridership model conservatively suggests that this project will yield an additional 3,200 rail entries per day systemwide, generating rail fare revenues of around $2.3 million per year. Whether this ridership actually materializes – or is even higher – depends on the developer building good pedestrian connections to the Metro station and the Met Branch Trail.

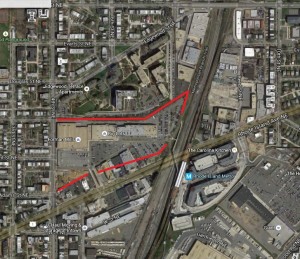
In addition, this project could be a good opportunity to create a pedestrian connection between the station and the neighborhoods to the north, where potential Metrorail riders are blocked from the station’s “walk shed” today.  The current conditions include a challenging combination of grade changes and physical barriers behind the shopping mall, creating pedestrian barriers outlined in red below. The key question will be whether the development will help fix the barrier along the north side of the site, which would only increase the ridership- and revenue-generating potential of this project.

Image Courtesy Google Maps

Pedestrian barriers in red. Image courtesy Google Maps

The property tax benefits of the project all accrue to the District, and the increased revenue to WMATA doesn’t come for free – the system will need to handle the additional passengers and incur additional operating costs and potential wear and tear on the system.  Right now there isn’t a defined mechanism for WMATA to recoup the value of real estate property taxes to fund capital renewal or expansion.  But certainly anything that contributes to the operating health of the transit agency through increased ridership and revenues goes a long way to promoting financial stability for the Authority, as well as lowering the operating subsidy burden it requires to run the system.

Metrorail Ridership – Back on Track

July 21st, 2015 Comments off

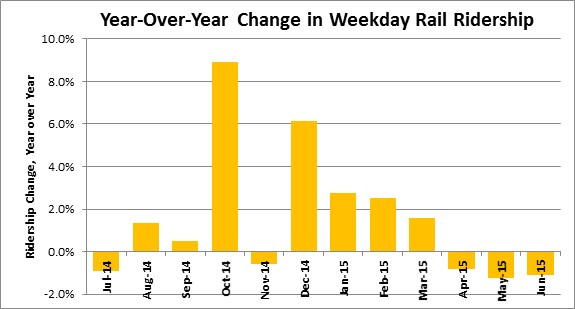
Metrorail ridership stabilized in FY 2015, and that’s exactly what we said would happen.

We’ve seen from previous posts that total Metorail ridership had been experiencing its cyclical swoon following the housing bust and economic collapse of 2008.  Despite the volatile market, system ridership stabilized over the last few years – this past year may mark the beginning of the next phase of Metrorail ridership growth.  In Fiscal Year 2015, average weekday Metrorail ridership grew by just over 1.5%.

Ridership

The biggest swing of course is the difference in October: in October of 2013, we experienced the ridership loss due to the prolonged Federal Government shutdown; that didn’t happen in October of 2014.  Another interesting difference is that in FY 2014 there were five snow days during the winter, compared to only two snow days during the winter of FY 2015.  So, even when discounting the October effect, ridership was still up slightly year over year – a good sign for Metro and the region that helps support its services! And of course, the new Silver Line stations are helping to drive growth as well.

Meanwhile, we are continuing to experience strong growth in Metrobus routes where we have executed operational innovations.  Metro stands ready to work with jurisdictions and replicate these successes elsewhere.

This isn’t the end of the story.  The region’s pipeline of transit oriented development is going to accelerate this ridership growth, and in the next post we’ll provide just one example by detailing the expected ridership impacts of the exciting new project proposed for Rhode Island Avenue.

Categories: Engage Tags: , ,

Taylor Swift vs. Nationals – Hit Singles, but No Home Run

July 17th, 2015 6 comments

Ridership from neither of the two back-to-back sold-out Taylor Swift concerts at Nationals Park this week generated as many riders as an average Nationals baseball game.

Entries at Navy Yard by fifteen-minute period, Orange and Gray were nights of the Taylor Swift concerts.

Pop star Taylor Swift brought her 1989 tour to Washington this week, playing two sold-out concerts at Nationals Park, adjacent to the Navy Yard-Ballpark Metrorail station.  According to Swift, approximately 45,000 people attended each concert.  That’s a lot higher than a normal Nationals game, as the concert had seating on the floor as well as in the stands.  One would hope that such big crowds would bump up Metrorail ridership higher than the Nats.  You might be disappointed. Read more…

Metrorail Rider Incomes – A Closer Look

June 29th, 2015 5 comments

Salaries of actual riders are needed to paint a true picture of Metrorail ridership by line.

The Washington Post recently featured a series of images from the You Are Here project of the Social Computing Group at MIT showing Metrorail median income by line and station.  We were digging into it and realized it uses median household income within a half-mile radius, and not that of the actual riders’ households.  While we’ve mapped low-income riders before, we set out to answer the question, “What is the actual average income of Metrorail riders by line and station?”   Along the way, we developed this interactive data visualization.

dashboard

Screenshot of Metrorail rider income by station visualization. Click image for full interactive version.

The biggest overall difference between our work and that of the MIT group is higher  household incomes at end-of-line stations on the eastern side of the region.  These stations, while located in lower income areas, have large parking facilities that draw commuters from all over the region and beyond. Read more…

Where Are Those Rail Riders Going?

May 12th, 2015 4 comments

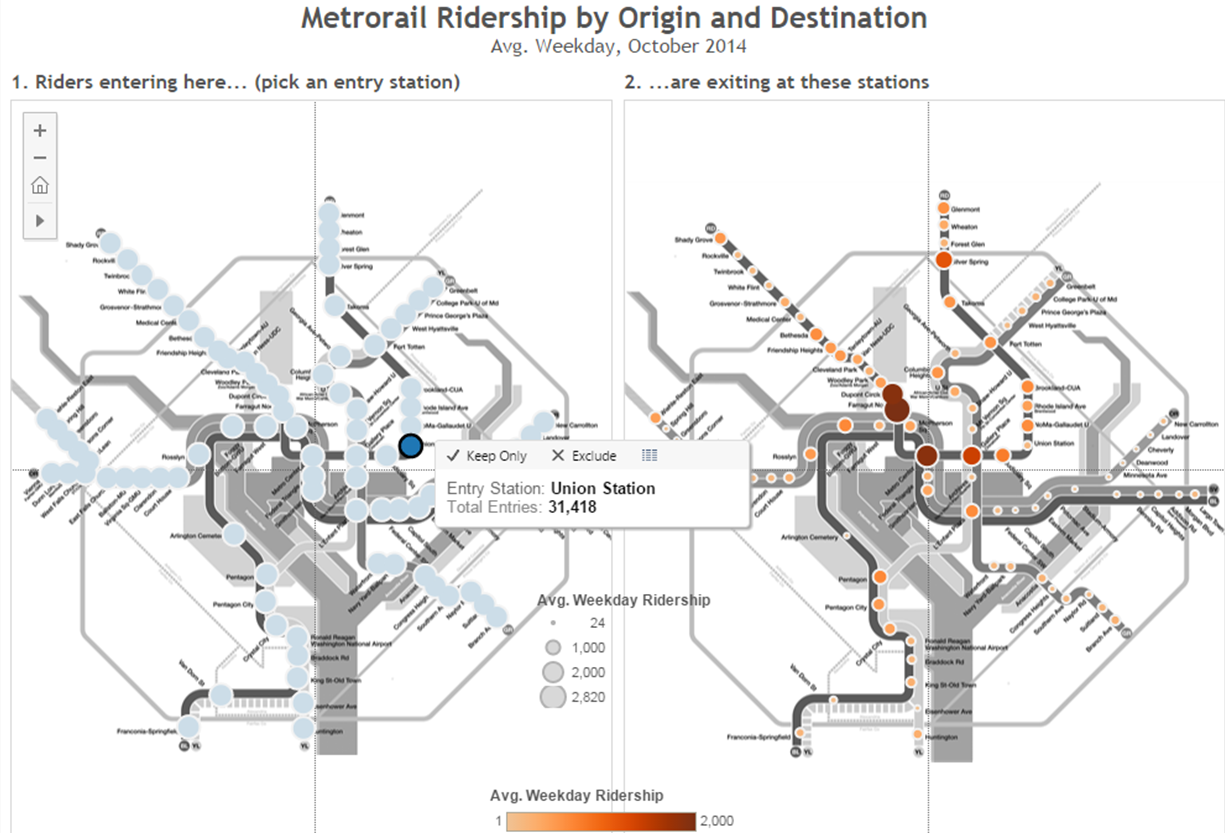
Ever wonder where rail riders are going to and from? Here’s a map that shows you.

“What are the destinations of riders at Station X?”  It’s a question we get often here. Well, using October 2014 rail ridership data by origin and destination, it’s pretty easy to answer that question – click below for an interactive map.

OD Rail Viz preview

Click for a larger, interactive version of Metrorail ridership information by origin and destination station

The K9 MetroExtra Bus Route Surpassing Expectations

April 30th, 2015 8 comments

Two years and 500,000 riders later, the K9 continues to demonstrates the benefits of MetroExtra limited-stop bus service.

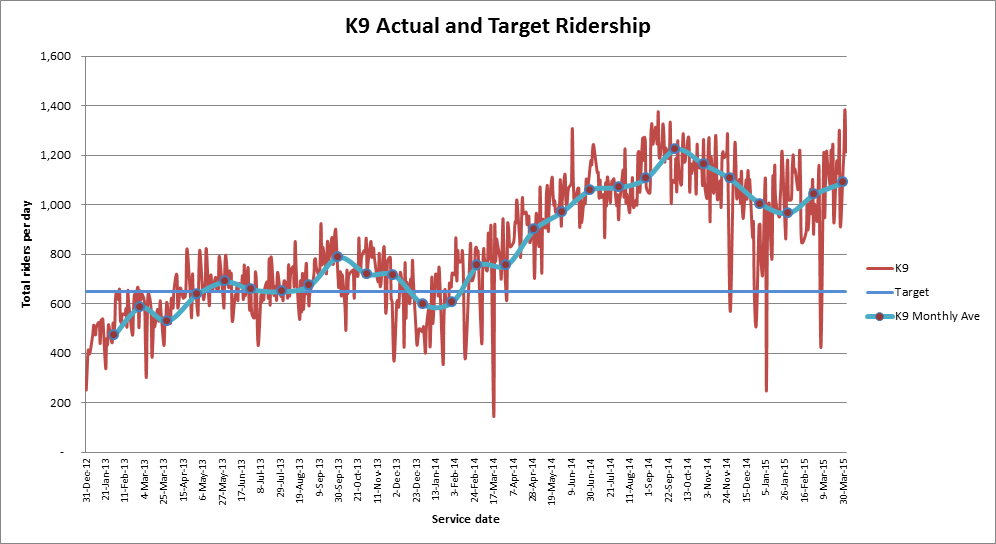
At the end of this month, the K9 bus route will pass an important milestone – it will carry its half-millionth rider.  Since its inaugural run, the K9 has continually surpassed all of our expectations.

The concept for the K9 emerged from a year long study on bus service needs in the New Hampshire corridor and on New Year’s Eve 2012, Metro launched the K9 service – the first limited-stop bus service introduced in Maryland in many years. The K9 provided faster and more reliable service along New Hampshire Avenue between Fort Totten Metrorail station and the Northwest Park apartments in Montgomery County. Riders responded enthusiastically, pushing the K9 over its 6-month target of 650 daily riders in less than four months.  In March 2014, we extended the route north to the Federal Research Center in White Oak to coincide with the transfer of several thousand FDA employees to that facility and increased the service frequency to every 15 minutes.  Ridership surged again, passing 1,000 daily riders for first time only a week later. Two months later daily ridership was up another 20% to 1,200 daily riders.

K9 Ridership by day

Ridership on the K9 has grown an astonishing 50% year-over year for the past two years in a row, and this growth has not come at the expense of ridership on the underlying K6 local bus service (the K6 grew 2% between 2013 and 2014 and has been virtually flat for 2015).  Instead, the K9 has tapped into pent-up demand for transit service within the corridor by providing desperately needed capacity.  Read more…