Posts Tagged ‘trends’

The Long View: Fiscal Year 2015 Bus and Rail Ridership Summary

September 22nd, 2015 Comments off

As Fiscal Year 2015 drew to a close last month, we figured it’s time to take the long view: how did ridership do this year?

On the whole, for an average weekday over the last year:

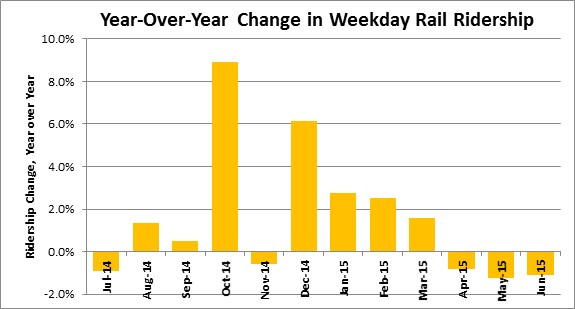
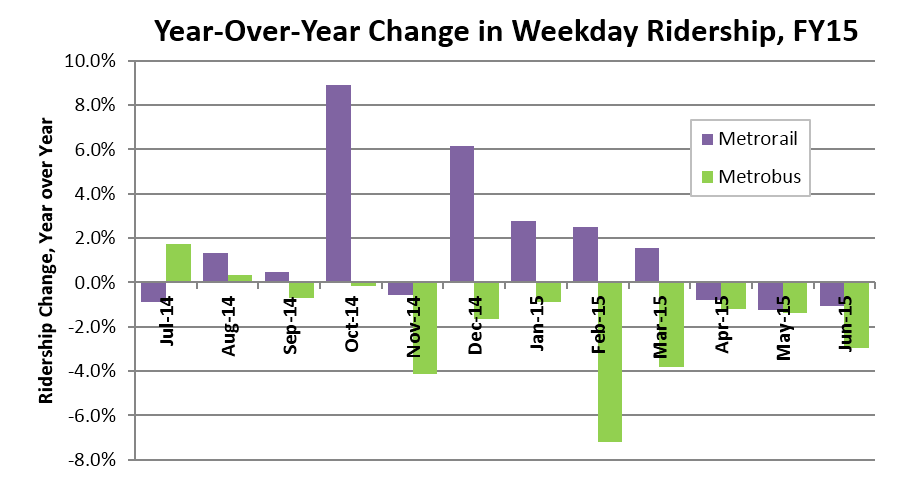
  • Rail ridership was up by 1.5%, in part due to the introduction of the Silver Line.
  • Bus ridership was down by 1.4.
  • Rail ridership was up largely due to the federal government shutdown in October of FY14.
  • Metrorail had a good fall and winter, while Metrobus started the fiscal year well but struggled in the winter and spring months.

FY2015 Ridership Year in Review

Seasonal Trends. All changes in ridership are best shown as a comparison to the same time last year, because ridership rises and falls as the seasons change. Traditionally, ridership is lowest in the winter, and peaks twice: one in late March/early April for the Cherry Blossoms, and then again in June and July when tourists and outdoor activities are in full swing. August is usually slow, and then ridership levels stabilize again in the fall. Read more…

Metrorail Ridership – Back on Track

July 21st, 2015 Comments off

Metrorail ridership stabilized in FY 2015, and that’s exactly what we said would happen.

We’ve seen from previous posts that total Metorail ridership had been experiencing its cyclical swoon following the housing bust and economic collapse of 2008.  Despite the volatile market, system ridership stabilized over the last few years – this past year may mark the beginning of the next phase of Metrorail ridership growth.  In Fiscal Year 2015, average weekday Metrorail ridership grew by just over 1.5%.

Ridership

The biggest swing of course is the difference in October: in October of 2013, we experienced the ridership loss due to the prolonged Federal Government shutdown; that didn’t happen in October of 2014.  Another interesting difference is that in FY 2014 there were five snow days during the winter, compared to only two snow days during the winter of FY 2015.  So, even when discounting the October effect, ridership was still up slightly year over year – a good sign for Metro and the region that helps support its services! And of course, the new Silver Line stations are helping to drive growth as well.

Meanwhile, we are continuing to experience strong growth in Metrobus routes where we have executed operational innovations.  Metro stands ready to work with jurisdictions and replicate these successes elsewhere.

This isn’t the end of the story.  The region’s pipeline of transit oriented development is going to accelerate this ridership growth, and in the next post we’ll provide just one example by detailing the expected ridership impacts of the exciting new project proposed for Rhode Island Avenue.

Categories: Engage Tags: , ,

Monitoring (and Caring About) Customers, Not Just Trips

April 13th, 2015 2 comments

Deep explorations into the composition of Metrorail’s customer base shows that Metro has a wide reach – and that the five-day-a-week rider may not be as common as you think.

Metro (bus and rail) moves 1.1 million people per day, right? Well, technically we see that many trips (transactions) per day, but how many individual customers is that?  When you look at your fellow passengers on-board a train, how many are frequent commuters? How many rarely ride? In addition to counting trips, we’ve begun to monitor customers – the number of unique SmarTrip cards and paper tickets used on the system in a month.

We’re starting with Metrorail at first.

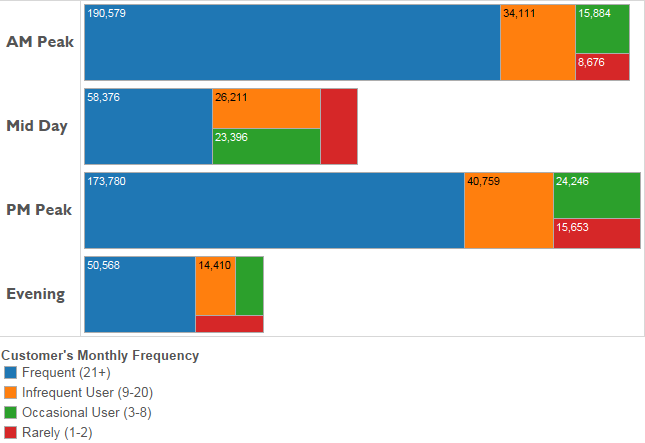
Metrorail typically handles roughly 730,000 trips on a weekday, which are generated by about 400,000 unique customers. Some of those customers ride frequently, and others will ride only once in the month.  As the chart below shows, of the 730,000 trips, only about two-thirds are generated by frequent customers.  Not surprisingly, frequent customers dominate more during the peak times.

Sept 2014 ridership by frequency by period_bars

Typical weekday rail ridership (trips) by customer’s monthly frequency (trips/month)

Surprisingly, over 17% of all trips are generated by customers who take eight trips/month or fewer– that’s fewer than once per week.  That may not seem like much, but in order for infrequent customers to generate so much of our ridership each and every day, there must be a LOT of them! Read more…

Metrorail Ridership Projections – Looking Ahead

March 11th, 2015 8 comments

Historical data and regional growth projections tell us one thing – Metrorail ridership will rebound and grow right along with the region, and the system better be ready to carry the load.

Crystal City Sta -am Rush 060912-129

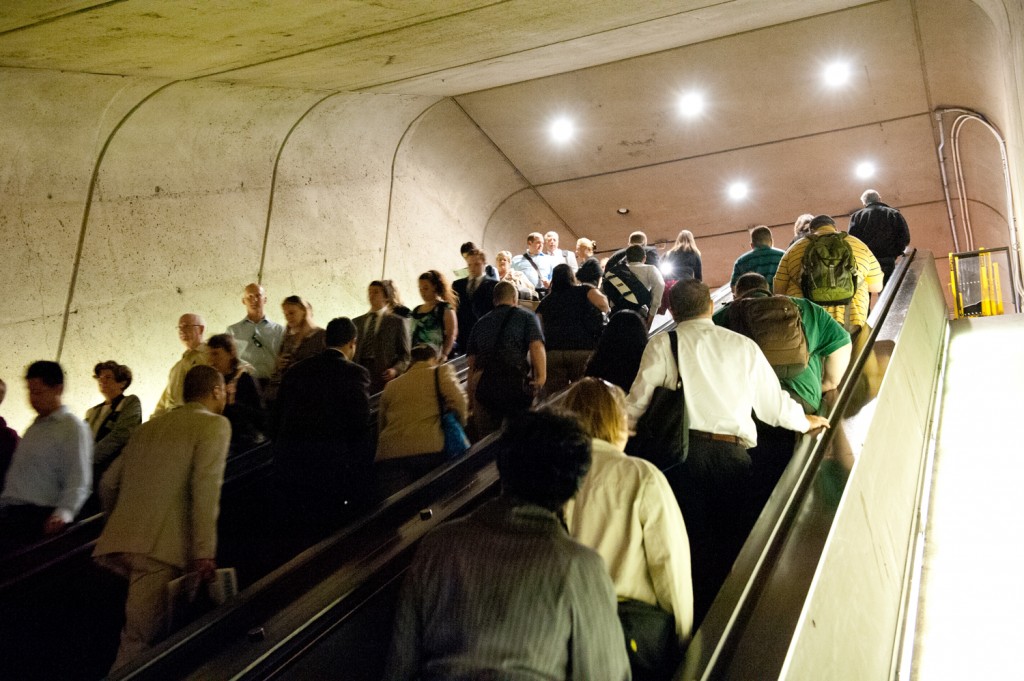
Metrorail riders enter and exit Crystal City during the AM rush hour, June 2012.

Local ridership trends that seem to defy a national boom in public transit usage give some pause about the need for planned transit expansion projects.  It’s no surprise that even the most ardent of transit supporters might be caught flat-footed when trying to defend infrastructure investments against the backdrop of scarce funding.  Some have even gone so far as to question whether Metorail ridership, which just a few years ago looked poised to eclipse 800 thousand trips per average weekday, is experiencing more of a structural downshifting and may experience flat or even declining ridership for the foreseeable future.

All of this debate is understandable in a town obsessed with statistics and “horse race” leaderboards.  But when it comes to economics, demographics, mobility, and infrastructure, regional leaders need to look beyond the numbers d’jour and bet on a sure thing – Metro ridership will go up.  Here’s why:

1. Short-term snapshots of rail ridership miss the forest for the treesOr maybe even just leaves.

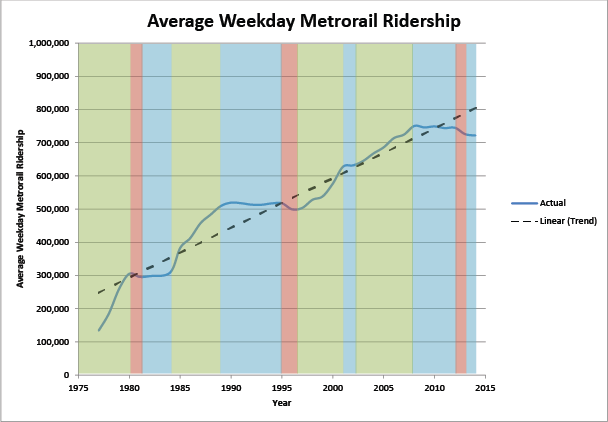
The graph below shows Metrorail average weekday ridership from the beginning of Metrorail. You can see that ridership grew in the first five years as the system grew from just the Red Line and four stops in 1976 to adding Orange and Blue Lines in operation by 1980. And after all of that expansion was completed, something fascinating took place – ridership declined and essentially flatlined until 1985. During that time, the region didn’t stop investing in Metro. On the contrary, during that same time period Metro built the Yellow Line and extended the Red Line from Downtown into Upper NW DC and then all the way to Shady Grove. Ridership shot up again in the late 1980s while Metro extended the Orange Line to Vienna and the Red Line to Wheaton then flat-lined and even declined through the mid 1990s, all while Metrorail added capacity on Yellow and Blue and (finally) opened up the Green Line. From 1997 through the late 2000s Metrorail saw robust ridership increases despite minimal capacity increases – largely reflective of the underlying economic and demographic resurgence of the central city and its urbane suburbs – and ridership flat-lined in tandem largely with the economic collapse of 2008 and the prolonged Great Recession.

ridership_chart_v2-01

Read more…

Metro from the Beginning

June 24th, 2013 1 comment

In 1967, the federal government passed Foggy-Bottom-escalators-and-Stairs-051612-11a bill to create the Washington Metropolitan Area Transit Authority (Metro). The interstate Compact was signed by the District of Columbia, the Commonwealth of Virginia, and the State of Maryland. Metro continues to be chartered by this interstate Compact. Among all transit providers in the Washington region – which number more than 15 – Metro is unique in that it serves both states and the District. It provides the only truly regional transit network.

In the late 1970s, Metro trains carried just over 100,000 passengers a day and served hundreds of thousands of passengers on the bus system. Since then, most rail stations in the core of the system have seen ridership more than double. As depicted below, rail average weekday ridership system-wide has gone from just over 500,000 in 1990 to almost 750,000 today, or 220 million trips annually, while weekday bus ridership has stayed at a stable level of  roughly 450,000 daily trips, or 134 million trips annually. Read more…

What are the Drivers for Demand of Transit Services?

February 5th, 2013 1 comment

Correlation between weekday Metrorail (monthly total) ridership and the number of jobs in the District of Columbia, FY05 – FY12. Note the “natural log” (ln) of each is illustrated.  The low-ridership outlier is due to Snowmageddon, February 2010.

Demand for public transportation services is not a direct demand, meaning that transit is a means to another end:  a traveler on transit rarely takes transit for the sake of travel but because they have a need for work, shopping, entertainment, etc.  Additionally, many factors determine whether a traveler’s demand for a good or service translates into a public transportation trip or a trip by a private automobile.  Therefore, transit demand is driven by two different sets of factors, the first being the changing demand for goods or services that result in the demand for transportation and the second being the factors that influence which transportation mode is chosen.

For example, having a job creates the need to travel to work.  Yet other factors — such as the levels of transit service between home and work locations, the price of gas, the transit fare, the relative travel time between car and transit, and car-ownership rates – may have some influence over whether the demand for travel translates into the demand for a travel trip. Read more…