Posts Tagged ‘ridership’

Ridership Before and After the Blizzard of 2016

February 22nd, 2016 3 comments

What happens to ridership when a major snowstorm closes Metro?

The blizzard at the end of January dumped around two feet of snow on the Washington region over the course of a few days, making it the fourth-largest snowstorm in D.C. in over a century. To protect equipment, for the safety of employees and riders, and to focus on cleanup efforts, Metro ceased all operations for over three days. The Federal Government and schools were closed.

The chart below tells the story of the blizzard from a ridership perspective.  Actual bus and rail ridership by hour is shown as blue and red, with the orange dotted line showing a typical pattern from two weeks prior in January.

image012

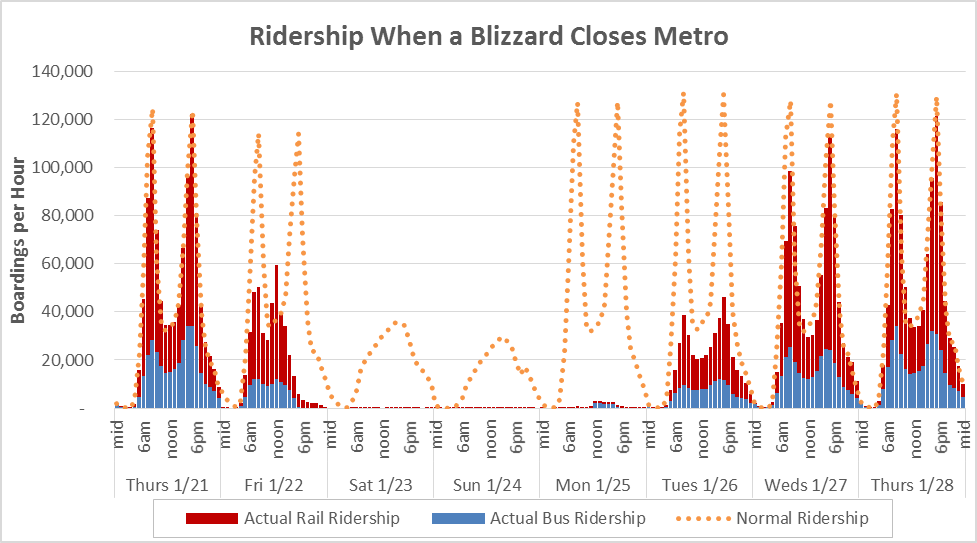
Even before the snowflakes began falling on the afternoon of Friday, January 22, Metro’s ridership was impacted. That day, riders adjusted their normal routines by staying home, teleworking, or leaving early. The morning’s peak was half of normal. By Friday night, bus and rail operations ceased. No service operated Saturday or Sunday. Very limited bus and rail service was offered for a few hours on Monday, January 25 as cleanup and recovery began. Fares were not charged on rail, so we recorded very few transactions.

We recovered gradually on Tuesday and Wednesday, and nearly fully by Thursday, even as many school systems remained closed.

In the end, total ridership losses were estimated to be about 2.9 million boardings over five days, 1.6 million on rail and 1.3 million on bus. Bus took a proportionately bigger hit than rail given service restrictions from icy and unsafe road conditions.

What do you see in these numbers? Also, feel free to download the underlying data (.xlsx, 40kb) for yourself.

How Do Marylanders Use Metro?

February 2nd, 2016 2 comments

We analyzed Metrorail, Metrobus, and MetroAccess ridership for all Maryland residents in response to the Maryland Legislature’s data and analysis request. Newsflash – we have customers from across the state!

Origins of Maryland Rail Riders

Origins of Maryland Rail Riders

In the 2015 legislative session, the Maryland General Assembly passed the WMATA Utilization Study (HB300),which required the Maryland Department of Transportation (MDOT) and WMATA to analyze the utilization of Metrorail, Metrobus, and MetroAccess every five years. This year’s analysis is based on the most recent Metrorail passenger survey (2012), Metrobus passenger survey (2014), and actual ridership for MetroAccess for an average day in April 2015. Below are some findings that I found most interesting. But more importantly, here is the complete 2015 Maryland HB300 WMATA Utilization Study (native pdf), which includes all the links to the underlying survey data, interactive charts, and analysis.

  • 82 percent of Metrorail trips by Montgomery County residents are destined for Washington DC in the morning on a typical weekday;
  • 71 percent of Metrobus trips in the AM peak period made by Prince George’s County residents are for work purposes on a typical weekday;
  • 3.3 percent of all trips across all Metro services on a typical weekday are taken by Maryland residents from Frederick, Charles, Calvert, Howard, Anne Arundel, and Baltimore Counties and Baltimore City;
  • 35 percent of other Maryland residents on Metrorail access via commuter rail (MARC) and Amtrak; and
  • 17,600 residents of the District and Virginia reverse-commute into Maryland on Metrorail and bus each morning on a typical weekday (about 5 percent of total system ridership)

Any other nuggets that you found from analyzing the data? Ideas for other ways to graphically represent the findings?

Metro Celebrates Permanent Restoration of Transit Benefit

February 1st, 2016 1 comment

After years of analysis, advocacy and lobbying, Congress has restored the transit commuter benefit to match the parking benefit, helping Metro, the region and the nation.

The employer transportation benefit for transit and vanpools has fluctuated a lot in recent years. In February of 2009, it was increased from $120 to $230, matching the parking benefit.  Almost three years later, in January of 2012 it was slashed to $125 only to be raised to $245 the following year.  After only a year, it was slashed again, this time to $130 where it stayed for two full years.  In January of this year, it was raised to $255 to permanently match the parking benefit.  Metro Board of Directors member Tom Bulgeran outspoken advocate for the transit benefit —  played a vital role in ensuring its restoration to match the parking benefit.  Thanks, Tom!

History of Employer Transportation Benefits, Monthly Limits. Data from Wikipedia.

History of Employer Transportation Benefits, Monthly Limits. Data from Wikipedia.

The benefit amount wasn’t the only thing that has been changing.  In 2010, the Metro implemented a series of new IRS rules for how the transit benefit could be used.  For example, on smart media the transit benefit dollars had to be stored in a separate “purse” that could only be use for transit fares and not for parking costs at park-and-ride facilities.  Employers also began asking employees to specify exactly how much transit fare was needed each month, instead of setting one amount and accruing benefits for trips untaken.  Perhaps most importantly, a new rule stated that those unused dollars in this transit-only purse were to be “clawed back” at the end of each month. Read more…

Right Underneath our Feet – How Planning, Zoning, and Development Influence Metrorail Ridership

January 12th, 2016 4 comments

Metrorail ridership is heavily-determined by station-area land use patterns, so attention to land use as a transportation strategy will be important to sustaining Metrorail’s long-term ridership growth.

There has been a tremendous amount of attention recently paid to Metrorail’s ridership trends.  While history tells us that the current ridership snapshot – which shows that ridership has essentially flatlined – is quite normal given the cyclic nature of ridership growth, Metro’s Office of Planning has been exploring why certain station areas and rail segments have seen ridership gains during the downturn, while other station areas and segments have seen losses.

Passenger Miles Traveled by Trip Origin at Each Metrorail Station, AM Pea, Full-Fare Riders with no Transit Benefits. One of the inputs from this study.

Passenger Miles Traveled by Trip Origin at Each Metrorail Station, AM Pea, Full-Fare Riders with no Transit Benefits. One of the inputs from this study.

The questions we sought answers to included, for instance:

  • Why is it that while system-wide ridership declined last year, we saw ridership gains at stations with lots of transit-oriented development, such as NoMA, Columbia Heights, and Navy Yard-Ballpark?
  • How much of an impact does transit-oriented development have on overall ridership, and can that impact be measured, both in terms of new ridership as well as in terms of net new farebox revenue?
  • With so many ways to get around – including walking and biking and Uber and Lyft – and gas prices at near historic lows, how does a Metorail trip compare to other ways of getting around in terms of overall competitiveness?
  • Does the location of a transit oriented development project matter in terms of how much ridership it generates?  Does that vary by the type of project (i.e. office, retail, residential, etc)

Read more…

Paratransit and the Coming Age Wave

December 15th, 2015 2 comments

Christian T. Kent, the Assistant General Manager for Access Services, offers his thoughts on accessibility and Metro’s future.

ChristianKentMr. Kent provides oversight for the accessibility of Metrobus and Metrorail and is directly responsible for the operation of MetroAccess paratransit service. Metro operates the largest fully accessible transit system and the fifth largest paratransit system in North America. 

Accessibility is very important at Metro. Because Metro is accessible, hundreds of thousands of people with disabilities in our region can depend on Metro to get where they are going. Our low-floor talking buses and rail stations with elevators mean that someone who is blind or uses a wheelchair can use Metrobus or Metrorail. Metro can be the family car for someone who can’t drive. And for those who can’t use bus or rail, there is our paratransit service, MetroAccess. Our 675 lift-equipped MetroAccess vans deliver over 2 million rides every year to 40,000 customers. So Metro really is very important to people with disabilities, and Metro will be even more important to them in the future. Why is that?

America is getting older. More and more people are turning 65 each year, and seniors have a much higher rate of disability and drive less often than younger people. The average MetroAccess rider is 62 years old. In the District, the average age is 67. This “age wave” means more Metro customers with disabilities in the coming years. We need to make sure that the accessibility features in our bus and rail service work consistently well so that customers with disabilities choose and use bus and rail. Providing the most accessible bus and rail service means less reliance on MetroAccess. This is important to Metro because a trip on paratransit is much more expensive than one on bus or rail, and it is important to customers who want to take advantage of the most independent means of travel available. Read more…

Four Key Questions about Metro’s Future with the Federal Worker (5 of 5)

December 9th, 2015 Comments off

The answers to these four questions will shape the future of Metro’s federal customers, and the region’s transportation future. (Fifth and last in a series of posts on Metro’s Federal customers – see posts 1, 2, 3, and 4)

The ATF headquarters adjacent to NoMa Metrorail station has helped grow ridership there significantly.

1. Will the transit benefit be restored to parity with parking? When Congress cut the transit benefit in half, it hurt Metro riders hard. 42% of Metro’s ridership – around 500,000 rail and bus trips per day – comes from riders who use the Federal Transit Benefit, including private-sector workers. At Metro, 22% of all ridership comes from commuters who spend over $130 per month on transit. Following the changes to the SmartBenefits program, Metro saw ridership losses concentrated on these riders hit the hardest, and federal employees overwhelmingly pay with SmartBenefits.

If Congress restores the maximum transit benefit to parity with parking, it would be a huge boon to Metro’s federal customers and Metro’s bottom line. Read more…

Why We Care About GSA’s Location Decisions: Lessons from the History of Metro’s Federal Customers (4 of 5)

December 2nd, 2015 4 comments

Data show that where GSA chooses to locate federal office buildings has a huge impact on Metrorail ridership from federal commuters.  But in the meantime, non-Federal riders in the inner jurisdictions are driving up ridership outside of the usual commute market. (Fourth in a series of posts on Metro’s Federal Customers – see posts 1, 2, and 3)

Growth in Metrorail Ridership from Feds by Time of DayBetween 2002 and 2012, rail ridership from federal employees has grown 15%, the same as from non-federal riders.  (N.B. this post focuses on rail only; no comparable survey data for bus is available.)  Federal employees have remained about a third of total ridership, as overall ridership ebbed and flowed. Most of these new federal riders live in the inner jurisdictions of D.C., Arlington, and Alexandria – ridership from federal employees has been much slower in the outer jurisdictions, particularly Fairfax County (growing at 5-15%, vs. 25-40% over ten years).  The growth from federal riders has mimicked existing riders – they are focused on the peak commute too, with a moderate amount of off-peak travel as well.

But over the same timeframe, non-federal customers drove up ridership much faster in the PM Peak and Off-Peak times.  These riders similarly come from the inner jurisdictions. Read more…

Metro’s Federal Customers: A Snapshot (1 of 5)

November 19th, 2015 Comments off

Think Metro is all about getting the federal commuters to work? Think again!

(First in a series of posts on Metro’s customers who are Federal Government employees)

Just as the workforce in the Washington region has a sizeable share of federal workers, so has Metro’s ridership.  Metro serves major federal employment centers downtown, and even boasts stations named for the federal sites they serve, like Federal Triangle, Medical Center, and Pentagon. But while Metro has a long supported the federal government, it’s a myth that Metro is all about federal government commuters and nothing more. Federal workers are a minority of riders and have been for years, and federal funding is playing an increasingly smaller role in Metro’s finances.

So just who are Metro’s federal customers?  When and what do they ride? Where are they coming from and going to, and how has this changed in the last decade? The next series of posts seeks to answer just that, using passenger survey data (bus and rail) where customers identified as employees of the federal government or not (contractors excluded).

How Many, Where, and When? About 27% of all Metro weekday trips are made by federal workers – a total of 317,000 boardings across bus and rail.  These federal employees can be anyone from a nurse at Walter Reed Medical Center, to a military officer at the Pentagon, to a Congressional staffer on Capitol Hill.  The majority of these trips (255,000) are made on Metrorail, where federal workers make up 35% of all boardings (all-day).  The remainder – just over 60,000 boardings from federal workers – happen on Metrobus, where riders are generally less likely to be federal workers (14% of all bus boardings are federal).

Pct Fed Workers by Mode and Period Read more…

Beyond Rush Hour – Taking a Peek at the Off-Peak

November 18th, 2015 3 comments

Metrorail ridership isn’t only about rush hour! Here’s a deeper look at why off-peak riders travel, and what segments are most traveled.

You may not be surprised that the peak period travel on Metrorail is dominated by commuting and business related trips.  Every day from opening to 9:30am, nearly 90 percent of passengers travel to work and business.  However do you know that over almost a third of daily ridership takes place in the off peak?  This post explores what is happening during weekday off-peak periods.

The weekday “off-peak” time typically refers to the weekday midday period (9:30am to 3:00pm) and the weekday evening period (from 7:00pm to closing), excluding late night service on Friday and Saturdays between midnight and 3:00am. In recent years, weekday off-peak travel demand has remained stable at 32 percent of the daily ridership, with the midday ridership at 19-20 percent and the evening ridership at 12 percent.

Most non-work trips, such as personal, recreational, and shopping trips, occur during the off-peak times and are spread fairly evenly between the midday and evening, as illustrated in Figure 1. 

blog figure

Figure 1: Percentage of Non-Work Trips by Time of Day (2012 Metrorail Passenger Survey)


The off-peak, non-work travel market has showed strong growth between 2007 and 2012 (our last two passenger surveys where we can distinguish between work and non-work travel). According to the Metrorail passenger surveys, off-peak non-work trips grew by 15 percent for the midday and evening from 2007 to 2012, higher than the 9 percent increase in the daily non-work trips. Read more…

Prioritizing Bike and Pedestrian Station Access Projects Near Metrorail

November 1st, 2015 Comments off

We all know improving station access is good.  But, how do we rank access projects relative to each other?   Step 1: Ridership

In our recent post, we gave you an overview of our Station Access Investment Strategy project.  We’ve identified 1,000s of recommendations for new pedestrian and bicycle infrastructure near our Metrorail stations and need a way to prioritize them.  After some thought, we’ve come up with a number of potential criteria.  In this post, we’ll discuss those that deal with ridership.

July 2014 Post on Ridership Potential from New Ped./ Bike Projects

Map of the Southern Ave walk shed from July 2014 Post on Ridership Potential from New Ped./ Bike Projects

Once again, one of key concepts we’ve been telling you about in recent months is that by improving access to stations we can grow ridership.  For stations with relatively small walk sheds, we’ll conduct a detailed analysis of what happens to the walk shed when the proposed projects are built.  For example, add a sidewalk at Cheverly and the walk shed will grow by X%.  We will then look at the amount of households and jobs in the newly connected area and, using some methods we’ve shown you in other posts, calculate the potential ridership gained by the new project.  The higher the potential ridership gain, the better the project scores.

But, we also want to understand the value of a new project to a part of the station that is already connected to the network and how this could relate back to ridership.  To do this, we’ve come up some other metrics.  They include: Read more…