As Fiscal Year 2015 drew to a close last month, we figured it’s time to take the long view: how did ridership do this year?
On the whole, for an average weekday over the last year:
- Rail ridership was up by 1.5%, in part due to the introduction of the Silver Line.
- Bus ridership was down by 1.4.
- Rail ridership was up largely due to the federal government shutdown in October of FY14.
- Metrorail had a good fall and winter, while Metrobus started the fiscal year well but struggled in the winter and spring months.
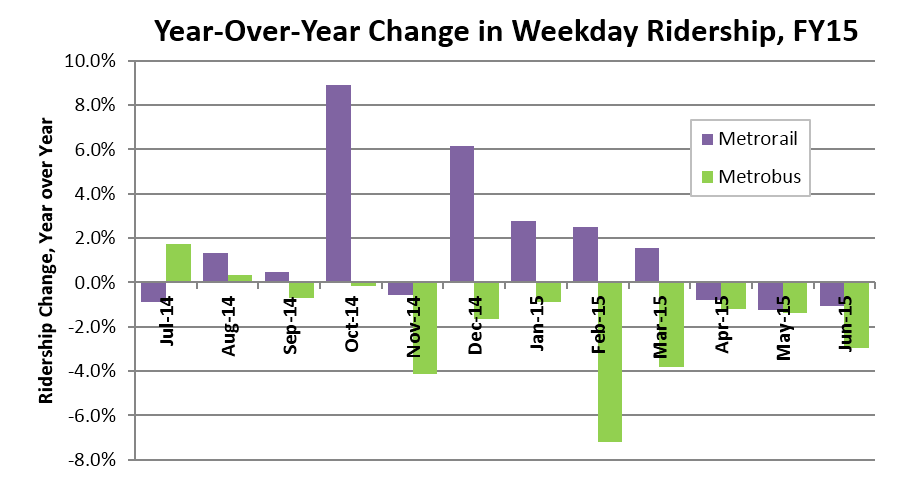
Seasonal Trends. All changes in ridership are best shown as a comparison to the same time last year, because ridership rises and falls as the seasons change. Traditionally, ridership is lowest in the winter, and peaks twice: one in late March/early April for the Cherry Blossoms, and then again in June and July when tourists and outdoor activities are in full swing. August is usually slow, and then ridership levels stabilize again in the fall. Read more…
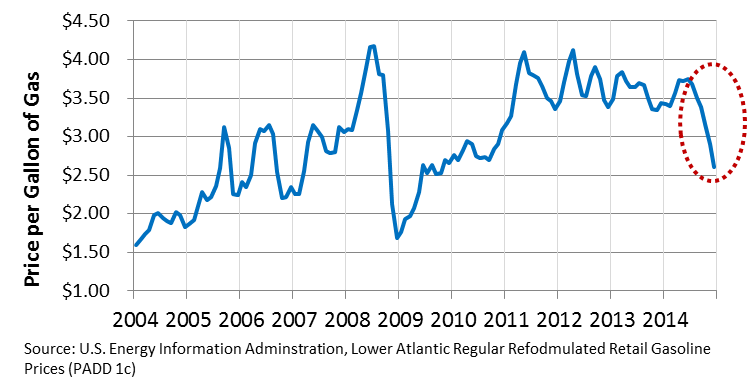
As gasoline prices drop and commuters feel less pain at the pump, do they drive more and take Metro less? The short answer is maybe, but not much.
In recent months, gasoline prices in the Washington region have dropped by over a dollar per gallon, to a near-record low of around $2.50 per gallon. Here’s how gas prices have changed in the last 11 years (unadjusted for inflation):
Below is a simple scatter plot comparing those prices to bus and rail ridership to gasoline prices, by month, for the last 11 years. It shows that gas prices have a very small, nearly negligible, effect on Metro ridership. The relationship is essentially zero for Metrobus, and barely detectable on Metrorail as a whole, as pictured below. The link is best with off-peak rail ridership (R2 = 0.24) compared to peak ridership (R2 = 0.09), suggesting that off-peak Metrorail riders are most sensitive to gas prices. (Not pictured.) Read more…
Ridership patterns on the Silver Line show that Metro’s new line is serving a truly regional market.
Now that school is back in session, the new Silver Line just completed its first full week where “normal” travel patterns are beginning to emerge. Ridership is strong, but where are these new passengers going? The diagram below shows destinations of all riders entering a Silver Line station in the week of September 8-12, 2014.
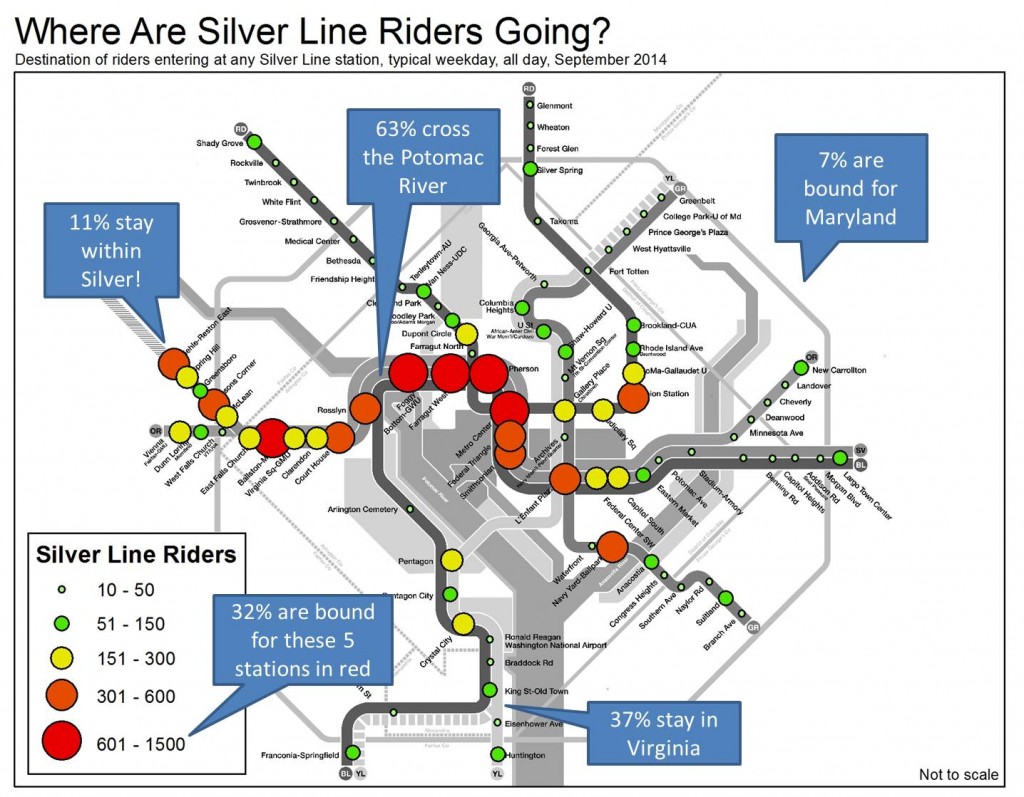
Some observations emerge from this: Read more…
After just two months, ridership on the Silver Line is off to a solid start: Wiehle Ave is already over projections, reverse commuting is strong, and more.
Now that school is back in session and most summer vacations over, here is an in-depth look at the week of September 8-12, 2014, when “normal” routines may have begun to emerge.
At around 15,000 entries per weekday, the Silver Line is off to a solid start. Compared to the official projections from the 2004 Final Environmental Impact Statement (FEIS), we are achieving about 60% of the ridership projected for the end of the line’s first year:
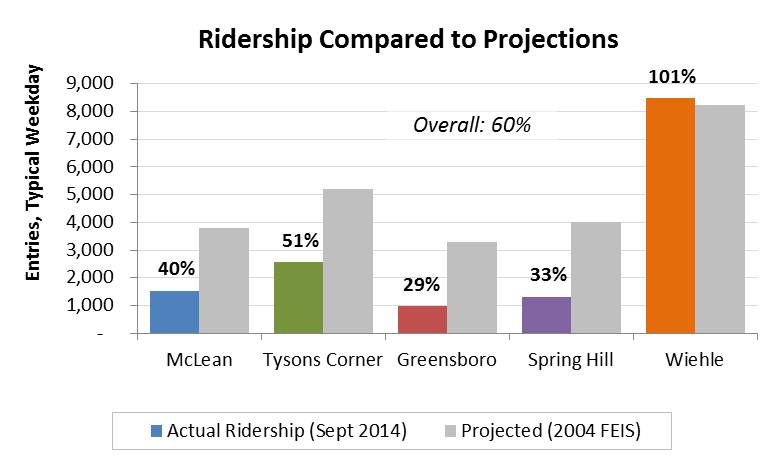 Wiehle station is already over opening-year projections and shows the highest ridership of all the new stations. Tysons Corner station is strong as well, but we still have room to grow at all four stations located in the Tysons area.
Looking at ridership by time of day shows the Wiehle is a commuting powerhouse, but also that a strong reverse commute market is emerging at the other stations:
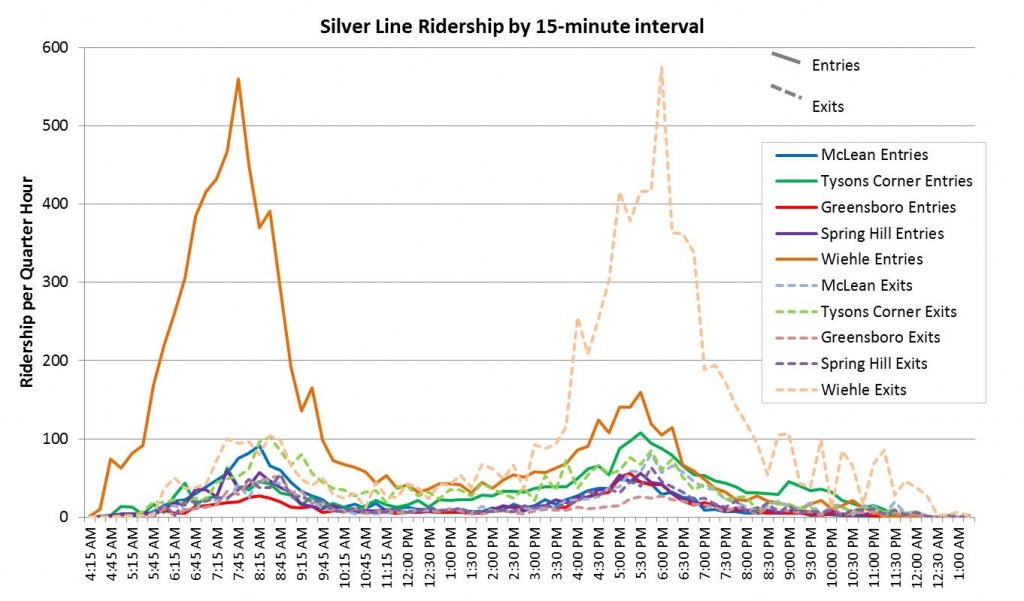
- McLean (in blue) is showing an early lead as a a “traditional” commute station, where most riders enter in the morning.
- Tysons Corner is much more dominated by reverse commuters, and its morning rush extends into mid-morning (around 10:00am). Evening ridership at Tysons Corners is also heavy. (More on off-peak ridership at Tysons coming soon)
- Greensboro and Spring Hill show relatively light ridership so far, but ridership is expected to grow over time as development catches up with the new station.
What do you think? Have you taken the Silver Line on a weekday? What was your experience?
The raw data by quarter-hour interval underlying this analysis is available in two formats: by station alone (2MB, .xlsx), and by origin-destination station (3MB, zipped tab-delimited .txt).


Recent Comments