Posts Tagged ‘rail’

Metro 2025 Means Business – Lots of it…

February 4th, 2014 1 comment

Without Metro 2025, the region might give up more jobs than the current size of 80 of the nation’s 100 largest downtowns.

One way to alleviate congestion – limit transit funding and stymie job growth!

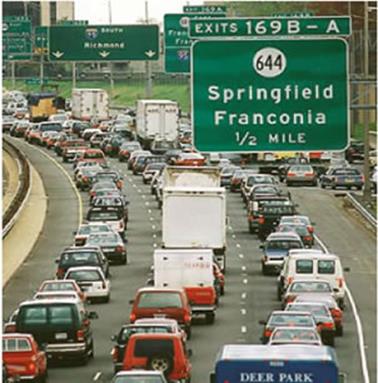
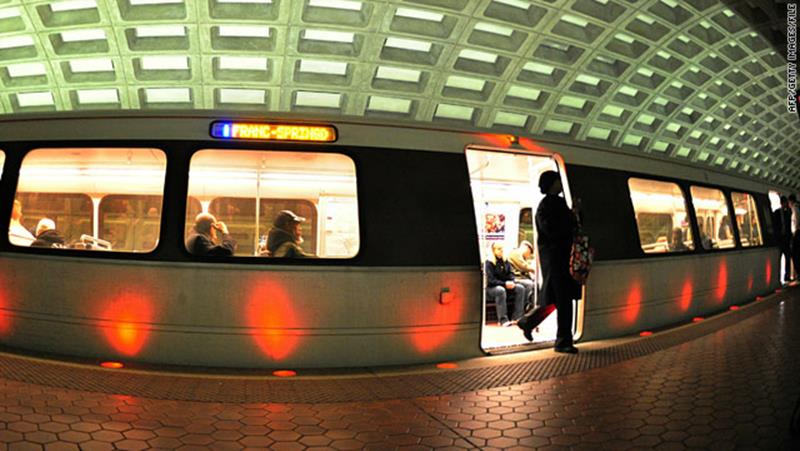
The Washington, D.C. region earned in 2012 the unfortunate honor of being named the #1 region in the nation – for congestion. For the workers in this region this comes as no surprise, as seemingly endless “volume delays” litter our evening traffic reports, commuters spend more than a full week and a half sitting in traffic each year, and even the public transit network – primarily Metrorail – is so crowded that commuters often have to wait for multiple trains just to squeeze onto the system. And unless proposed transportation investments keep up with projected household and job growth – MWCOG projects that the region will add 1.6 million jobs by 2040 – these commutes are only going to become more painful.

We all know that the high price of congestion is in the billions of dollars per year, a figure that would be even higher but not for transit’s impact has in reducing the region’s congestion by 10 to 15 percent, saving commuters time and money stuck in traffic, and preventing the need to build hundreds of thousands of new parking spaces and 1,000 additional lane miles of roads.

But that price pales in comparison to what may be if we don’t act now to make meaningful improvements to the regions congestion-reducing transportation infrastructure, especially in programs like Metro 2025. Turns out that we now know that when regions exceed 35 to 37 hours of delay per commuter per year – about four and a half minutes per one way free flow trip – regional job growth begins to slow. That means that expectations of continued economic growth in the region are a lot less rosy when we consider that we currently run about 72 hours of delay per commuter per year – and rising. And before you dismiss this as planning theory, remember that Hewlett Packard showed Atlanta and the nation in 1998 that congestion’s negative impact on employment growth can be economic fact. Read more…

Singapore MRT Rail Map Diagrams Show the Way

January 27th, 2014 2 comments

Picture 040

Paya Lebar MRT Station Map (click & zoom for detail)

Picture 041

Travel Times Between Stations

While waiting for a Metro train one day in Singapore, I noticed their rail map diagram had a big white space and then the rest of the map. Upon closer inspection the ‘white’ part was actually a grayed out part of the rail map showing the route the train had already covered. Having that information is very useful, particularly for a traveler unfamiliar with the system. One knows if they are starting at this particular station (Paya Lebar), what their options might be if he/she actually wanted to go in the opposite direction. This information gives the rider a helpful reference point in relationship to the rest of the system.  Also upon closer inspection I saw that the map gave expected travel times between stations. How great is that?

Categories: Transit Travelogue Tags: ,

PlanItMetro at Metro Hack Night

January 23rd, 2014 Comments off

I was invited to present a wide variety of data visualizations featured on the blog at a recent meeting of transportation techies.

I had the honor of being invited to present at the 2nd meeting of the Transportation Techies Meetup group, Metro Hack Night on January 2, 2014.  I used this opportunity to illustrate some of the data visualizations I’ve developed using Metro data and talk a bit about the technology behind them.

The first was the the visualization of 9 years worth of rail ridership data.  This visualization was created in D3 (“data driven documents”) using code originally developed by “mbostock” posted on the D3 examples page.  D3 is a javascript library that allows the creation of really powerful and interactive visualizations.  The downside of D3, as I noted, is that the code itself can be confusing and hard to follow.   So much of learning a new coding language is looking at what others have done and learning from it.  D3’s simplified notation makes it really hard for me to follow.  (NOTE: this visualization has recently been updated to include daily Metrorail ridership for all of 2013.)

The second was the visualization of one day of Metrorail station activity.     This video was created using Processing, a Java-based visualization tool that takes care of a lot of the coding “grunt work” and allows a programmer to focus on the data and the visualization.  I really enjoy Java so I took the opportunity this project provided to add a few flourishes such as a clock face and “sunrise” and “sunset.”  Read more…

Categories: Engage Tags: , ,

Silver Line Already Spurring Massive Development

January 16th, 2014 Comments off

In anticipation of the Silver Line, nearly twenty development projects, with an estimated value of more than $18 billion, are underway near the Metrorail stations,  helping attract riders and generating valuable benefits for Fairfax County.

Anticipating the Silver Line, 20 development projects are underway around the new stations

Ahead of the Silver Line, many development projects are underway around the new stations. Image from Cushman and Wakefield, click link at left for full report.

In a new report, the real estate firm Cushman & Wakefield documented twenty real estate development projects “in the pipeline” near the five new Silver Line stations. Some are under construction now, others are in the approvals process, and a few are on hold, but together they total:

  • Over 20 million sq. ft. of new office space, which would increase the total office space in the Tysons area by 40%.
  • Over 2 million sq. ft. of new retail space. That’s more than twice the size of the Tysons Galleria mall.
  • 17,800 new residential units, or more than double the current population of the Tysons area.
  • 9,300 hotel rooms

Metro estimates that these projects are valued at more than $18 billion, and will generate millions per year in tax revenue for Fairfax County (estimated using industry-standard construction costs). Some of this tax revenue will be captured by special tax districts in the Tysons and Silver Line areas.  In 2011, we estimated that Fairfax County received around $30 million in tax revenues from properties within a half-mile of its five existing non-Silver stations.

The development brings great benefits to Fairfax County and will encourage riders to use the Silver Line, but there remains a strong need to improve the walking and biking environment near the new stations. Pedestrian and bicycle access will be key to meeting our ridership goals for the new Metrorail line, but walking and bicycling conditions remain challenging in the area.


Categories: In The News Tags: , ,

Courtesy Messages – Singaporean Style

January 13th, 2014 1 comment

I was recently in Singapore for vacation and while I was there I used their delightfully clean and efficient rail system (more on that later). While walking through the stations, I spotted several movie posters, which actually happened to be posters for YouTube-based public information message ‘movies’. The movies are put out by the Land Transport Authority, which is a part of the government that does the planning for their transit systems.

Picture 110

‘May I Have a Seat Please?’

Picture 109

‘Can You Move in Please?’

Can you move in please? leaves viewers with two messages: 1. move to the back of the bus so that everyone can get on, and 2. take off your backpack or move any bags you may have out of the way. Some of the movie is lost in translation I think culturally speaking but still, you get the point.

Excuse me, May I have a seat please? is about exactly what the title suggests. This movie especially rings true in this day and age as a lot of commuters have their noses buried in their books and cell phones (even more prevalent in Singapore – a lot of people walking in stations and outside while watching movies!!).

The courtesy issues that Singapore is tackling rings true here in DC too, as well as any city that has transit.

Why isn’t Metro looking at a line to [insert address here]?

December 20th, 2013 10 comments

[Editor’s note: this will be our last post of 2013.  We look forward to seeing you again in early January.]

You name it and we tested it as part of our analysis and development of the Regional Transit System Plan (RTSP). Here’s the comprehensive list of what was analyzed.

List of Transit Corridors, Projects, and Plans Analyzed as Part of RTSP

List of Transit Corridors, Projects, and Plans Analyzed as Part of RTSP

We have received tons of great comments on the proposed 2040 network of Metrorail and high capacity surface transit corridors. Many of you have said that we missed <insert corridor here> or have asked why we don’t have a line to <insert address here>. As part of this plan, we have analyzed almost every corridor or mode that you have identified. However, we recognize that most of it was behind the scenes and is buried deep in our posted presentations to the Technical Advisory Group (TAG).

Above is a list of what was analyzed before we unveiled the proposed 2040 Metrorail Network and regionally significant high capacity corridors. Better yet, here is a document that shows the Metrorail lines and other surface transit plans, projects, and strategies that were tested over the course of the project. Everything is listed and where possible, maps and graphics are provided to illustrate what was tested. All tested items were measured against a comprehensive set of measures of effectiveness (MOE). The MOEs assessed ridership, impact on core capacity, transfers, reduction in vehicle miles traveled (VMT), mode share, etc.

To wet your whistle, below, check out the Beltway Line that was tested. Only the segments that crossed the American Legion Bridge (between White Flint and Dunn Loring) and the Woodrow Wilson Bridge (between Branch Avenue and Eisenhower Avenue) had some promise and therefore, they continued on in the analysis, though as surface transit not Metrorail. The other segments did not provide good ridership, primarily due to the low densities within a walkable distance from the Beltway, and had little impact on Metrorail core capacity.

Alignment of a Beltway Line that was tested in the RTSP

Alignment of a Beltway Line that was tested in the RTSP

Let us know what you think!

More than Metrorail: The Region’s Most Important High-Capacity Surface Transit Corridors

December 19th, 2013 14 comments

In parallel with the proposed 2040 Metrorail network, we have identified 25 regionally significant corridors that merit high-capacity surface transit by 2040. Depending on the corridor, high-capacity surface transit can be provided more efficiently and effectively by modes other than Metrorail.

The best transit systems in the world are comprised of large networks served by multiple modes. In the National Capital Region, due to the growth and dispersal of activity centers, the high demand placed on Metrorail, and the realities of transit funding, expanding the transit network needs to occur by expanding transit on the region’s roads and highways not just by Metrorail. Metrorail is not and cannot be the best mode for every corridor because the vast majority of corridors do not have the land use, density and ridership to support it.

But don’t despair! There are plenty of other high-capacity modes such as bus rapid transit (BRT), light rail (LRT), streetcar, and enhanced bus that can provide:

  • high-frequency;
  • all day service;
  • large, comfortable vehicles; and
  • lower capital and operating costs than Metrorail.

Regionally Significant High Capacity Surface Transit Corridors as part of 2040 Regional Transit System Plan

Regionally Significant High-Capacity Surface Transit Corridors as part of 2040 Regional Transit System Plan

Read more…

Survey Analysis Details Non-Work Trips on Metrorail

December 17th, 2013 10 comments

Almost one in five trips on Metrorail are NOT work-related. Who is making these trips, and where and why are they making them?

Woodley Park-Zoo 042511-131

Metrorail is how many of us in the region get to work.  But, as we will illustrate below, many of us also use it to do other things.

Using data from the 2012 Metrorail Passenger Survey, we were able to determine that about 125,000 or 17% trips on an average weekday do not involve travel either to or from ones’ place of work.   This is virtually identical to the results from the 2007 survey.  In order to understand how people use the system for non-work trips, we sorted out everyone who is either going to or coming from work from everyone else.    For example, a trip stopping off at the store after work would not be counted; however, a trip starting out at home and traveling to school would be counted.  In terms of where these non-work trips are going, most are returning home followed by “personal trip” and “shopping or meal.”  

Work-Non-Work-Pies-01

Read more…

Significant Property Tax Values Generated near Metro Stations

December 12th, 2013 Comments off

New buildings right near Metrorail stations are 23-30% more valuable than buildings farther away, showing that our funding partners can generate significant property tax revenues from Metro.

A recent study shows that Metrorail stations in Arlington’s Rosslyn-Ballston corridor are powerful anchors for economic development and value. The report, by the real estate firm Cushman & Wakefield, showcases the substantial value the region can realize with good transit-oriented development policies near stations. Among the report’s findings:

Offices in the Rosslyn-Ballston corridor right near Metro command higher rents.

Offices in the Rosslyn-Ballston corridor right near Metro command higher rents. Source: Cushman & Wakefield via washingtonpost.com.  Click for original context.

  • Being able to walk to Metro is worth a lot. New office buildings within 500 feet of a station in Arlington’s Rosslyn-Ballston corridor are earning a 30% premium over buildings under construction just a quarter-mile away. For apartment buildings, the premium is 23%. No wonder walk access to Metrorail is on the rise, especially from those close by the station!
  • 92% of over 20 million square feet of office space under construction in the Rosslyn-Ballston corridor is within a quarter mile of a Metrorail station.
  • Conversely, new office buildings built farther than a quarter-mile from Metro are worth 18% less in rent.

These “rail premiums” of 23-30% are significantly higher than the 7-9% we found in our “Business Case for Transit” study, because of several significant differences in methodology. We looked at the assessed value, not the market/rental rate of property. Also, we looked at all properties in the region, rather than just those under construction in one corridor.

Although the presence of Metrorail creates this value premium near stations, Metro does not receive any of these revenues directly, even though continued rebuilding and improvements are needed to address state of good repair and relieve capacity issues in the corridor.

Nevertheless, this report certainly confirms that Metrorail increases property tax revenues, and shows just how big that value can be in certain markets.

Proposed 2040 Metrorail Network

December 5th, 2013 91 comments

Step right up and check out the proposed 2040 core Metrorail configuration with new Blue and Yellow Lines and a third line in Virginia!

Proposed 2040 Metrorail Core Configuration

Proposed 2040 Metrorail Core Configuration

Proposed 2040 Metrorail Network

Proposed 2040 Metrorail Network

What does this network do? The proposed rail network shown above is expected to reduce future crowding on Metrorail, provide enough capacity for future development, and expand the reach of transit in the region, especially to regional activity centers.

Why are we proposing it? This rail network is part of the 2040 Regional Transit System Plan (RTSP). Its purpose is to develop the rail and surface transit network for 2040 that meets the needs of the growing Washington DC region.

What else have we considered? About a month ago, we posted about some of the possible long-range changes to the Metrorail core that we are considering as part of the RTSP. We analyzed four different core configurations, gathered your comments, and the final configuration for the core is shown above. As many of you commented, it is a combination of two of the scenarios (Scenarios B and C).

Next Steps: The next and final step for the RTSP is to use this configuration, along with the high capacity surface corridors, to conduct a final round of analysis. The output will provide us with information on ridership, mode share, levels of crowding, transfers, etc. and ultimately a final network for 2040.

Let us know what you think!

A few extra notes:

(1) The Metrorail network shown in this post will be layered with an extensive high capacity surface transit network to expand transit and meet the needs of employment and population growth in the region.

(2) For the plan to have validity and acceptability across the region and within the federal planning process, it is based on the region’s adopted cooperative land use forecast for 2040. We used the Aspirations Land Use scenario to stress test the core of the system, but ultimately the plan needs to start with the region’s adopted land use. As follow on work to this plan, we will be testing different land uses to see what else we can learn to improve long-range plans.

(3) All of the lines shown, as well as all of the high capacity surface transit corridors, will need corridor studies, alternatives analyses, and full engineering studies. This cannot be done at a regional level, but would need to happen on a project by project, line by line level. So, while we are showing a new Blue Line on M Street, it very well could be on N or P Streets.