Though many of the stations that Metro 2025 seeks to improve are in the District of Columbia, the capacity expansion would help riders from all jurisdictions.
Metro needs to improve the capacity at over a dozen stations: some of these stations are at capacity today, and our 100% eight-car train program will bring even more customers to already crowded stations. We know we need to build new escalators, expand mezzanines, and build pedestrian passageways to meet this future demand.
The fact is that Metro 2025 is designed to benefit the Washington metropolitan area, residents of the District, Maryland and Virginia, as well as visitors from around the country and the world.
If you’re a commuter in Maryland or Virginia, it may look like the benefit of these improvements are focused on D.C. residents. After all, 10 out of the 15 stations are located in the District of Columbia. But the diagram below shows most of the riders who use these stations – those who create the need today, and who would benefit from fixing it – live in Maryland or Virginia. In fact, 77% of the users of the Metro 2025 stations live in the suburbs.
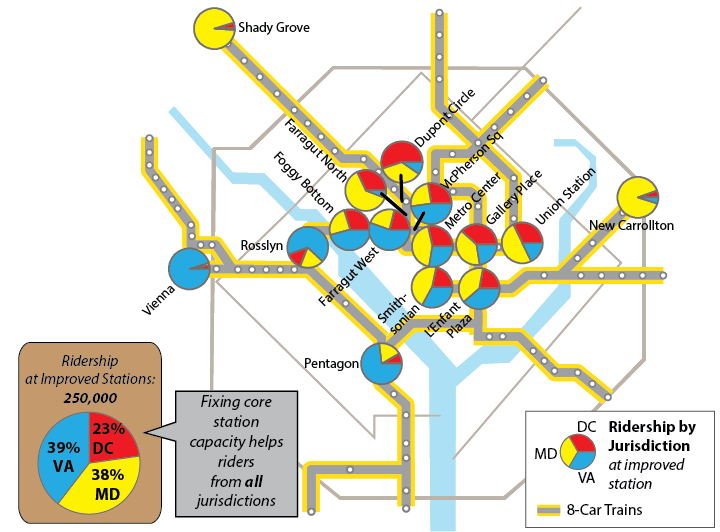
Fixing core stations in Metro 2025 helps riders from all jurisdictions
Help us make the Metro 2025 projects in Momentum a reality! Learn more about Momentum, call on your elected representatives, and endorse the plan.
Metro will soon be measuring how much growth happens in places that are walkable to transit. Here’s an in-depth look at how we define “walkable” to Metrorail stations and Metrobus stops.
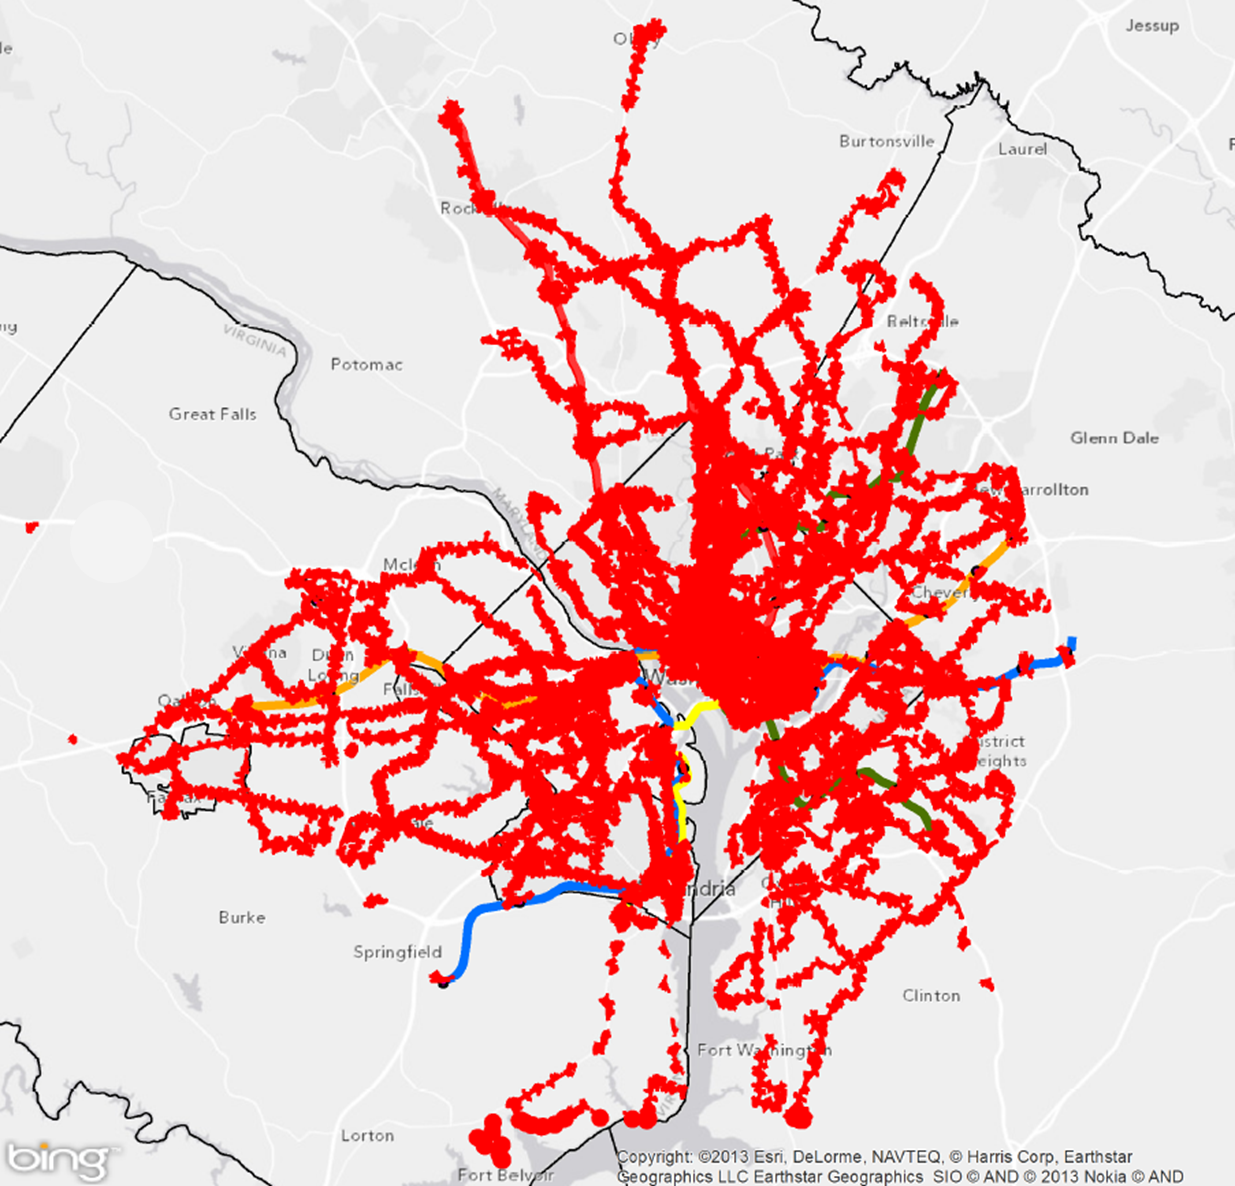
Areas reachable on foot from regional Metrobus stops and Metrorail stations
Metro’s new Connecting Communities metric will measure annual household growth in our region that occurs within the “transit shed” – the catchment area around transit service that generates walk ridership. And improving walkability can be an incredibly cost-effective way to reduce congestion and increase transit ridership. Let’s take a closer look at how we defined what’s “walkable to transit.”
How Far is Walkable? First, we defined walking distance as a half-mile from Metrorail, and a quarter-mile from Metrobus, for a number of reasons:
- Of all the passengers who walk to Metrorail each morning, the median walking distance is just under a half-mile (0.35 miles, actually). Riders walk farther to some stations than others, but the systemwide average is just shy of a half-mile. Since rail riders are on average willing to walk a little under a half-mile today, it is reasonable to use a half-mile as an upper limit for walking in the future. (We don’t have similar survey data on Metrobus – yet.)
- The land use within a quarter- and half-mile is where we see the strongest effects on ridership on Metro today. More on this below.
- Academic literature supports the half-mile radius from rail transit as no better than any other distance, particularly for the link between households and ridership.
- Practically, setting the distance any farther than 0.50 and 0.25 miles increases overlap with other nearby stations and bus stops, which increases computational complexity. Read more…
The region either already has or is planning for a variety of different modes. How do they compare? 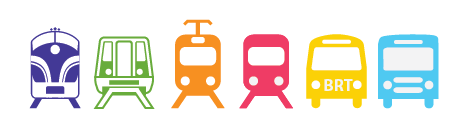 The Silver Line will soon open as a Metrorail line. Later this year, a streetcar will be operating on H Street, NE with others planned for Columbia Pike in Arlington and the District. Arlington and Alexandria are jointly building a bus rapid transit (BRT) line between Crystal City and Potomac Yard. Once funding is finalized, Maryland will build the Purple Line and light rail transit (LRT) will connect New Carrollton and Bethesda. This is all in addition to the region’s existing commuter rail, commuter bus, Metrorail, Metrobus, and MetroExtra services. The region is not only expanding transit services, but it also expanding the types of transit modes that will operate. At long last, instead of talking about Portland (streetcar), Jersey City (light rail), or Cleveland (bus rapid transit), we’ll be able to point directly to services and infrastructure in our backyard or take a trip and experience the pros and cons of these modes for ourselves.
So how do the different modes compare? What kind of purposes does each serve? There are many external factors and trade-offs that influence how agencies and jurisdictions select which mode to implement. As we see from the ongoing debates in jurisdictions across the region between LRT and BRT or streetcar and enhanced bus, there is not always one perfect choice. However, an array of transit and land use measures can provide context to the conversation. As part of ConnectGreaterWashington: The 2040 Regional Transit System Plan, we developed the below table to compare commuter rail, commuter bus, heavy rail, light rail, streetcar, bus rapid transit, and enhanced bus across land use intensity (households and employment), vehicle capacity, stop spacing, trip length, and capital and operating costs.
What do you think? Does this information better inform the rail vs bus debate? What other information would provide more clarity on what modes work where?
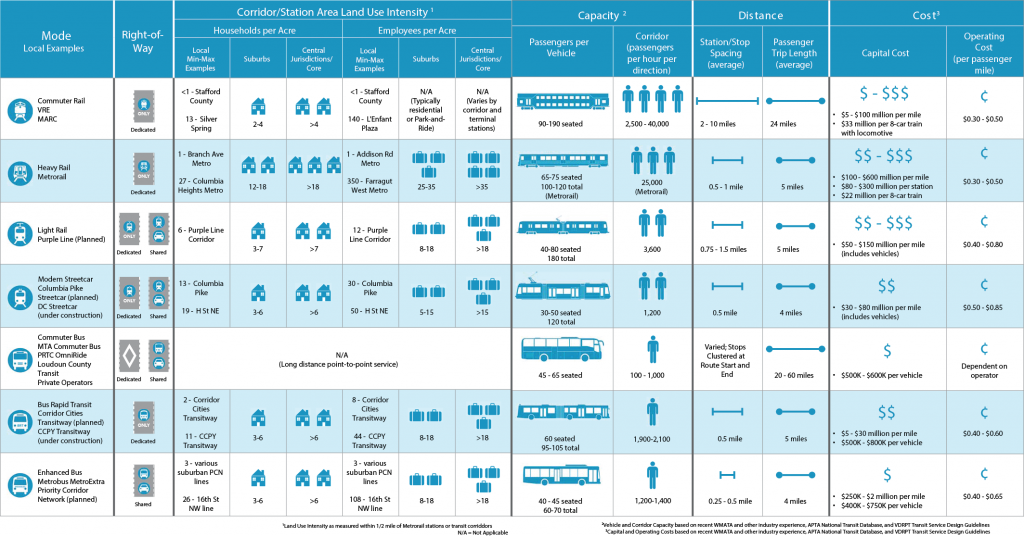
Comparison of High-Capacity Transit Modes
 Bike to Work Day is Friday, May 16th, and this year Metro is hosting three pitstops at Metrorail stations. Bike to Metro and Metro to Work! Register now.
If biking all the way to work sounds a bit daunting this year, Bike to Metro and Metro to Work! Leave your bike at a Metrorail station or a bus stop.
Metro is hosting three pitstops at Metrorail stations, where we’ll be distributing t-shirts, maps, information about parking your bike, bikes on bus, locker rentals, and of course – free goodies. In addition, Metro Transit Police will be at all three pitstops distributing free U-locks to cyclists who register their bikes. We’ll even have a “bike rack demonstration” bus so you can try using the bike rack on buses.
Register now at www.biketoworkmetrodc.org, and enter your pitstop as one of the stations above!
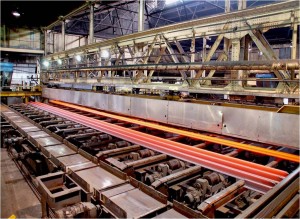
Rail Fabrication Process at ArcelorMittal, Steelton – Image Courtesy of ArcelorMittal
On a daily basis the Metrorail track infrastructure system is subject to the stress and strain of operational and climatic variations. Combining a proactive maintenance program with the latest in rail materials and technology, Metro upholds a commitment to the highest levels of system-wide safety, passenger comfort, operational sustainability, and reliability. System maintenance under the Federal Transit Administration State of Good Repair program has allowed Metro to maintain its commitment to an aggressive “fix it first” policy that features:
“New” Rail is 100% recycled steel – For all replacement rails Metro uses a premium head-hardened rail made from 100% recycled steel. These rails are the highest possible quality available and have the longest possible service life. The rail is fabricated using a controlled water jet system that evenly dissipates heat during the fabrication process to create deep, head-hardened layers through each rail.
Continuously Welded Rail increases system efficiency– Using a state-of-the-art flash-butt welding system Metro has a system-wide program of rail joint elimination to improve ride quality and cut service disruptions. Flash-butt welding applies a strong electrical current to the touching ends of two sections of rail. The ends become white hot due to electrical resistance and can then be fused together to form a single rail. The new continuously welded rail is strong, gives a smoother passenger ride, and allows trains to travel with less friction – thereby increasing system efficiency.
Through Metro’s comprehensive rail-infrastructure maintenance program, upgrades are put in place for the future of the system and transit in the region.
This post forms part of a series featuring content from Metro’s Sustainability Agenda, part of Metro’s Sustainability Initiative.

Wayside Storage Battery Power System
For more than 20 years, Metro’s rail cars have captured and reused some of the electric energy that would otherwise be wasted when they brake through a process called regenerative braking. This process converts the excess kinetic energy, as the vehicle slows, to electric energy which can be stored and reused for propulsion power. Building on this technology, Metro recently completed tests to capture and utilize even more of the energy during braking through wayside battery storage.
The pilot project tests the energy storage efficiency and return on investment of a wayside Battery Power System (BPS). The BPS uses an innovative nickel-metal hydride battery that is characterized by low internal resistance. As a consequence, the battery can charge and discharge in a matter of seconds, making it perfect for wayside applications where rapid storage and discharge of propulsion power is required. Through this BPS storage system, the kinetic energy that would previously have been dissipated as waste heat can now be productively reused to power railcars and reduce overall energy consumption. Read more…
Yesterday, as everyone recovered from a snowstorm, here’s what happened to Metrorail ridership.
After Monday’s snowstorm, yesterday the federal government in the Washington region issued a two-hour delayed opening, and many schools opened with a delay or remained closed. Metrobus began the morning operating on a snow emergency plan, but by afternoon had restored full service. Here’s what that meant to Metrorail ridership:
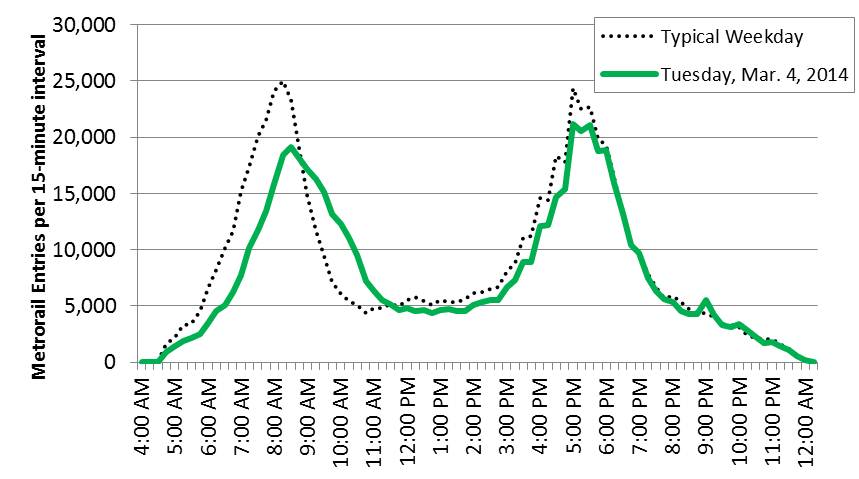
Metrorail ridership on Tuesday, when the federal government and many schools opened with a 2-hour delay.
Note: the prior Thursday (Feb. 27, 2014) stands in as a typical weekday above, for comparison.
It looks as if the apex of the AM peak period occurred 15 minutes later than usual. Many riders appeared to delay travel in the morning, resulting in a much more gradual end to the morning peak.
How was your commute different on March 4?
This data is available for download (.xlsx, 13kb).
During the National Cherry Blossom Festival, Metrorail ridership increases on average by 7% on weekdays and 50% on Saturdays.
Metrorail ridership is impacted by a variety of factors, from special events to weather to government shutdowns. One event that brings visitors to the region — and to Metrorail — in droves is the annual National Cherry Blossom Festival. In anticipation of this year’s festival, we performed some analysis on how, when and where the blossom viewers impacted ridership on the Metrorail system.
In general, Metrorail ridership increases on average by 7% on weekdays and up to 53% on Saturdays during the festival. On days with nice weather, ridership has increased up to 10% on weekdays and 70% on Saturdays!
As the figure below shows, during the weekdays there is no impact in the morning, a large (21%) increase of activity during the mid day and then a 7% increase thereafter.
Saturdays are another story all together. Ridership increases up to 63% during mid day and afternoon periods on days during the festival, with a total ridership increase above 50%. Even morning and “late” night ridership increases significantly during this period.
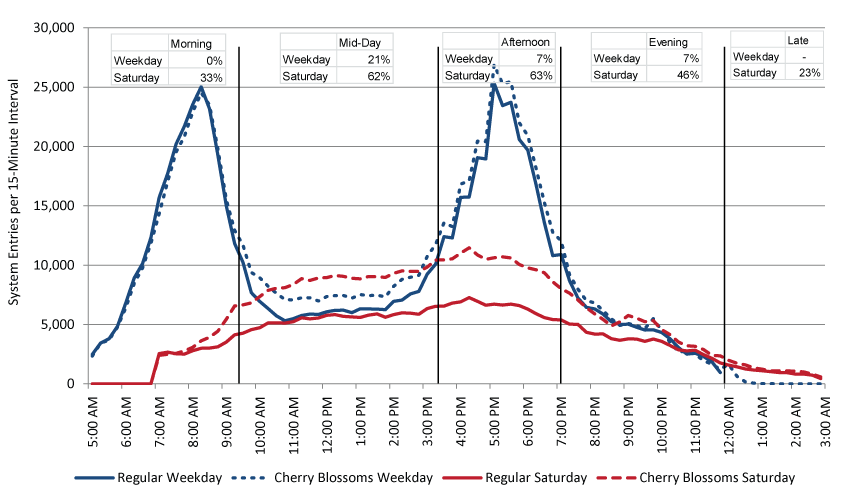
Metrorail system entries by quarter-hour interval, Regular Weekday, Cherry Blossom Weekday, Regular Saturday and Cherry Blossom Saturday. Click chart for larger version.
When looking at change in ridership by station in the maps below, some obvious conclusions can be drawn. Read more…
When it comes to impacting weekday Metro ridership, meteorologists are three times more powerful than the federal government.
Many factors influence Metrorail ridership, including the weather and the status of the federal government. As this assessment shows, extreme weather has a much bigger impact on Metrorail usage than the federal government closure for budget reasons.
In the past few months, the federal workforce was instructed to stay home for two different reasons. The first was the failed budget negotiation that resulted in the federal government shutdown in October of 2013. (We’ll call this “shutdown closure.”) The second was the winter weather forecast that closed federal offices in the Washington region. (Let’s call this “snow closure.”) These two separate government closures have had different impacts on Metrorail ridership.
First, take ridership by time of day. The graph below shows ridership by fifteen-minute interval for three days. The tallest, green line is the average of weekday entries. The other two are days that the federal government was closed due to the shutdown (Oct 8, 2013) and snow (Dec 10, 2013). Now, the purple line illustrates the ridership due to the budgetary shutdown in October 2013 and the blue line shows ridership on a federal snow day in December 2013. The purple line (budget shutdown) is not dissimilar to the green (average), but the purple line (snow shutdown) illustrates a huge ridership drop. Why would this be?
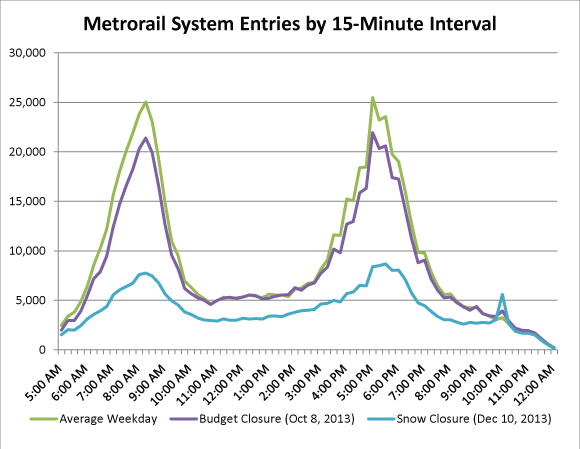
Metrorail ridership on an average day and two days the federal government was shut down. October 8, 2013 was part of the budget shutdown. December 10 2013 the fed was closed due to snow.
We can think of a few reasons for this difference.
- The budget shutdown only impacted SOME federal workers, i.e. those not deemed essential. Snow, however, impacts just about everyone.
- On snow days, area schools are often closed. Parents who have the luxury to do so sometimes stay home to look after their children who would otherwise be in school. Critically, parents who may be limited in child care options – many of whom are our customers – are especially vulnerable and often are forced to stay home because of the school closures.
- Washington is gradually evolving from a federal “company town” into a “boom town of the new economy,” a new economy less reliant on the federal government. Many of the businesses of the “new economy” were unaffected by the budget shutdown, but during extreme weather events take their cue from the federal government and give their employees the day off. According to Dr. Stephen Fuller of GMU’s Center for Regional Analysis, the Washington region is and will be “increasingly less dependent on federal spending as the driver of job growth and income generation in the local economy.”
Next, let’s look at change in ridership by station. Below are maps showing the change in ridership between a regular day and one of the government shutdown days: first budget shutdown and then snow shutdown. Read more…
About a third of Metrorail customers transfer between lines to complete their trip, and this is not too far off many of our peer transit agencies.
Everyone would prefer a “one-seat ride” (aka “transfer-free ride”) from origin to destination, but for many, transfers are a necessary part of commuting life. In fact, transfers may be even beneficial. Transfers are a part of nearly every large rail transit system with multiple lines, including Metro. As the chart below shows, 35% of Metrorail passengers change trains at some point during their journey, and that’s slightly higher – but not wildly different from – many of our peer transit systems in the U.S.
Read more…


Recent Comments