Metrorail has had a huge impact on the region, but as we’ve seen with the Silver Line, it can take decades to get from concept to execution.
One of the questions I hear most often as a planner for Metro is When will a Metro station open in xyz neighborhood, “in Georgetown”, or “at BWI”? It was the first question at the March Citizens Association of Georgetown meeting. My response — “Decades” — often elicits audible groans.
Given last summer’s opening of the Silver Line, we have a case study that can provide insight on how long it takes to plan, fund, and construct large infrastructure projects. The Dulles Corridor Metrorail Project has done a phenomenal job of maintaining a project timeline. Since the region has many recent newcomers, it is helpful to revisit many of the key milestones, as shown below. It is also helpful to remind readers that the Metropolitan Washington Airports Authority (MWAA) was the ultimate developer of the Silver Line (both Phases I and II) and that the project “only” required cooperation among the Commonwealth of Virginia, MWAA, Metro, the federal government, and Fairfax and Loudoun Counties. While just one example, the Silver Line’s long story is not vastly different from other mega-projects happening in the region and across the country.

Timeline for Planning, Environmental Process, Legal and Financing, and Constructing the Silver Line
Read more…
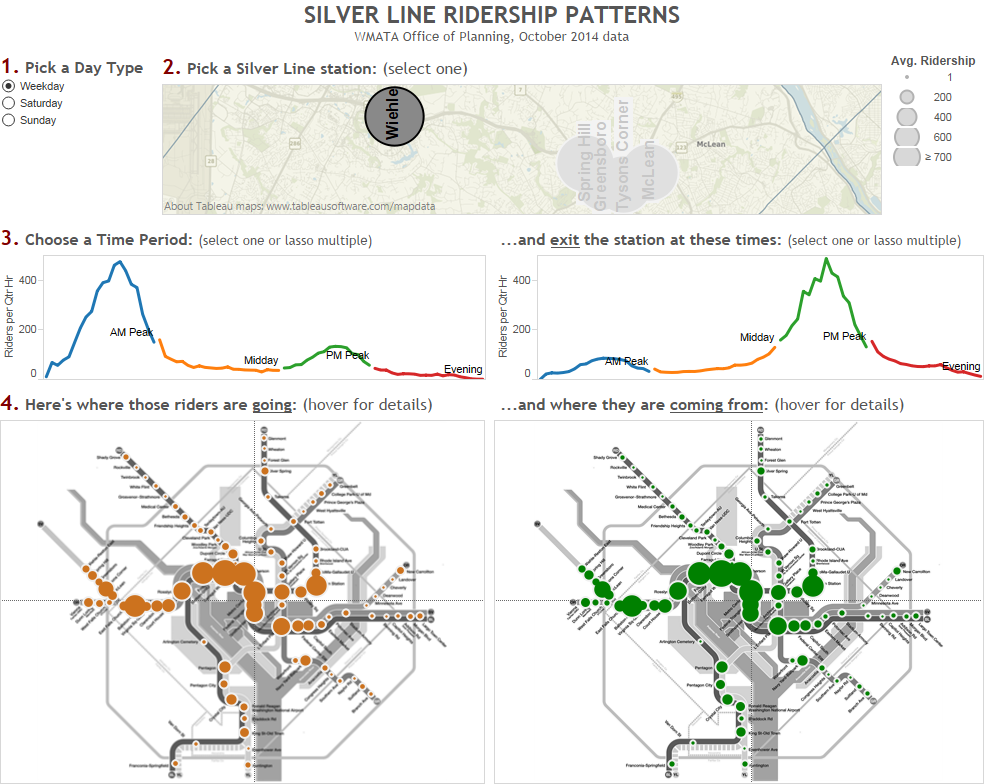
Learn about the travel patterns of Silver Line riders in rich, interactive detail with this new tool.
Click on the dashboard below to see where Silver Line rail riders are going, coming from, and by time of day and day type. This is simply a visualization of the October 2014 rail ridership data we recently posted. What patterns do you see? What jumps out at you?
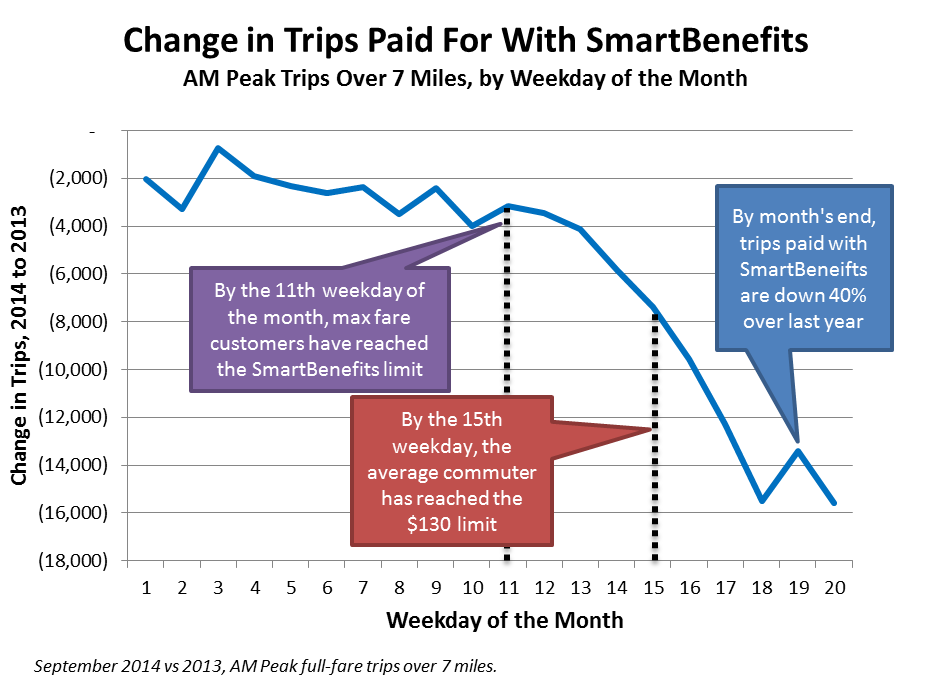
Many Metrorail riders now run out of SmartBenefits mid-month, and they may stop riding.
Since the federal transit benefit maximum dropped from $240 to $130 per month, about 25% of regular Metrorail commuters are running out of SmartBenefits to pay their fare before the month is over. By month’s end, trips paid for with SmartBenefits are now crashing by 40% over last year. Though a variety of factors explain recent decreases in Metrorail ridership, the transit benefit is a strong explanation as to why the losses are concentrated in the second half of the month. In fact, the biggest influence on ridership over the past year may be the cut in the federal transit benefit, and ridership might even be up by about 2% otherwise.
If we look at trips per day over the span of the month, and only at trips over 7 miles paid for with SmartBenefits, we see the drop closely coinciding with when riders run out of SmartBenefits. (Shorter trips can be fully funded by the current benefit amount of $130 per month.)
Read more…
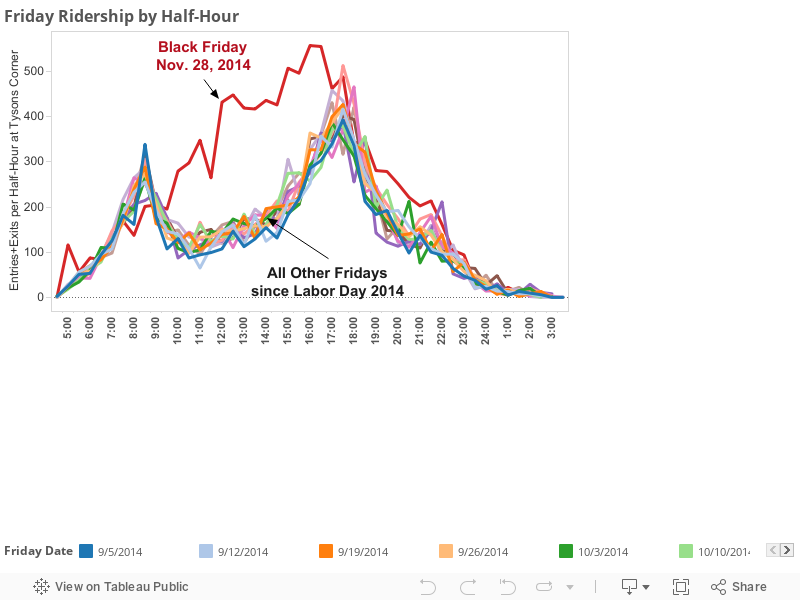
The day was the Tysons Corner Station’s busiest since the Silver Line opened.
Black Friday, the day after Thanksgiving, is traditionally the busiest shopping day of the year. As would be expected, ridership at Metro’s new Tysons Corner station skyrocketed on Black Friday this year. The station facilitated 10,800 riders entering or exiting over the course of the day, double its normal weekday volume of around 5,500. The chart below shows ridership at Tysons Corner by half-hour for all Fridays since Labor Day.
The day was the first sign of success for Metro’s partnership with Tysons Corner Center and the Tysons Partnership, to encourage shoppers to take Metro to Tysons.
What patterns do you see in this data? Check out the other analysis, visualizations, and the data here.
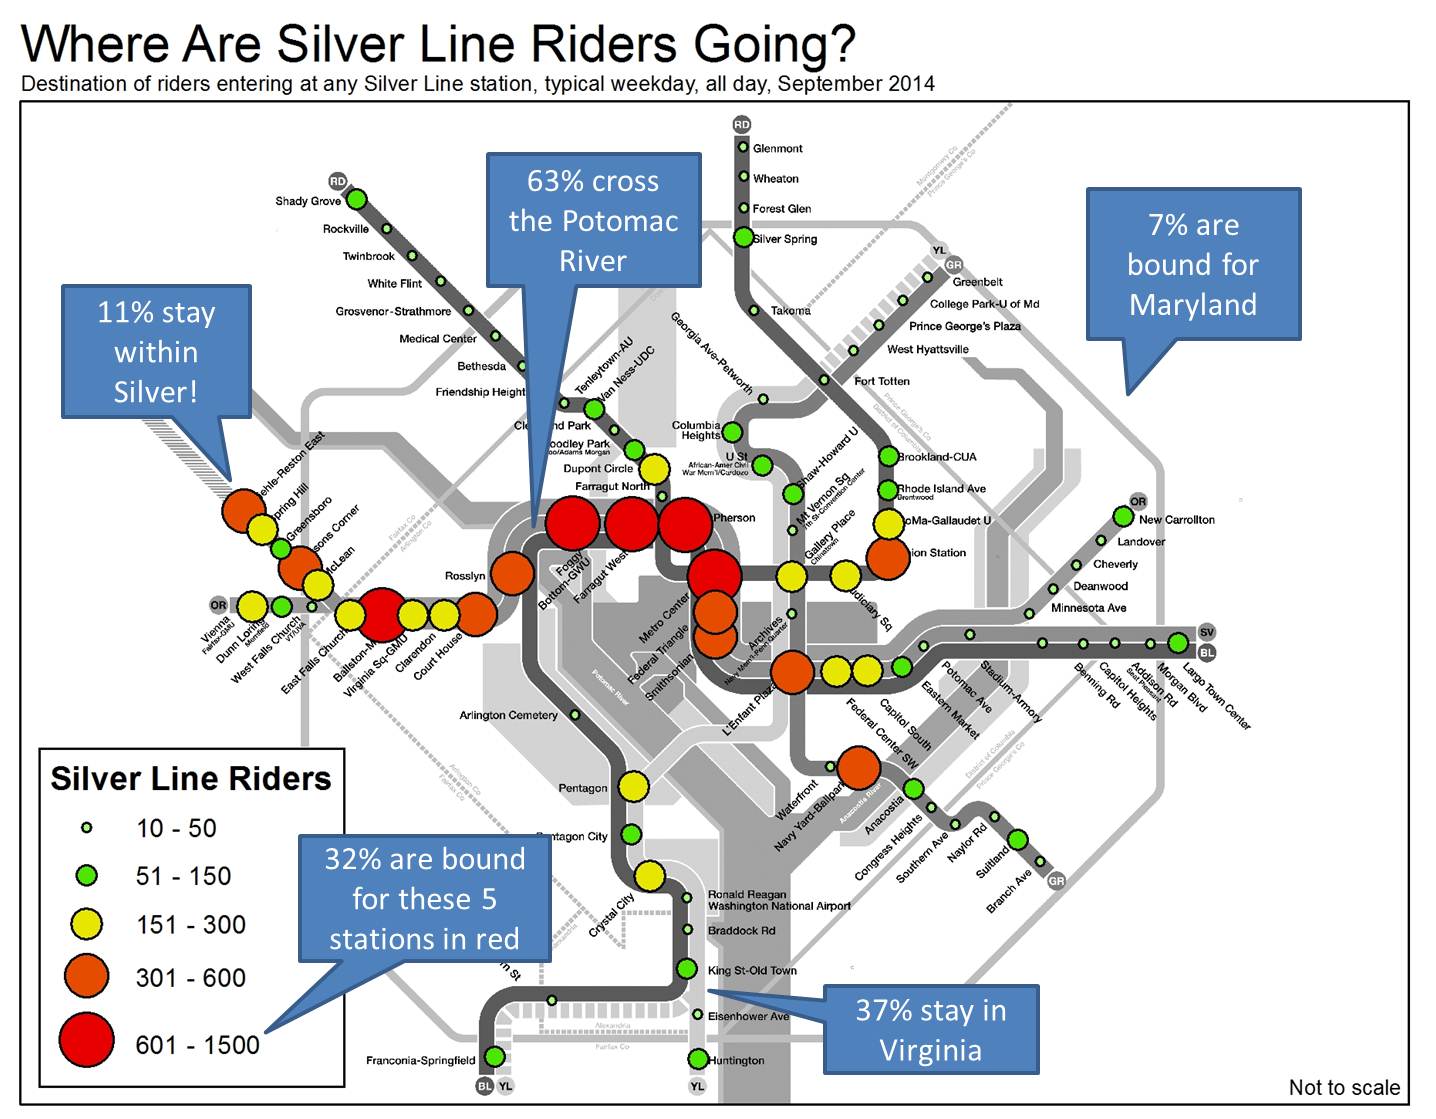
Ridership patterns on the Silver Line show that Metro’s new line is serving a truly regional market.
Now that school is back in session, the new Silver Line just completed its first full week where “normal” travel patterns are beginning to emerge. Ridership is strong, but where are these new passengers going? The diagram below shows destinations of all riders entering a Silver Line station in the week of September 8-12, 2014.

Some observations emerge from this: Read more…
After just two months, ridership on the Silver Line is off to a solid start: Wiehle Ave is already over projections, reverse commuting is strong, and more.
Now that school is back in session and most summer vacations over, here is an in-depth look at the week of September 8-12, 2014, when “normal” routines may have begun to emerge.
At around 15,000 entries per weekday, the Silver Line is off to a solid start. Compared to the official projections from the 2004 Final Environmental Impact Statement (FEIS), we are achieving about 60% of the ridership projected for the end of the line’s first year:
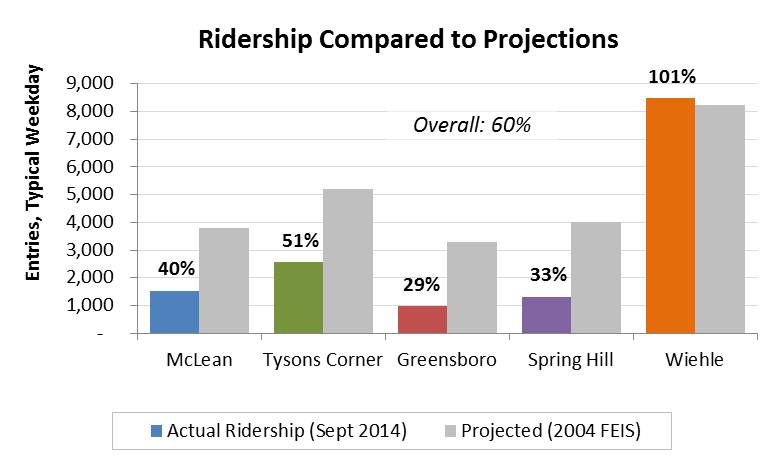 Wiehle station is already over opening-year projections and shows the highest ridership of all the new stations. Tysons Corner station is strong as well, but we still have room to grow at all four stations located in the Tysons area.
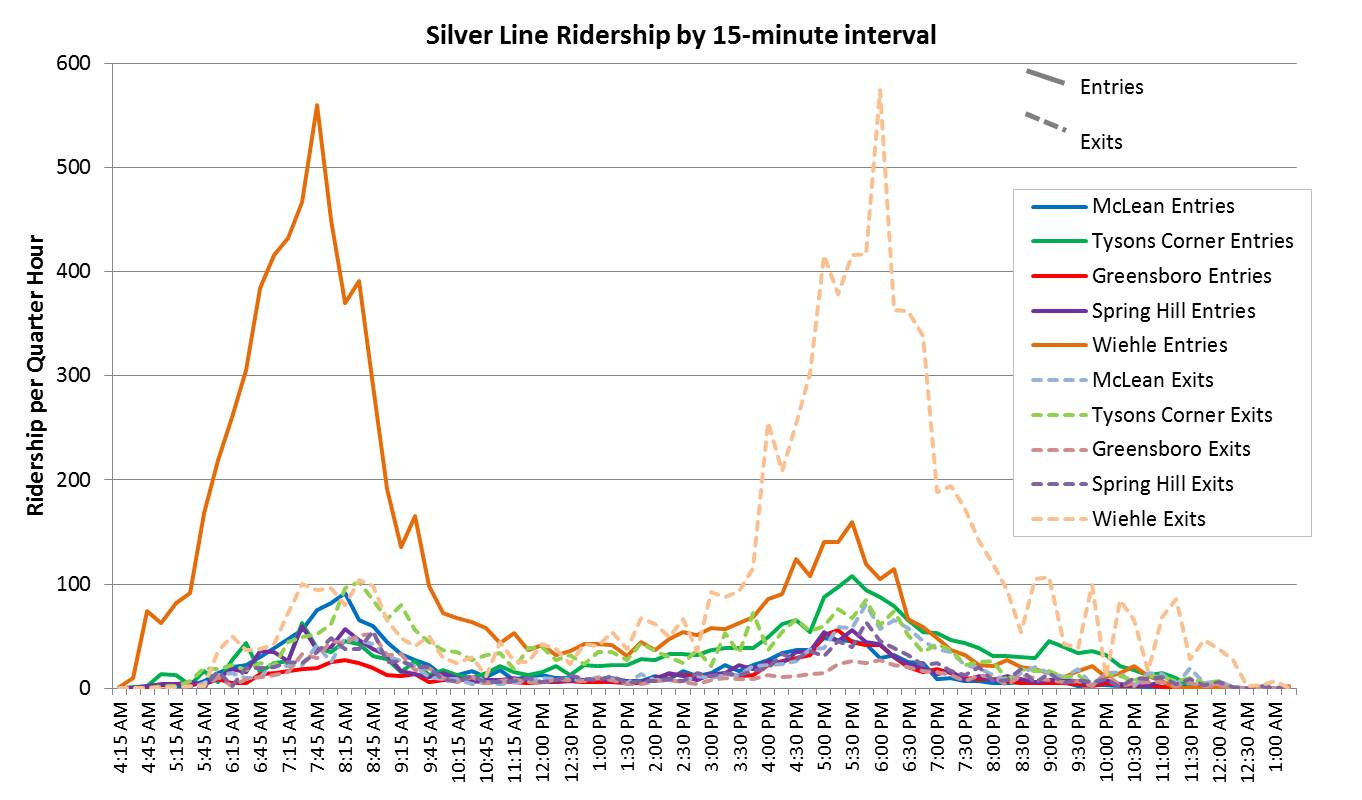
Looking at ridership by time of day shows the Wiehle is a commuting powerhouse, but also that a strong reverse commute market is emerging at the other stations:
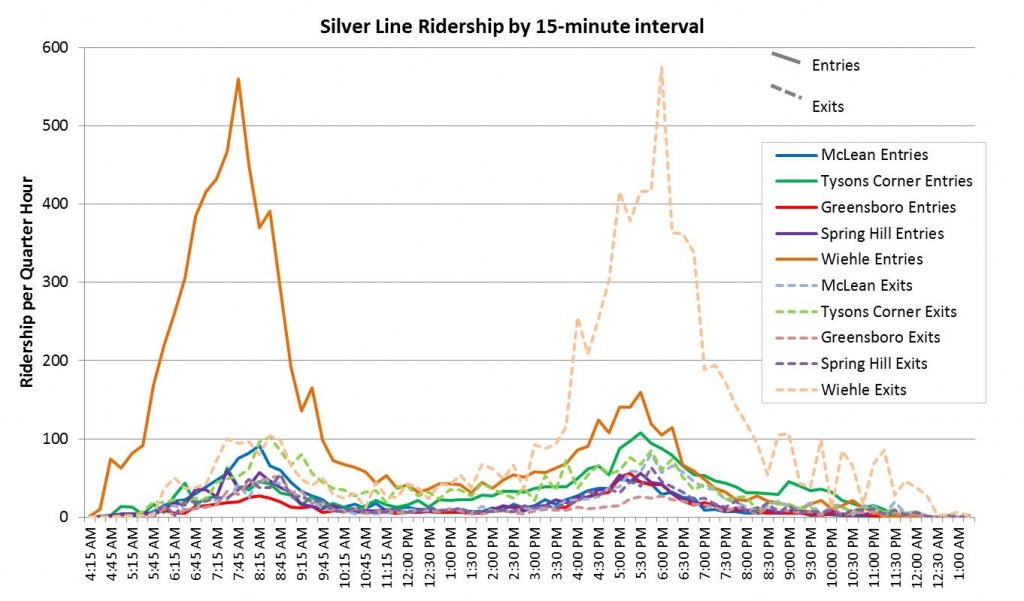
- McLean (in blue) is showing an early lead as a a “traditional” commute station, where most riders enter in the morning.
- Tysons Corner is much more dominated by reverse commuters, and its morning rush extends into mid-morning (around 10:00am). Evening ridership at Tysons Corners is also heavy. (More on off-peak ridership at Tysons coming soon)
- Greensboro and Spring Hill show relatively light ridership so far, but ridership is expected to grow over time as development catches up with the new station.
What do you think? Have you taken the Silver Line on a weekday? What was your experience?
The raw data by quarter-hour interval underlying this analysis is available in two formats: by station alone (2MB, .xlsx), and by origin-destination station (3MB, zipped tab-delimited .txt).
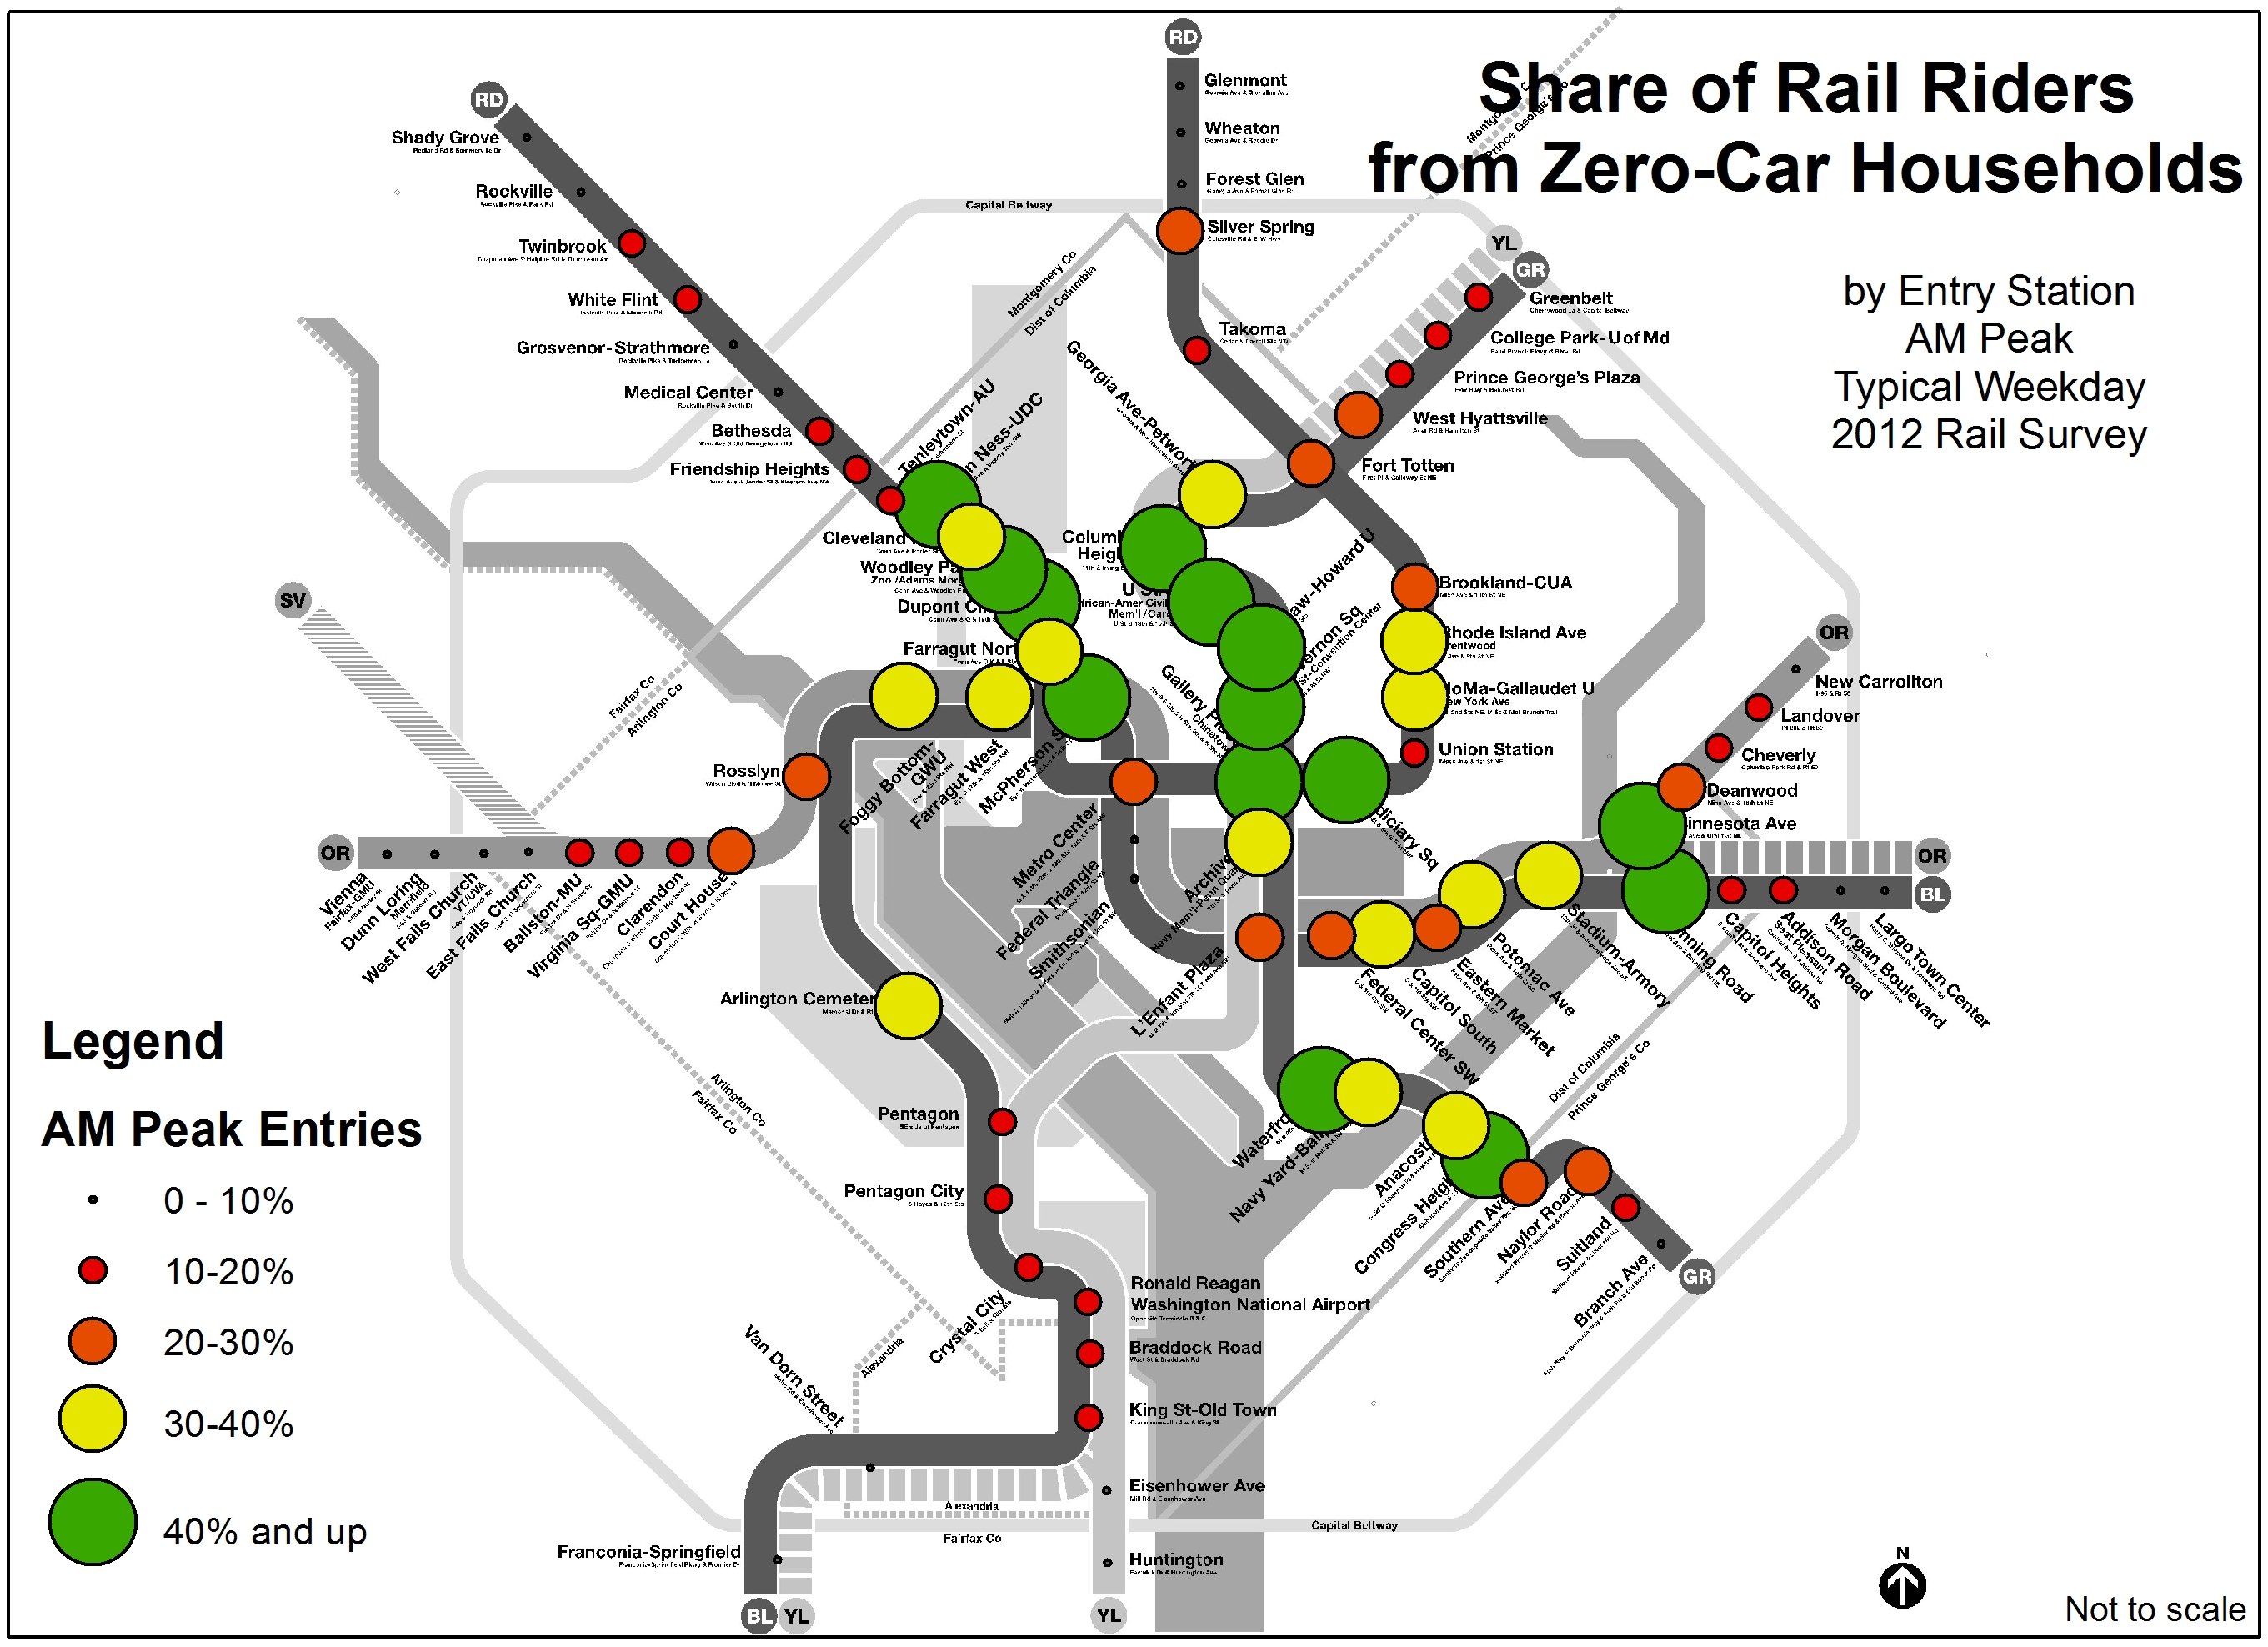
Many pledge to leave their car at home for a day on Car-Free Day September 22,but 20% of Metrorail riders don’t own a car and go car-free every single day!
Of course, Metrorail riders from zero-car households vary significantly across the stations – from over half of all riders at places like Columbia Heights, Benning Road, and Dupont Circle – to less than 10% at more suburban areas like Rockville, East Falls Church, or Franconia-Springfield. The diagram below shows the share of riders who live in a zero-car household, by station:
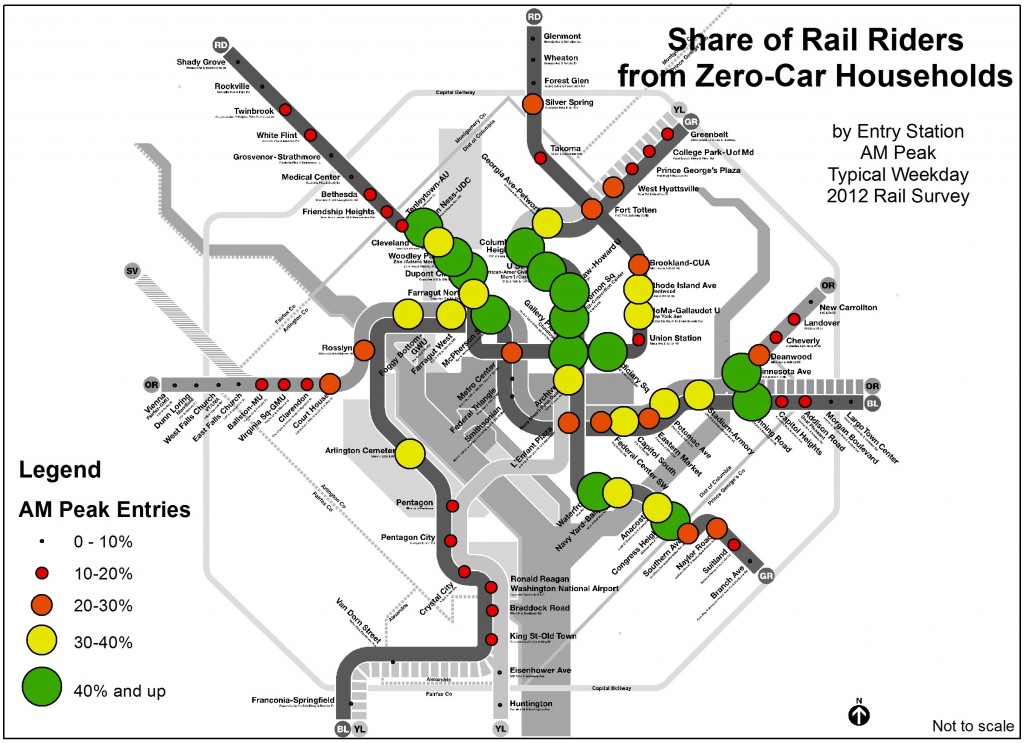
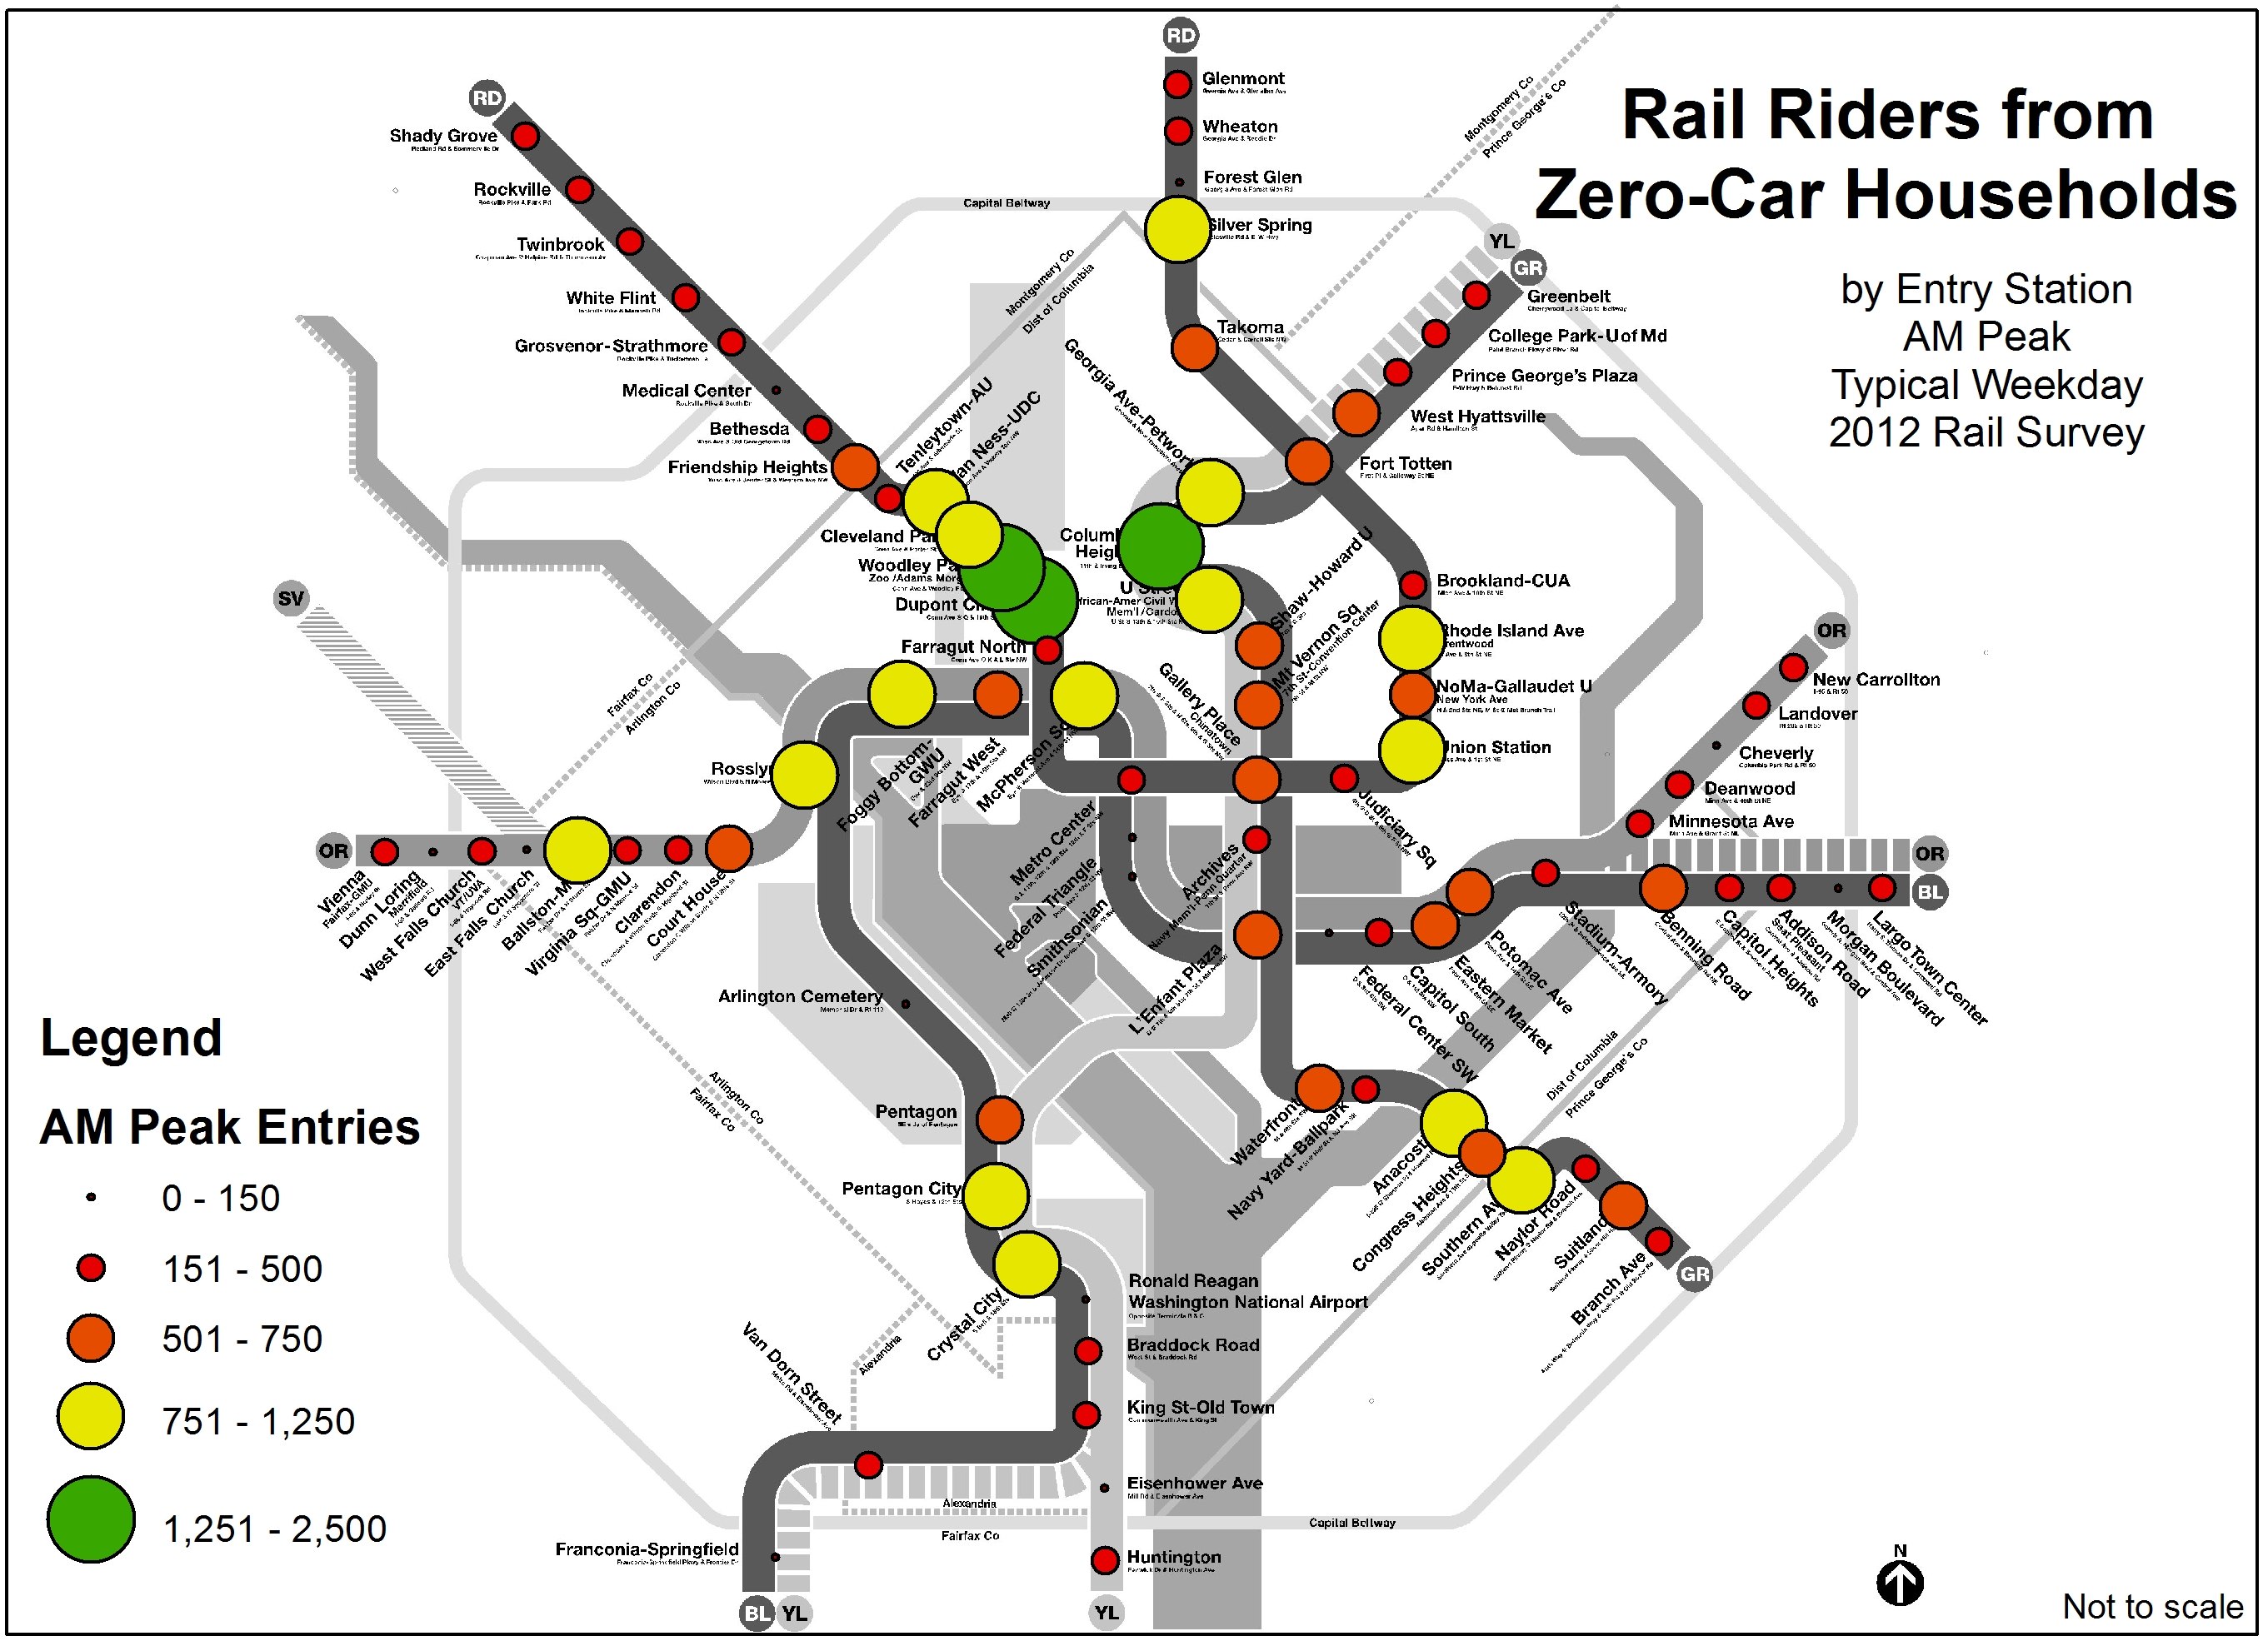
Of course, ridership varies across stations too, so the next diagram shows the total number of rail riders from zero-car households:

In addition to riders who are completely car-free, many others come from “car-light” households of one or no cars. 58% of Metrorail riders come from “car-light” households. For many, access to Metrorail and Metrobus and other transit services is a big reason they can drop down to one or zero cars and still get around. In fact, DC’s zero-car households number is climbing, with 88% of new DC households car-free. For others, car ownership is a heavy financial burden they may not be able to afford. Stay tuned for a coming post which estimates riders who are car-free by choice, vs. by necessity.
Do you live in a car-free household? How does Metro help meet your mobility needs?
The data shown here is derived from our 2012 Metrorail Passenger Survey and the raw data is available (.xlsx, 19k).
 May 2013 and 2014 Metrorail ridership data is available: what patterns do you see?
Following up on our last data download of rail ridership from May 2012, 2013 and 2014 are now available. These data now represent three “snapshots” in time of rail ridership, at a very fine level of detail. This data can help answer questions, such as: where is ridership growth the strongest? Which destinations are becoming more or less popular? How has off-peak vs. peak ridership changed?
May 2013 Metrorail Ridership by Origin, Destination, TimePeriod, DayOfWeek (.xlsx, 3.3 MB)
May 2014 Metrorail Ridership by Origin, Destination, TimePeriod, DayOfWeek (.xlsx, 3.4 MB)
We invite you to tell us what you see, in the comments.
Technical notes on the data are the same as the last post. This time, Saturdays and Sundays are shown in the same worksheet as weekdays.
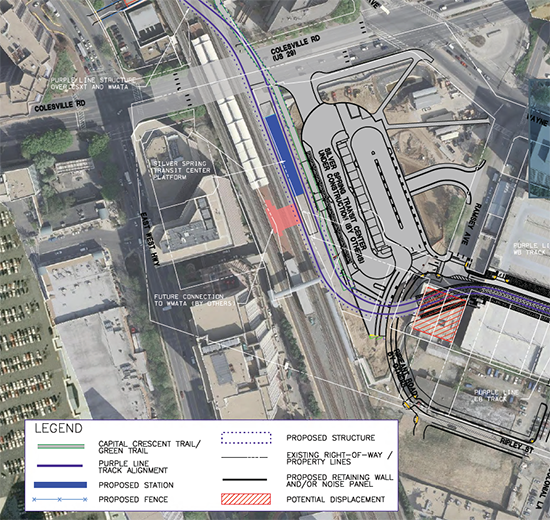
To handle future ridership demand, Silver Spring may need a new mezzanine to connect Metrorail to the planned Purple Line light rail station.
Last year, we began a study looking at potential station capacity issues at Silver Spring. The assessment determined that the demand at the Silver Spring Metrorail station (entries and exits) is adequately served by the existing station infrastructure. Since then, the study has assessed the future conditions that will be impacted both by ridership growth due to growth of jobs and households in the station area, but also the arrival of the Purple Line light rail to Silver Spring.
The Purple Line station at Silver Spring is planned as an elevated platform and mezzanine, with the mezzanine connecting to the top floor of Silver Spring Transit Center, Metropolitan Branch Trail, and Ripley Street to the south. The elevated light rail platform will be approximately 80 feet above the street, about the height of the current MARC pedestrian bridge. The MTA design team envisioned a possible direct connection between Metrorail and the Purple Line, as illustrated in the red shape in the center of the above image. Without such a connection, riders transferring between Metrorail and the Purple Line at Silver Spring would have to descend those 80 feet to the ground level, enter an existing Metrorail mezzanine, and then ascend again to the Red Line platform. Read more…
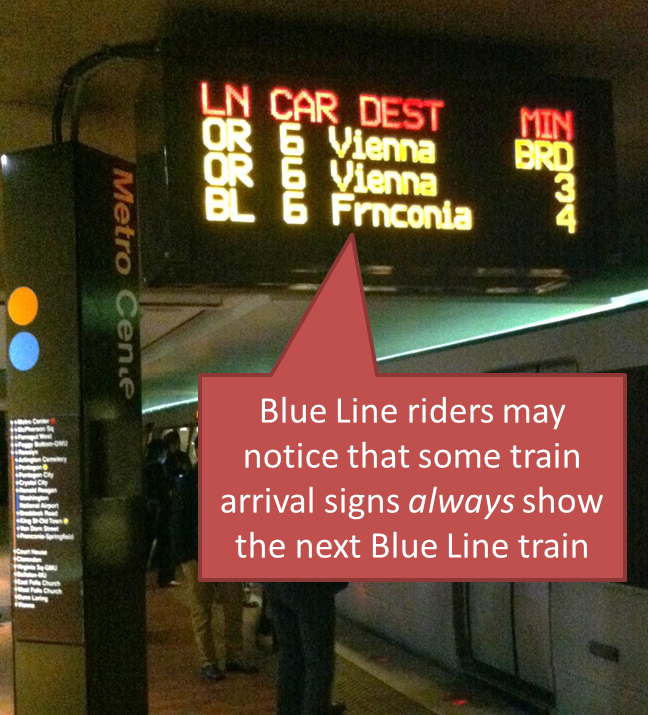
 Some train arrival signs now always show the next Blue Line train, and it’s helping Blue Line riders determine their best route.
At rush times, Blue Line riders know they can sometimes see two or three Yellow or Orange Line trains go by before a Blue Line train arrives. For some riders, knowing just how far away the next Blue Line train is can help them decide: is it worth waiting, or should I get on the next train and transfer at L’Enfant Plaza?
To help Blue Line riders, Metro changed the arrival signs to always show the time until the next Blue Line train arrives, even if it’s more than three trains away. That means that riders can always tell how far away a Blue Line train is, and decide whether to wait for it, or use the Yellow Line instead. Read more…


Recent Comments