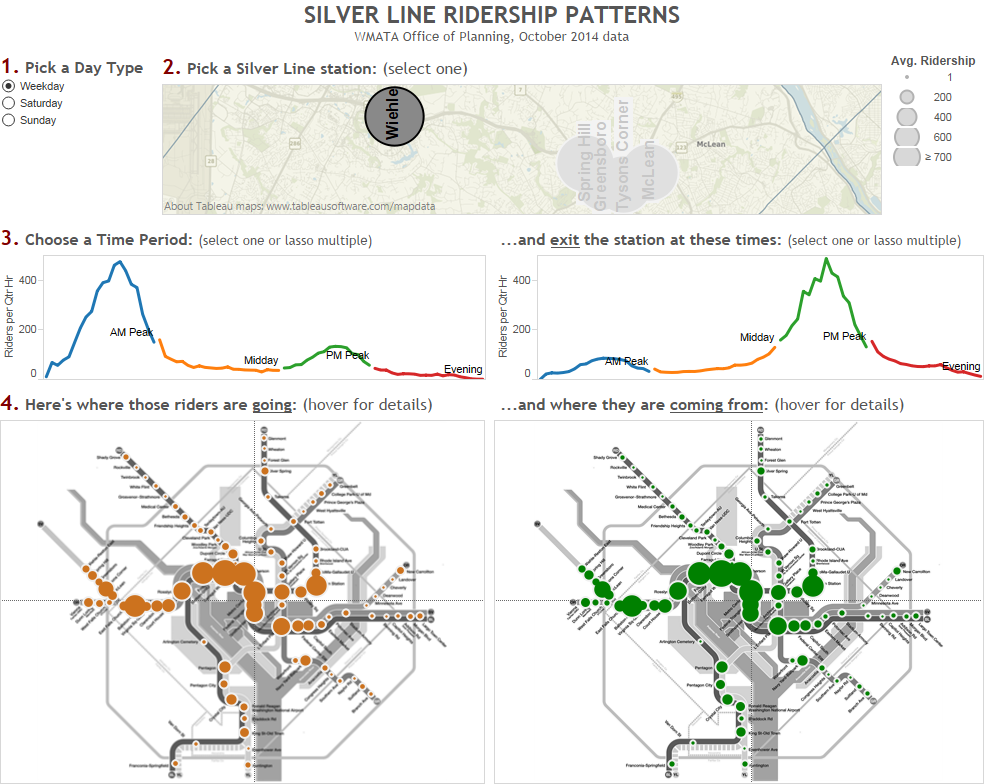
Learn about the travel patterns of Silver Line riders in rich, interactive detail with this new tool.
Click on the dashboard below to see where Silver Line rail riders are going, coming from, and by time of day and day type. This is simply a visualization of the October 2014 rail ridership data we recently posted. What patterns do you see? What jumps out at you?
As gasoline prices drop and commuters feel less pain at the pump, do they drive more and take Metro less? The short answer is maybe, but not much.
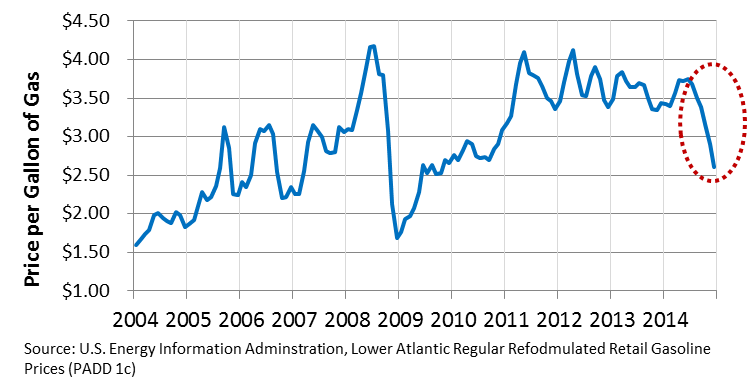
In recent months, gasoline prices in the Washington region have dropped by over a dollar per gallon, to a near-record low of around $2.50 per gallon. Here’s how gas prices have changed in the last 11 years (unadjusted for inflation):
Below is a simple scatter plot comparing those prices to bus and rail ridership to gasoline prices, by month, for the last 11 years. It shows that gas prices have a very small, nearly negligible, effect on Metro ridership. The relationship is essentially zero for Metrobus, and barely detectable on Metrorail as a whole, as pictured below. The link is best with off-peak rail ridership (R2 = 0.24) compared to peak ridership (R2 = 0.09), suggesting that off-peak Metrorail riders are most sensitive to gas prices. (Not pictured.) Read more…
A large majority of trips on Metrorail cross jurisdictional boundaries, illustrating that Metro is indeed a regional service.
We’ve mentioned before how the station improvements in Metro 2025 will benefit riders from all jurisdictions. In fact, Dupont Circle is the only station identified in Metro 2025 with a majority of users living in DC. We thought we’d take another look at ridership that crosses jurisdictional boundaries. The table below illustrates the percent of trips, by jurisdiction of origin, that cross into another jurisdiction on Metrorail, sliced by Weekday AM Peak, Weekday PM Peak and Weekend. Data is from October 2014 and includes the new Silver Line stations.

A few things pop out: Read more…
This new data download from October 2014 includes ridership from the five new Silver Line stations.
 Over the past few years we’ve been making ridership data available for download and analysis by the online community. We have received some requests for full origin-destination (O/D) data sets that include the new Silver Line ridership.
These data sets include ridership from October of 2014, and are available by period (AM Peak, midday, etc.) or by quarter-hour interval, for all stations including the five new Silver Line stations. Both sets include daily averages for weekdays, Saturdays, Sundays and Columbus Day.
Note, the quarter-hour data file is to big to open in Microsoft Excel.
Have fun playing around with this data and let us know in the comments what you find. Make sure you check out the other assessments of Silver Line ridership we’ve done.
Jan 29, 2015, 10:00 AM Update: Files have been updated to include total and average travel times for each station pair.
Feb 02, 2015, 11:00 AM Update: Files have been updated to separate Columbus Day from Saturdays using a new column “Holiday”.
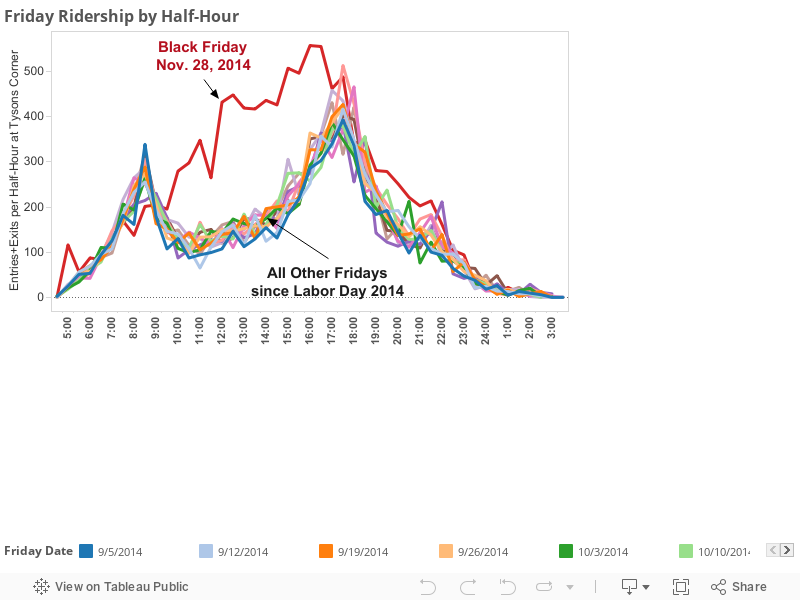
The day was the Tysons Corner Station’s busiest since the Silver Line opened.
Black Friday, the day after Thanksgiving, is traditionally the busiest shopping day of the year. As would be expected, ridership at Metro’s new Tysons Corner station skyrocketed on Black Friday this year. The station facilitated 10,800 riders entering or exiting over the course of the day, double its normal weekday volume of around 5,500. The chart below shows ridership at Tysons Corner by half-hour for all Fridays since Labor Day.
The day was the first sign of success for Metro’s partnership with Tysons Corner Center and the Tysons Partnership, to encourage shoppers to take Metro to Tysons.
What patterns do you see in this data? Check out the other analysis, visualizations, and the data here.
Carrying an average of 11,000 riders to every Nationals home game, Metrorail maintained a 34% mode share to Nationals park in the 2014 season.
How many baseball fans take Metro to Nationals Park? Metro’s rail planning team tracks this statistic, by looking at activity around game times at Navy Yard-Ballpark and Capitol South stations that exceed our typical baseline ridership. On game days, Metro provides special game-day trains on the Green Line to handle increased loads to and from Navy Yard-Ballpark station.
Over the 81 home games in 2014, Metrorail brought an estimated 890,000 total riders to the ballpark, or about 11,000 riders per game. Compared to the average attendance of 31,000 at Nationals Park this year, this equates to a 34% mode share for Metrorail at Nationals Park. Including both entries and exits, Nationals games generated about 1.7 million total trips for Metrorail this season. A few more observations:
- Interestingly, ridership to the game is typically 8% higher than ridership from the game – some spectators must be finding another way home!
- Metrorail’s mode share was highest for Friday games (38%), and lowest for Wednesday games (32%)
- Mode share increases slightly for high-attendance games, but the relationship is weak. Metrorail’s market share remains mostly stable in the 30-40% range, whether attendance was 20,000 or 40,000.
We’ve posted additional visualizations and the raw data, in addition to the charts in this post. What do you think? What patterns do you see?
Metrorail’s special Veterans Day schedule handily served commuters and concert goers alike.
On November 11, 2014, Metrorail served a reduced commuter market, as well as a large event on the National Mall, the Concert for Valor. Metro ran a modified rail schedule, with near-peak service levels throughout most of the day, and Blue Line trains replaced with additional Yellow Line trains.
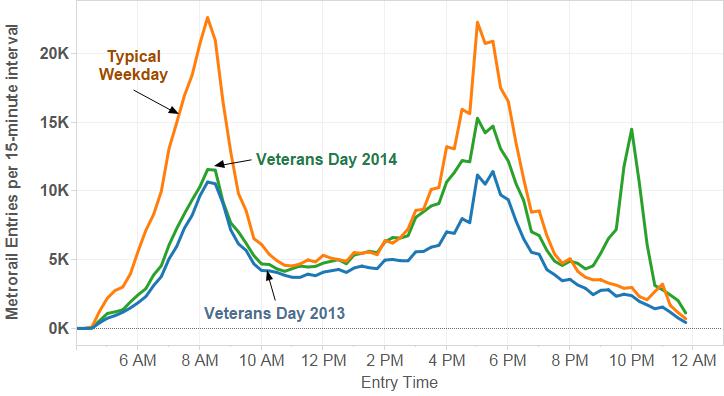
Compared to a Typical Weekday:
- Total ridership for the day was 515,000 trips, which is about 80% of a typical weekday
- The AM Peak commute was roughly half of a typical weekday.
Compared to Veterans Day 2013:
- Ridership was up by around 40%, or 147,000 trips.
- Ridership at most stations was up by about 25-50%, while five stations serving the National Mall doubled and tripled last year’s numbers.
- Federal Triangle and L’Enfant Plaza were over quadruple last year’s ridership
- Ridership at Arlington Cemetery was down by half, coinciding with reduced service to that station.
- The morning commute (until 9:30am) was up 13% over last Veterans Day, evenly across most stations. This is another sign that when the federal workforce, most impacted by the drop in the federal transit benefit, is (mostly) removed from Metrorail’s commute market, ridership is up.
Read more…
The drop in the federal transit benefit is making Metrorail riders feel the pinch in their wallets, and it’s hurting ridership.
What’s happened to ridership since the benefit changed? You may have seen in the news that Metrorail riders have been heavily impacted by changes in federal tax law that discourages transit usage. The maximum amount of SmartBenefits dropped from $240 to $130 per month in January, and since then:
- Since the change, our traditional commuter market – full-fare customers who travel from suburban stations to the core at peak times – has fallen by about 1.5%.
- Trips shorter than 4 miles – more likely to still be fully subsidized – are unchanged.
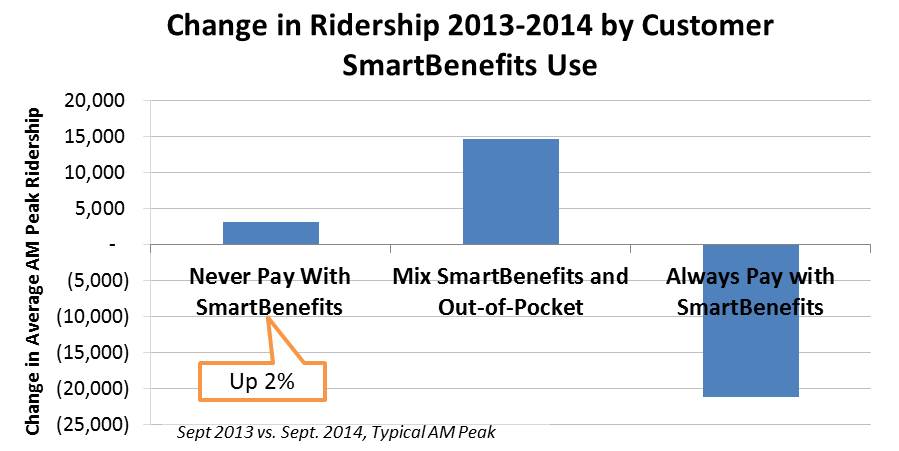
- Customers able to get through the month on SmartBenefits alone are down 25%, while customers who must supplement with their own cash have doubled, and the net result has been a 10% loss in trips from this key commute market.
- 75% of this ridership loss has been from trips over 7 miles: at an average fare of $4.10/trip equating to $165/month and up, these longer commutes now require substantial out-of-pocket contributions.
- The average impacted SmartBenefits customer must now pay $0.84 extra per trip – this is the equivalent of a 20% fare hike.
- For riders directly subsidized by the federal government, this was increase of nearly $2.40 per day, or over $54/month.
- For riders setting aside pre-tax dollars, this felt like a 10% fare increase.
- Trips paid for with SmartBenefits have dropped 1%.
The decrease in the federal transit benefit has hurt Metrorail ridership in the last year. Ridership is up from customers who are unaffected by the policy change, but more people must supplement with out-of-pocket contributions to make it through the month, and in the process Metrorail is losing trips.
How do you know it’s not something else? Ridership could be down for a variety of reasons, and we continue to mine the data for other patterns – from the economy to demographics to fares. We can’t pin all of the ridership loss on the federal transit benefit, but the losses have been concentrated on SmartBenefits users. In addition:
- Ridership from commuters not enrolled in SmartBenefits has actually grown by 2% in the last year.
- We are still investigating, but customers do not appear to be reducing travel much due to telework. Metrorail has been losing both customers and trips (not just trips), and trip frequency among commuters is mostly stable.
- In fact, we are gaining riders at stations with recent transit-oriented development, and ridership is up 3% at stations along the Green Line in D.C., the Red Line in Northeast D.C., and Courthouse/Clarendon in Arlington.
We continue to study the trends, and for a second glance see our more detailed summary of ridership trends (PDF, 710K).
Use of the “Farragut Crossing” virtual tunnel is strong, averaging around 18,000 trips per month during the more temperate months, dropping to 15,000 during the winter.
Users of the Metrorail system come up with a lot of different ideas for how Metro can better serve their needs. Ideas often come from the blogging community and are sometimes considered by Metro planners, researchers and leadership. One such idea was the virtual tunnel between Farragut North and Farragut West. Now dubbed “Farragut Crossing” via a Facebook naming contest, this fare policy update allows transfers between the two Farragut stations without being charged two separate fares.
Farragut Crossing was first opened in October of 2011 and monthly usage increased from just a few thousand trips in its first few months to a max of over 21,000 in May of 2014. Since then, it’s settled to around 18,000 during the fair-weather months.

Read more…
Transit expansion is in demand but Metrorail, light rail, and other high capacity transit projects can be expensive to build, operate and maintain. With limited resources to invest, our region must ensure that these projects serve the most robust transit markets and are supported by strong transit friendly policies.
Informed by our peers and local performance measures, Metro is developing guidelines that the region can use to inform development of high capacity transit projects. As we’ve explored previously, there’s much more to transit expansion than Metrorail. In fact, due to the cost associated with Metrorail expansion along with existing land uses and built environment in much of the region, most of our future high capacity transit projects will be made up of other transit modes. But what is the best way to decide what mode best fits each corridor? The goal of the expansion guidelines is to inform those decisions.

Development in Arlington’s Rosslyn-Ballston Corridor has validated initial and ongoing investments in Metrorail. (source: Arlington County)
A literature and peer review included policy documents from BART (PDF), the Bay Area Metropolitan Transportation Commission, Florida DOT, Virginia DRPT, Federal Transit Administration (PDF), and research from the University of California Transportation Center (UCTC). The review found that ridership, density, the presence of walkable streets and sidewalks, local plans and policies, and cost effectiveness are the most relevant criteria to evaluate transit projects and that rigorous performance targets are needed to support each transit mode. Read more…
Categories: ConnectGreaterWashington Tags: BART, BRT, corridors, DRPT, Light Rail, Metrorail, plans, ridership, Streetcars, tod, transit-oriented development


Recent Comments