With a wide variety of languages spoken in our region, Metro uses the latest Census data to inform how we reach out to the diverse communities we serve.
Federal Transit Administration (FTA) guidance to transit agencies on meeting the needs of limited English proficient (LEP) populations – i.e., those who have a limited ability to read, write, speak, or understand English – says that the agency should provide written translation of vital documents for “each eligible language group that constitutes 5 percent or 1,000 persons, whichever is less, of the total population of persons ‘eligible to be served’.” For a region like ours, that’s a pretty tall order as there are more than 26 non-English language groups where there are more than 1,000 speakers of the language. However, by aggregating the latest Census-based language data for areas near our Metrorail stations and bus routes, we can develop a better understanding of the linguistic diversity in Metro’s service area as well as the proportion of LEP persons.
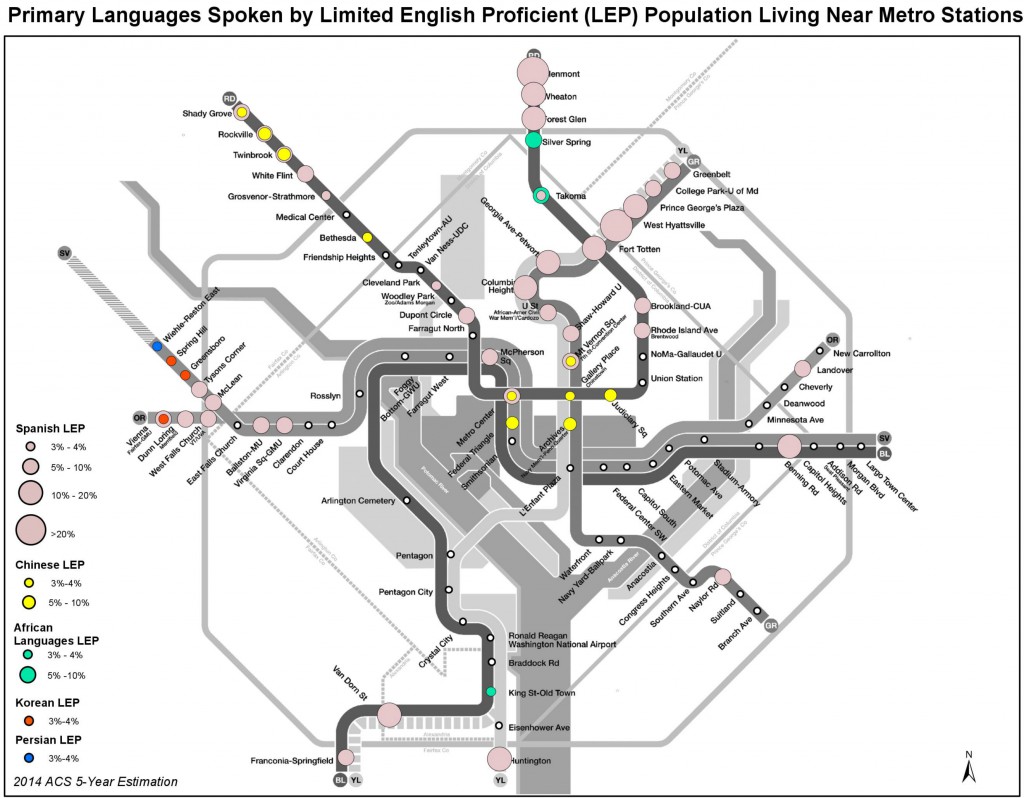
To ensure rider communication and meaningful public outreach to these language populations, Metro develops a Language Assistance Plan that is updated every three years, with the next update due in 2017. The Census language data developed for this document guides the types of information we need to translate and helps inform our public outreach activities. This latest round of language data shows that the top seven languages spoken in our service area are Spanish, Korean, Vietnamese, Chinese, French, Arabic and Amharic. For these languages, we provide written translations of all vital materials and offer language assistance services upon request. The map below shows the predominant LEP populations near each Metrorail Station along with the proportion of LEP speakers for each language.
Read more…
Data recently released by the Census Bureau show that more commuters are using public transportation than ten years ago, and that transit use has been growing faster than the workforce. Transit’s share of commuters rose from 14.6% in 2000 to 19.4% in 2011. The growth can be chalked up to all transit operators in the region, and it is an encouraging sign that transit’s role supporting the economy has been increasing. Nearly all jurisdictions in WMATA’s Compact area experienced a growth in public transportation usage.

Public transit's share of commuting has grown in the last decade across nearly all jurisdictions in the WMATA Compact area, the latest Census data show.
Transit’s growth in the region highlights the need for us, our partners, and the public to start talking strategically about Metro’s future. Not only are more people taking transit, but more people are choosing to make the Washington region their workplace and home. How can Metro best accommodate growing ridership? Join the online conversation at Momentum to express your thoughts on these and other questions. Over the next few months we will post questions, conduct polls, and ask you to prioritize various elements of the plan. Your input matters, and we’re listening.
In the coming months, we’ll be releasing what we learned about our rail ridership through the 2012 Metrorail Ridership Survey.These findings from the Census will help put the survey results in context.
The table below shows the change in number of workers for whom means of transportation work is determined, and their transit mode share, between the 2000 Census and 2011 1-Year American Community Survey.
|
Number of Workers (for whom mode is known)
|
Transit Commute Share
|
|
2000
|
2011
|
2000
|
2011
|
| District of Columbia |
260,884
|
306,801
|
33.2%
|
39.6%
|
| Montgomery County |
455,331
|
516,545
|
12.6%
|
15.8%
|
| Prince George’s County |
397,403
|
446,551
|
11.9%
|
19.5%
|
| Arlington County |
116,046
|
139,722
|
23.3%
|
28.4%
|
| Alexandria City |
77,190
|
89,831
|
16.4%
|
18.2%
|
| Fairfax County |
527,464
|
580,430
|
7.3%
|
9.9%
|
| Fairfax City* |
11,845
|
12,106
|
7.6%
|
9.0%
|
| Falls Church City* |
5,853
|
5,667
|
15.9%
|
15.8%
|
| TOTAL – WMATA Compact Jurisdictions |
1,852,016
|
2,097,653
|
14.6%
|
19.4%
|
These numbers describe commuters’ “primary” mode of transportation to work. The American Community Survey figures are estimates based on sampling, and are accompanied by statistical margins of error (not shown here).
* Note: For sampling size reasons, the American Community Survey does not publish 1-year statistics for Falls Church City and Fairfax City. This post shows 5-year 2005-2009 ACS statistics for those two jurisdictions.


Recent Comments