Identifying Metro’s Growing non-English Speaking Communities
With a wide variety of languages spoken in our region, Metro uses the latest Census data to inform how we reach out to the diverse communities we serve.
Federal Transit Administration (FTA) guidance to transit agencies on meeting the needs of limited English proficient (LEP) populations – i.e., those who have a limited ability to read, write, speak, or understand English – says that the agency should provide written translation of vital documents for “each eligible language group that constitutes 5 percent or 1,000 persons, whichever is less, of the total population of persons ‘eligible to be served’.” For a region like ours, that’s a pretty tall order as there are more than 26 non-English language groups where there are more than 1,000 speakers of the language. However, by aggregating the latest Census-based language data for areas near our Metrorail stations and bus routes, we can develop a better understanding of the linguistic diversity in Metro’s service area as well as the proportion of LEP persons.
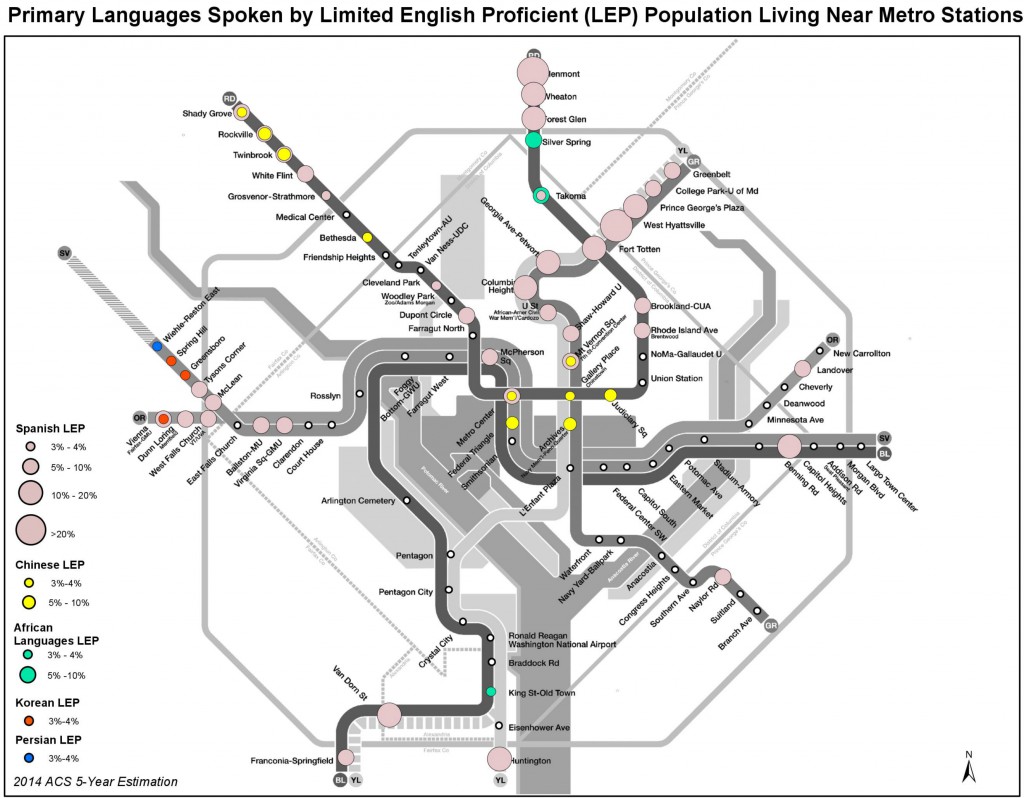
To ensure rider communication and meaningful public outreach to these language populations, Metro develops a Language Assistance Plan that is updated every three years, with the next update due in 2017. The Census language data developed for this document guides the types of information we need to translate and helps inform our public outreach activities. This latest round of language data shows that the top seven languages spoken in our service area are Spanish, Korean, Vietnamese, Chinese, French, Arabic and Amharic. For these languages, we provide written translations of all vital materials and offer language assistance services upon request. The map below shows the predominant LEP populations near each Metrorail Station along with the proportion of LEP speakers for each language.
Spanish is clearly the predominant LEP language spoken in the region and there are 33 stations where the nearby Spanish LEP population served is 5 percent of total households or more. One interesting finding from the latest data is that the long-standing Chinese LEP population in the Chinatown area is shrinking, while the Chinese population near Rockville is growing. Also noteworthy is a significant African LEP population near Silver Spring Station, with African languages such as Amharic spoken in this area. In addition to Spanish, Chinese and African Languages, we also see Korean and Persian languages as nearly reaching the 5 percent translation threshold and clearly exceeding the 1,000 speaker threshold.
In the Metro service area, 11.4 percent of the population speaks a language other than English at home and speaks English less than “very well” – and are therefore considered LEP. There are 26 non-native English language groups with a LEP population above 1,000. Of these languages spoken in the region, the table shows top 13 languages with more than 5,000 LEP persons.
| Language spoken at Home | Population speaking a language other than English at home | Population that is LEP by native language – Speak English Less Than “Very Well” | |
| 1 | Spanish | 480,445 | 212,725 |
| 2 | Chinese | 73,782 | 32,762 |
| 3 | Korean | 54,689 | 29,434 |
| 4 | African Languages* | 90,692 | 26,491 |
| 5 | Vietnamese | 43,079 | 23,878 |
| 6 | French** | 54,222 | 13,302 |
| 7 | Other Indic Languages*** | 30,577 | 10,157 |
| 8 | Tagalog | 33,839 | 9,984 |
| 9 | Arabic | 34,211 | 9,769 |
| 10 | Persian | 26,336 | 9,102 |
| 11 | Urdu | 21,533 | 6,501 |
| 12 | Other Asian Languages**** | 31,974 | 6,427 |
| 13 | Russian | 18,247 | 5,684 |
* African Languages include Amharic, Ibo, Yoruba, and Swahili
**French includes Patois and Cajun
***Other Indic Languages include Punjabi, Bengali, and Marathi
****Other Asian Languages include Malayalam, Telugu, and Tamil
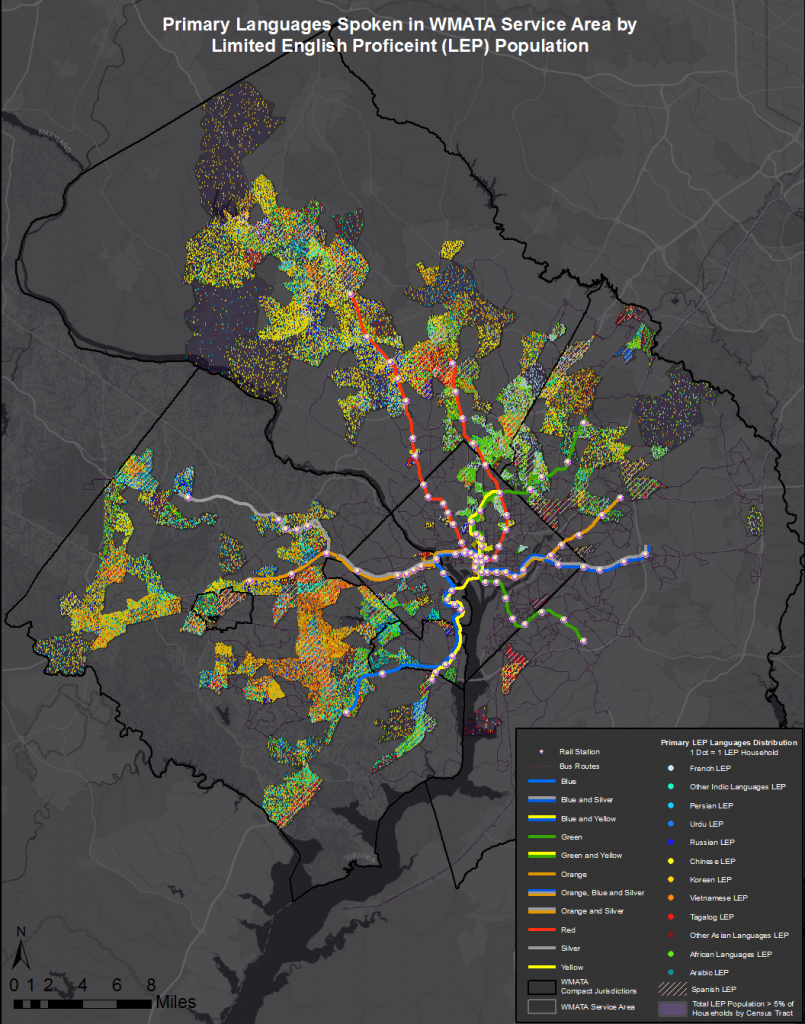
The regional map below shows the distribution of these top 13 languages at the census tract level where the LEP population exceeds either the 5% or 1,000 speaker threshold. Since the non-Spanish LEP population is aggregated into larger groupings (Indo-European, Asia-Pacific and Others), we joined the tract based LEP data with the specific language data to identify the specific languages within the tracts. One colored dot represents one LEP household. The Indo-European language group is shown in a range of blue color, and Asia-Pacific is colored from yellow to red. Overall, the language data correlates well with some ethnicities and shows a similar pattern of population distribution.
What patterns do you see in these maps? Do any of these population groups surprise you?


Another good argument for updating the fare vending machines so that they can “speak” in multiple languages. This is pretty common at transit systems around the country.