
Three Tidbits: What The Metrobus 2014 Survey Can Tell Us
The latest survey of Metrobus riders is a gold mine of information about who our bus riders are, why they travel, and more. Here are the answers to just three questions:
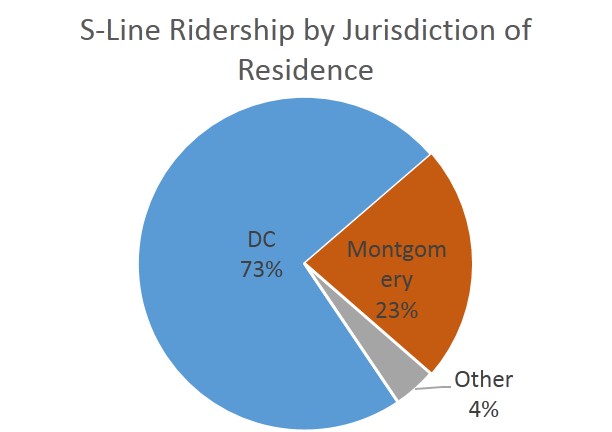
Who’s on the Bus on 16th St. NW? Metro planners and DC residents alike have advocated for a possible bus lane on 16th St. NW, where Metrobuses carry over 50% of the people, are scheduled for about every two minutes, and are frequently bunched and overcrowded. The survey can tell us what kinds of riders use that corridor - giving us clues to what kind of new riders a bus lane might attract.
Survey says:
- Three quarters of S-Line (S1, S2, S4, and S9 combined) riders live in D.C., while the rest hail primarily from Montgomery County
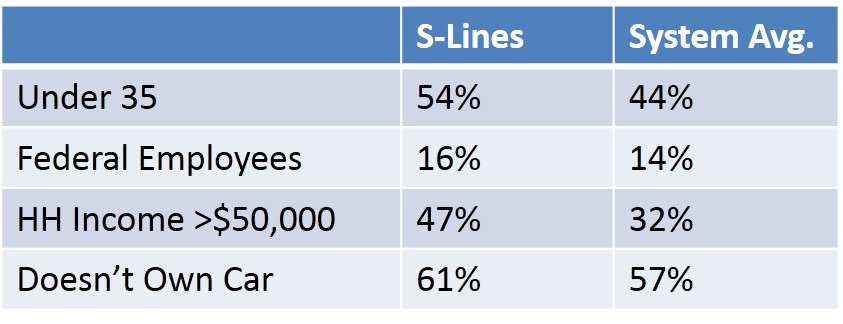
- S-Line riders are younger and more affluent, than the system-wide average for bus riders.
- They are slightly more likely to be car-free and employed by the federal government, but the difference is very small.
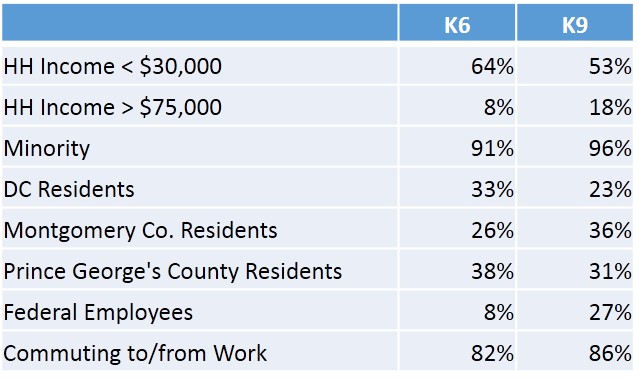
What kind of rider takes the K9 MetroExtra line in Maryland? After we introduced the K9 MetroExtra service, the results have been impressive - 50% annual growth for two straight years, and at no loss to the underlying K6 local service. So are the new K9 riders different from K6 riders? Who are the riders contributing to this success story? (There may be some skew here because the K9 runs only at peak times, and I’m showing data for K6 all day.)
Survey says:
- The new K9 riders are pretty similar to K6 riders in terms of race/ethnicity (minority vs. non-minority), and trip purpose. It’s a high-minority route, with typical income levels, and most people are riding to and from work.
- On the other hand, the new K9 riders are slightly higher income, slightly more likely to live in Montgomery County, and are more federal employees than the underlying K6 service.
Where do “Airport Bus” riders live? The B30 and the 5A buses connect passengers to BWI and Dulles airports, respectively. The survey tells us both lines serve a very diverse regional market, moving both residents and visitors alike.
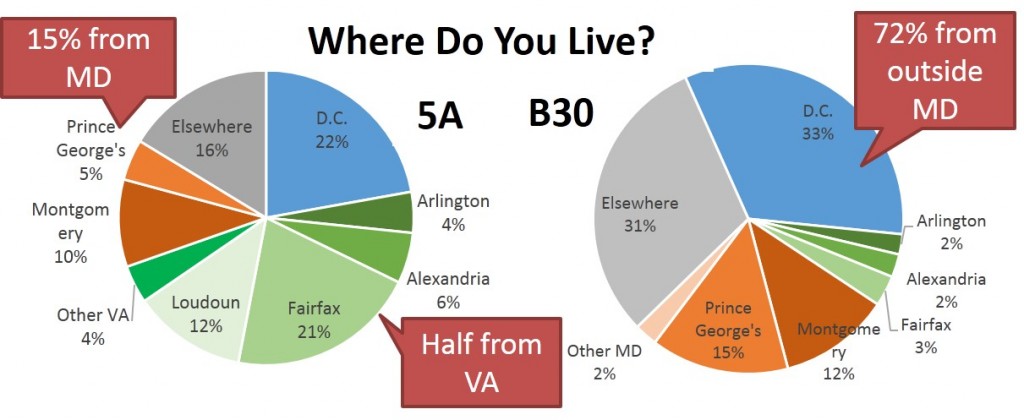
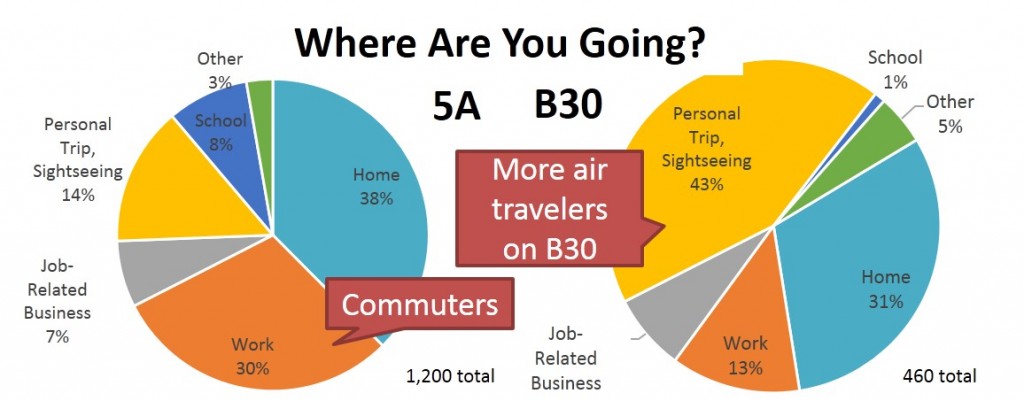
The 5A serves more employees going to work at or near the airport (or commuters from Herndon-Monroe to downtown) than vacationers catching a flight, at least when compared to the B30 which carries more air travelers. And even though the 5A runs mostly in Virginia, only half of the riders live in Virginia. Likewise, the B30 operates in Maryland but only about 30% of riders live in Maryland. Both lines serve a healthy mix out-of-town travelers, natives returning home, and local commuters.
Want to dig into the data yourself? Looking to answer a question that’s not in this post? Take a look at the survey data (1MB, zipped Access .ACCDB file) (or a series of zipped .CSV text files, 550k) and the instrument yourself, and post any findings or questions in the comments below. The survey represents a typical weekday’s ridership.

Could you please post the data in a non-Access format?
Look at how many airport bus riders come from outside the Metro compact area! 1 in 5 for the 5A, 1 in 3 for the B30.
Makes me think the non-Compact jurisdictions in the region should help foot the bill for these services that they obviously use in large numbers.
@Asaf Reich Good idea. I added a link to a group of text files, each of which represents a table in the Access file. There’s one large data table with the survey responses, and the rest are lookups to the full answers to the survey questions.
Vinnie,
Those non-compact riders are called tourist and visitors, too. The buses go to airports.
@Justin Thank you Justin!
This data is great, but I did find it curious that question 2, how the person arrived to the bus, was not included while question 7, how they were going to leave from the bus, was.
@Asaf Reich
Good catch. We deliberately excluded Question 2, because we found too many respondents apparently interpreted the question as “what bus are you on” rather than access mode. The survey numbers were way out of line with transfers as recorded by the fare system.
For planning/research purposes, I suggest using egress (question 7) as a proxy for access. We often care most about AM Peak access mode, so PM Peak egress mode should be a good proxy.