‘Metro 101’

Measuring the Impact of SmarTrip® Initiatives

July 22nd, 2013 8 comments

Metro first rolled out SmarTrip® on rail in 1999, breaking new ground as the first contact-less smart card used for transit in the United States. Metro began rolling out SmarTrip® on bus in 2002 and then to Metrorail parking facilities in 2004.   While the utility of SmarTrip® was immediately obvious to many customers, others required a bit of encouragement to switch to the fare media that is most cost-effective for Metro and customers alike.

Usage of SmarTrip® on rail has been growing steadily since its launch, but use on bus seemed to plateau around 20% on bus starting in about July 2006 until about January 2008.  That was the date when Metro began its first major initiative to encourage people to move to SmarTrip by implementing a $0.10 surcharge for using cash on bus.

Since then, Metro has rolled out new SmarTrip features and additional incentives to continue the increase in SmarTrip use rate.

The chart below illustrates the changes in SmarTrip use rate on both bus and rail, overlaid with the dates of the initiatives and feature releases that helped motivate customers to switch to SmarTrip.  The usage rate now is nearly 90% on both bus and rail! Read more…

Metro’s Fare Policy Principles

June 3rd, 2013 13 comments

Fare table showing peak-of-the-peak pricing, in effect from August 2010 to June 2012

Fare table showing peak-of-the-peak pricing, in effect from August 2010 to June 2012

In a recent post we described how Metrorail fares are calculated.  The previous post noted that Metro’s Fare Policy Principles have established guidelines for how fares are structured.  When it is time to evaluate changes to Metrorail, Metrobus, and MetroAccess fares, Metro staff revisit the fare policy principles to look for guidance.

Metro Fare Policy Principles, adopted November 18, 2010:

  1. Ensure and enhance customer satisfaction;
  2. Establish a mechanism to allow customers to determine their fares easily;
  3. Optimize the use of existing capacity;
  4. Establish equitable fares and ensure compliance with federal regulations;
  5. Facilitate movement between modes and operators throughout the region;
  6. Encourage the use of cost-effective media;
  7. Generate adequate revenue while maximizing ridership;

The challenge for Metro staff is to explore fare concepts that strike balance between the different principles.  For example, Metro uses surcharges to encourage use of SmarTrip™ which is our most cost-effective fare media (principle #6), but the surcharges provide challenges to easily determined fares (principle #2).

Note that Metro’s distance-based fares are considered more equitable than flat fares.  Average income increases with distance from the core in the Washington region, so a flat fare would result in the highest per-mile fares for those groups who are the least able to pay them.  Metro’s Board of Directors understands this and has emphasized fare equity (principle #4) as one of its top priorities.

Many other aspects of the current bus, rail and paratransit fares reflect these principles:

  • Surcharges for not using SmarTrip™:  Metro charges $1 per trip for using paper farecards on rail and $0.25 per trip for using cash on the bus.  These surcharges have helped push usage of SmarTrip™ up to about 90%, resulting in the reduction of  fare collection costs.
  • Different fares on different levels of service:  Metro charges $1.60 base fare for local and MetroExtra services.  Buses that travel long distances on freeway lanes cost users a higher fare ($3.65) to correspond with the greater travel speeds.  Metro’s longest distance bus routes, which travel to Dulles and BWI airports, charge a $6 fare per trip.
  • MetroAccess fares are priced at twice the fixed route fare with a cap at $7.  This fare structure is intended to encourage use of the existing fixed route capacity Metro offers, which are available to MetroAccess-eligible customers free of charge.
  • The peak-of-the-peak (POP) rail fare surcharge, enacted in August of 2010, charged customers an extra $0.20 to enter the system during the peak 90-minute periods during the AM and PM peak.  This surcharge was another example of using fares to “optimize the use of existing capacity.”   However, riders informed Metro this fare concept impacted fare policy principles #1 and #2, customer satisfaction and allowing customers to easily determine fares.  In the end, these two policy principles won out and the POP surcharge was eliminated starting July 1, 2012.

What fare concepts might help better align Metro’s fares with the fare policy principles?   What ideas have other agencies implemented that you’d like to be considered for Metro?


Categories: Fares and Service Tags: , , ,

A World Without Metro, Part 1: I-395 Traffic

February 19th, 2013 Comments off

Metro’s new strategic planning process, Momentum, articulates a vision for the the next generation of Metro.  One way to illustrate Metro’s vital role in the region’s transportation network is to show the impact of not having Metro.  This series will give perspective on the many real benefits that Metro conveys to the region today.

Metrorail’s Yellow Line crosses the Potomac from Virginia into DC parallel to I-395’s 14th Street Bridge.  Both the rail and highway bridges move large numbers of people into the regional core during the morning rush hour.   Between the two inbound spans, the 14th Street Bridge has six  lanes.  The Yellow Line provides the equivalent of three additional lanes.  This math is pretty simple:  one lane of freeway traffic can move about 2,420 people per hour (2,200 vehicles per hour times an average auto occupancy of 1.1 people per car) and the Yellow Line moves around 7,400 passengers from Pentagon to L’Enfant Plaza during the peak AM hour.   Another way to see it is that the Yellow Line removes 6,700 (7,400 pax / 1.1 pax per car) cars from the road.

What would happen to I-395 if some or all of the in-bound Metrorail Yellow Line customers switched to driving in the morning?  

If only 5% of Yellow Line customers drove up the freeway to the 14th Street Bridge during the AM peak hour, I-395 would fill with stop-and-go traffic for ten miles.

Map illustrating regularly recurring three-mile queue and the 10-mile queue that would regularly form if only 5% of the inbound AM commuters on the Yellow Line across the Potomac River switched to driving.

Map illustrating regularly recurring three-mile queue and the 10-mile queue that would regularly form if only 5% of the inbound AM commuters on the Yellow Line across the Potomac River switched to driving.

How is this possible?

Read more…

Categories: Impact Tags: , , ,

Metro Anchors the Region’s Growth

February 14th, 2013 Comments off

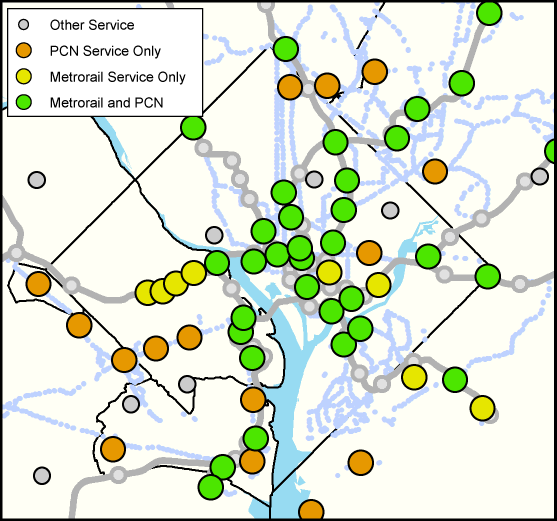
Regional Activity Centers in the core jurisdictions served by high-quality Metro service. Click the image for a full regional map.

Of the 120 COG regional activity centers in the Metro Compact Jurisdictions, 81 are now or will soon be served by high quality Metro transit, either Metrorail or the Metrobus Priority Corridor Network (PCN). That means that two-thirds of these activity centers are primed to support transit-oriented developments. The map above illustrates the activity centers in the core jurisdictions and their level of transit service. Click the image  for a full regional map.

Some jurisdictions have placed a greater emphasis on high-quality transit service when deciding upon areas to designate as regional activity centers.  The chart below shows the total number of activity centers per jurisdiction and the percentage served by Metrorail and/or the PCN.  The core jurisdictions (the District, Arlington and Alexandria) each have over 80% of their activity centers served by high-quality Metro transit.  The beltway jurisdictions (Montgomery, Prince George’s and Fairfax counties) have between 48% and 70% of their activity centers served.   Loudoun County, soon to be added to the compact with two activity centers receiving Metrorail service when the Metrorail to Dulles Phase II comes online, has the lowest percentage of activity centers served by Metro.

The relationship between regional activity and high-quality transit is no accident.  Economic activity gravitates towards areas of greater accessibility, including Metrorail station areas and commercial corridors — once streetcar routes — currently served by Metrobus. However, transit service can also be extended to areas of economic activity which developed due to good highway accessibility, such as Tysons Corner.

As the local jurisdictions continue to focus population and employment growth into these areas, Metro and other regional transit operators are working to connect them to the regional core and to one another through high-quality transit.  It is clear from the current levels of highway congestion that Metropolitan Washington needs more high-quality Metro service (bus and rail) in order to support the growth anticipated over the next 25 years.

One goal of Momentum, Metro’s strategic planning process, is increasing regional mobility and connecting communities.

About the COG Activity Centers

The activity centers list, recently updated by the Metropolitan Washington Council of Governments (COG), describes where the local jurisdictions plan to focus household and job growth in order to support regional goals of transit-friendly development patterns and sustainability. This updated list includes 120 activity centers within the Metro Compact Jurisdictions (including Loudoun County) and additional 19 within the COG planning area not served by Metro, including Charles, Frederick and Prince William Counties, and the cities of Manassas and Manassas Park.
Categories: Impact Tags: , , , , ,

What are the Drivers for Demand of Transit Services?

February 5th, 2013 1 comment

Correlation between weekday Metrorail (monthly total) ridership and the number of jobs in the District of Columbia, FY05 – FY12. Note the “natural log” (ln) of each is illustrated.  The low-ridership outlier is due to Snowmageddon, February 2010.

Demand for public transportation services is not a direct demand, meaning that transit is a means to another end:  a traveler on transit rarely takes transit for the sake of travel but because they have a need for work, shopping, entertainment, etc.  Additionally, many factors determine whether a traveler’s demand for a good or service translates into a public transportation trip or a trip by a private automobile.  Therefore, transit demand is driven by two different sets of factors, the first being the changing demand for goods or services that result in the demand for transportation and the second being the factors that influence which transportation mode is chosen.

For example, having a job creates the need to travel to work.  Yet other factors — such as the levels of transit service between home and work locations, the price of gas, the transit fare, the relative travel time between car and transit, and car-ownership rates – may have some influence over whether the demand for travel translates into the demand for a travel trip. Read more…

How Does Metro’s Subsidy Allocation Work?

November 29th, 2012 Comments off

Like every transit agency in the U.S., Metro receives contributions from the jurisdictions it serves to help supplement revenues from fares and other sources.  The District of Columbia, the State of Maryland and local jurisdictions in Northern Virginia have entered into a compact to fund the operation of the Metro’s buses, trains and paratransit. These compact jurisdictions have agreed to split the tab for operating costs each year using a few allocation formulas. The factors have changed over the years, reflecting changes as the rail system was built, populations shifted, and bus service was restructured.

Operating costs are those that occur every year, like a bus and train operator wages and fuel/power for buses and trains. On the other hand, capital costs occur periodically and cover investments in infrastructure, like repairing tracks and purchasing new vehicles.

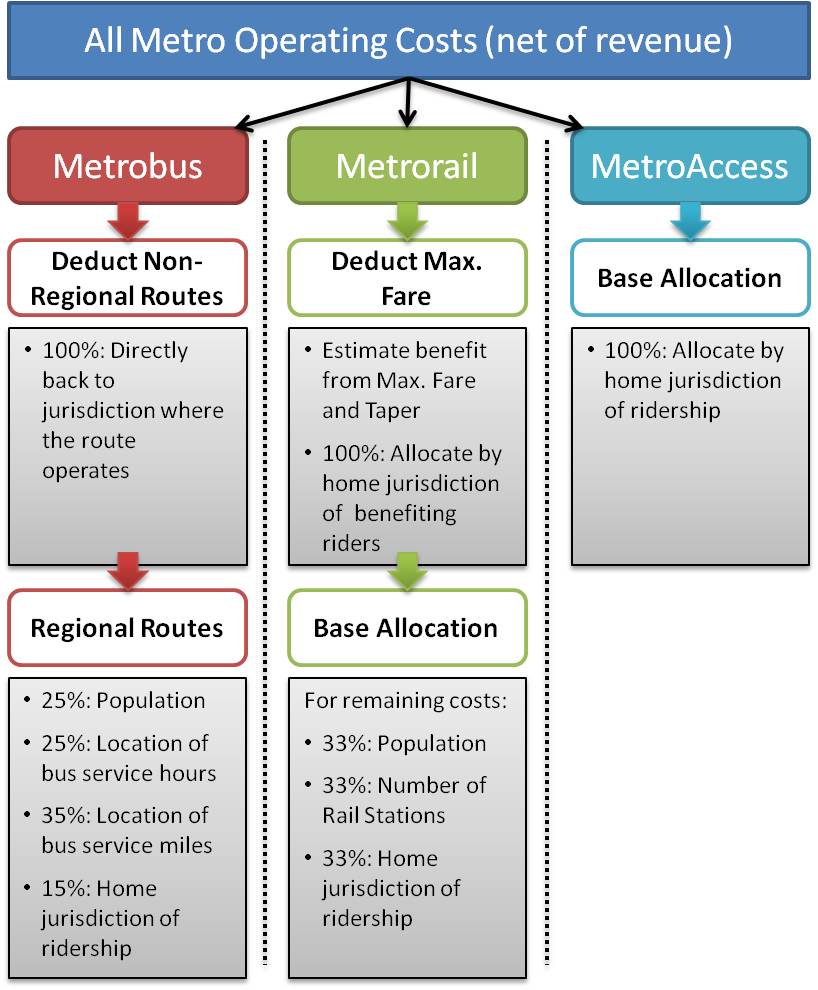
So, how are the operating costs allocated among the different jurisdictions?  The first step is to take the operating costs for each mode and subtract the revenues associated with each, resulting in net operating cost.  The allocation formulas apply to net operating costs (costs minus revenues).  The remaining steps are different for each mode, illustrated in the graphic below and subsequently described in greater detail.

Simplified diagram of Metro’s subsidy allocation process

Read more…

Regional Patterns in TOD Demand

November 27th, 2012 Comments off

Data source:  InfoUSA

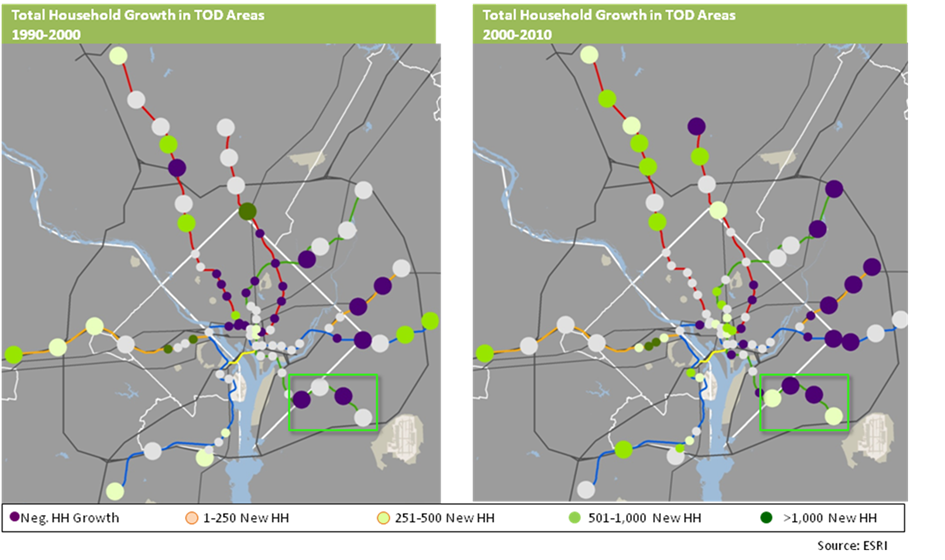
The Washington, D.C. MSA added 275,000 households and 295,000 jobs between 2004 and 2010.  Of that growth, 6.4% of these households and 13.8% of these jobs located within one-half mile of suburban and one quarter-mile of urban Metro station[1].  This is despite the fact that the land area around these Metro stations comprised only 0.5% of the MSA land area, and suggests that TOD locations in the region are capturing 2.76 times their “fair share” of growth when normalizing for land area.

  • Household growth patterns from 2000 to 2010 illustrate that the number of households around almost all of the Metro stations grew, and Metro-proximate households grew at a faster rate than the MSA as a whole. While the Washington D.C. MSA grew by 1.4% from 2000 to 2010, the number of households around Metro stations grew by 4.8% annually.
  • Employment growth patterns show that employment growth in suburban areas of the MSA has been most pronounced around Metro stations, with office-using employment demonstrating a particularly strong inclination to locate near Metro. From 2000-2010, 12% of MSA office employment growth located near transit, and three sectors:Computer systems design and related services; Management, Scientific and Technical Consulting Services; and Other Professional, Scientific and Technical Services represented 41% of office-using employment growth in metro station areas.

This capture rate is a sharp departure from historical growth trends in the region.  Until the 2000s, growth in households and employment had emanated due west from the epicenter of Washington, D.C., and some would argue that outside of growth adjacent to Metro Stations in the historical path of growth – which could arguably include the Rosslyn-Ballston corridor – growth was largely agnostic to transit proximity.

What is driving these shifts?  At least two factors:

  • Regional and national trends indicate that much of the housing growth through 2030 will come from younger, smaller households that are increasingly choosing higher density homes in transit-accessible, infill locations with easy access to employment and entertainment.  Over 67% of the household growth during the 1985-2000 time period had been comprised of one- and two-person households, and the Census projects that upwards of 85% of the future household growth will be comprised of these “smaller” household types.  These households have a built-in demand for walkable, urbane environs that offer multiple opportunities for unplanned human interaction and what Bob Putnam calls “social capital”.  Almost half of all housing consumers express a desire to live in a walkable community, as evidenced by data compiled by the National Association of REALTORS ® in 2004 and again in 2011.
  • Employers seeking competitive advantages in an increasingly-tight market for high-quality labor are returning to urban locations – where their employees want to be – in order to increase retention and attraction prospects.  In addition, research conducted by the Brookings Institution confirms that urbane, walkable communities exhibit calculable and significant value premiums that drive net operating income and asset-level value for developers and investors.


[1] Urban Metro stations include all D.C stations, plus the Rosslyn-Ballston Corridor, Alexandria, and Braddock Road and Pentagon City.  All other Metro stations are classified as suburban.

Categories: Engage, Impact Tags:

MindMixer – What We Heard from the First Round of Question about Momentum: the Next Generation of Metro

November 16th, 2012 2 comments

The first round of MindMixer questions for Momentum: The Next Generation of Metro closed on October 26th. 370 people joined the conversation and posted over 90 ideas, 300 comments, and 1,600 votes. There were 4,300 visits to the site, of which 63% were unique visits. There were almost 24,000 page views and visitors stayed on the site for an average of five and a half minutes. The response was terrific and we’re excited to continue the conversation and new questions are currently on the site.

Who Commented

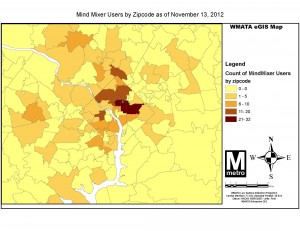
Mind Mixer responses by zipcode. Click for larger version.

Your fellow Metro riders who joined the conversation came from across the region.Below is a map of the number of participants by zip code.Participants ranged from 18 to over 65, with an average age of 36.5. 70% of participants were men.As our ridership is much more evenly split, we’d love to hear from more women, so please don’t be shy!Guys – please tell your female colleagues, friends, and family about the site and encourage them to comment.This month we are advertising on buses and in multiple English and non-English newspapers to further engage our riders, so keep an eye out.

What We Heard

We have compiled a summary of the vote tally from each first round question, as well as a summary of the themes of the comments within each question. The major takeaways for Metro were that our riders have a lot of interesting, creative ideas for small, short-term improvements to their daily ride, many of which could be inexpensive. Additionally, there is a desire for large infrastructure projects to expand the system, connect communities, and increase the capacity in the system core. We also noticed a need for a Metro 101 to better explain the basics of how Metro operates, as well as the pros and cons of ideas and concepts. Stay tuned to PlanItMetro for posts tagged as Metro 101.

Overall, the major themes we heard were:

  • Safety—repair and relieve crowding
  • Address core crowding first
    • More train frequency
    • Bus priority
    • Station entrances; faregates
  • More information
  • Integrate and connect other services, communities
  • Funding—long-term source

How are Metrorail Fares Calculated?

November 15th, 2012 9 comments

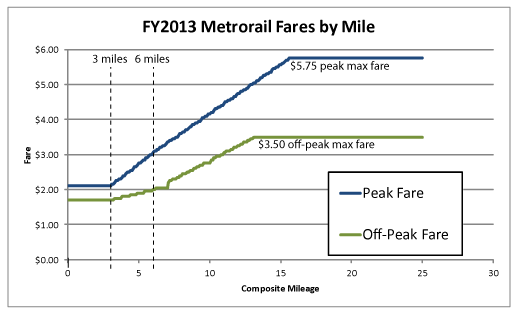
FY13 Metrorail Fares by Composite Mileage

Unlike older subway systems in the United States, Metrorail uses “distance-based” fares, meaning the farther you travel, the more you pay.  While a flat-fare system may be simpler, Metro has established fare policy principles that put a priority on equity rather than simplicity.

Peak Fares:  Peak rail fares are based on distance traveled (calculated to the one-hundredth of a mile).  The first three miles have one base fare, the next three miles have an incremental fare per mile, and smaller incremental fare is charged for the remaining distance. The resulting fare is rounded to the nearest $0.05 and is then capped at $5.75.  The peak fares are show in the chart above as the blue line.

Off Peak Fares:  Prior to July 2012, Metro peak fares and off-peak fares were calculated differently. Off-peak fares were fixed at three tier-based fares: short, medium and long-distance trips.  This presentation on the development of a fare model (PDF) describes the old fare structure in detail. The most recent fare increase changed the off-peak fare structure to be more like the peak fare structure, with off-peak fares generally a 25% reduction from peak fares. Current off-peak fares are show in the chart above as the green line.

The table below shows the peak and off-peak fare increments for Metro’s non-discounted full fares.  Senior citizens and DC students, for example,  receive fare discounts.

Table 1:  Metrorail “full fare” fare structure, FY13.

Peak Off-Peak
Flat fare for first 3 miles of travel $2.10 $1.70
Incremental fare for additional miles above 3 and up to 6 $0.316/mile $0.237/mile
Incremental fare for additional miles above 6 $0.280/mile $0.210/mile
Maximum fare cap, regardless of distance $5.75 $3.50

This fare structure accomplishes the Metro Board’s fare policy principle of providing equitable fares (longer distances pay more) while keeping fares reasonable. Read more…

Categories: Fares and Service Tags: , , ,

Chart of the Week: Influencing Factors on Weekend Metrorail Ridership

November 13th, 2012 2 comments

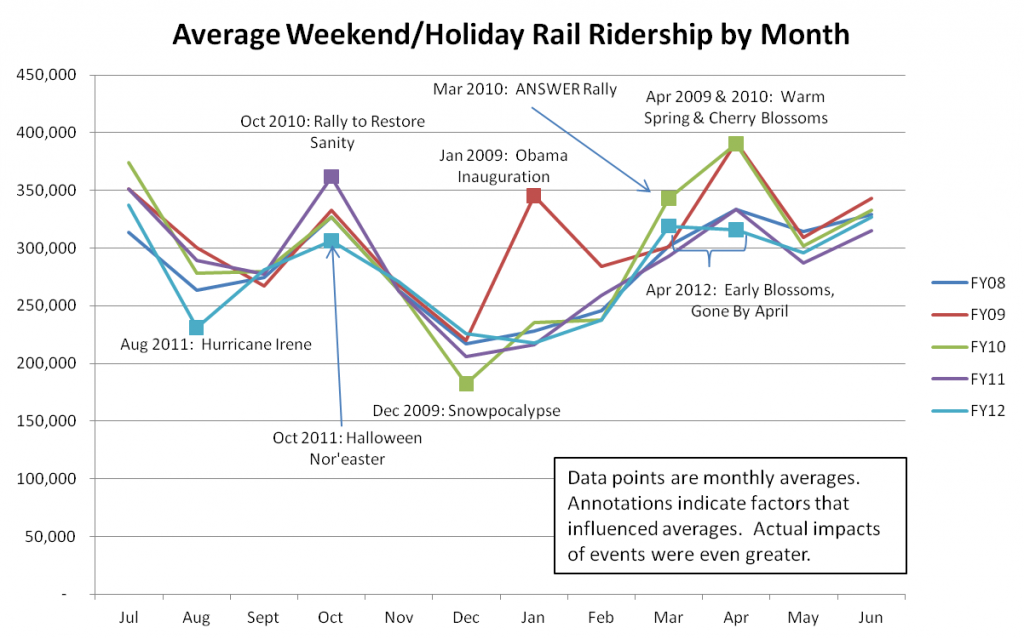
Average weekend ridership by month, FY08 to FY12.Events that impacted the average ridership during a given month are indicated with annotations.(Click for a larger version.)

A recent assessment of rail ridership over the past five years has concluded that in addition to moving people to and from work during the week, Metro also has a critical role to play in moving people to and from weekend activities and special/holiday events.

From the chart above, it is clear that Metrorail supports a large volume of travel to a wide variety of special events that are unique to the area:presidential inaugurations, issues rallies, and cultural events such as the annual Cherry Blossom Festival.  Metro is more than just a commuting tool:  the hundreds of thousands of trips on weekends and holidays show that the rail system is busy on weekends, too.

It is also important to note that Metrorail is not immune from the impacts of severe weather, such as the massive weekend snowstorm in December of 2009 and Hurricane Irene in August of 2011, both of  which cut into ridership and reduced revenues.  And because weekend trips are more often discretionary than weekday work trips, the impact of weather on weekend ridership can be much greater (in percentage terms) than on weekdays.