We explore questions about WMATA’s creation and how decisions are made in our “Metro 101” series.
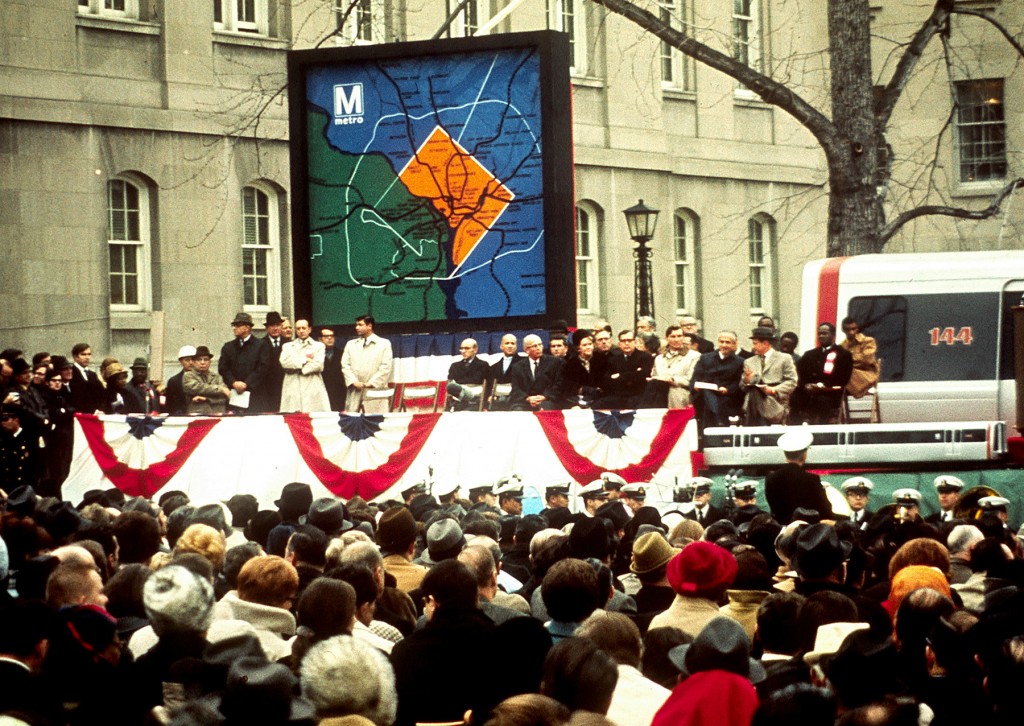
Metrorail groundbreaking at Judiciary Square (December 9, 1969)
Why was WMATA created?
WMATA was founded in 1967 to serve 3 primary functions:
- To plan, develop, finance and “cause to be operated” improved transit facilities as part of a balanced regional transportation system;
- To coordinate the operation of the public and privately owned or controlled transit facilities into a unified regional transit system;
- To serve “other regional purposes” as needed.
Read more…
One of the most critical issues facing public transportation is how to pay for it. In a short series of blog posts, we’ll try to explain Metro’s finances and give you tools to engage in budget discussions.
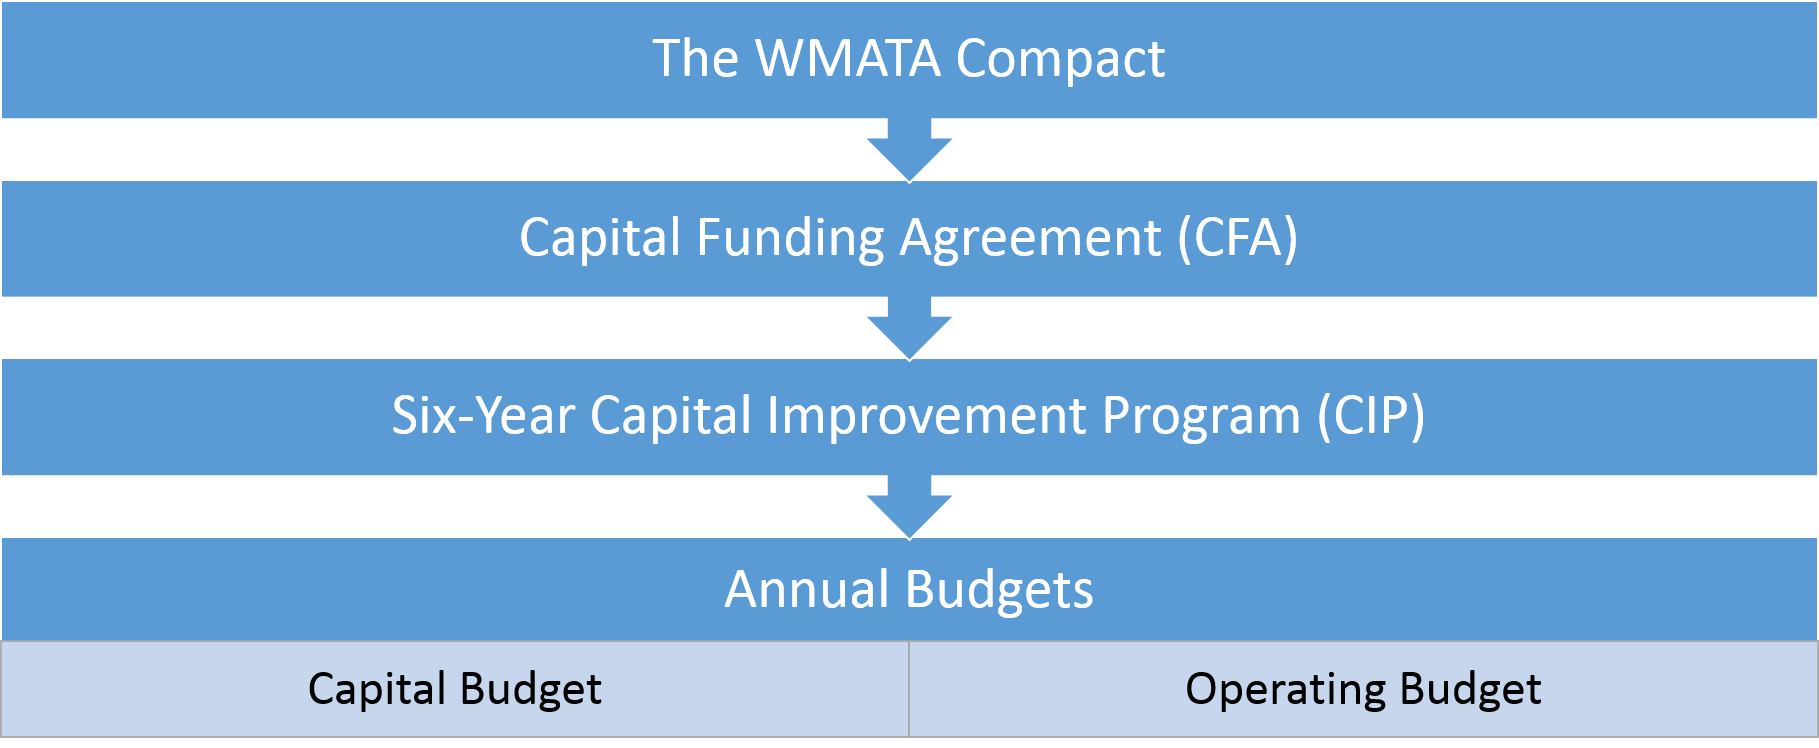
No matter where you stand on the question of supporting or using public transportation, one of the loudest and most constant debates is how to pay for it. It’s a complicated question that combines values, politics, resources, and legal obligations. It also revolves around the technicalities of multiple funding sources (fares, grants, taxes) and how those sources can be spent (allowable types of projects, legal requirements, matching funds, etc.). Most people probably know Metro operates under a yearly budget. However, that annual budget and Metro’s ability to raise and spend funds is shaped by a larger policy and planning framework. This initial post focuses on three pillars of that policy framework: the WMATA Compact, the Capital Funding Agreement (CFA), and the six-year Capital Improvement Program (CIP). It also summarizes the annual budget planning process.
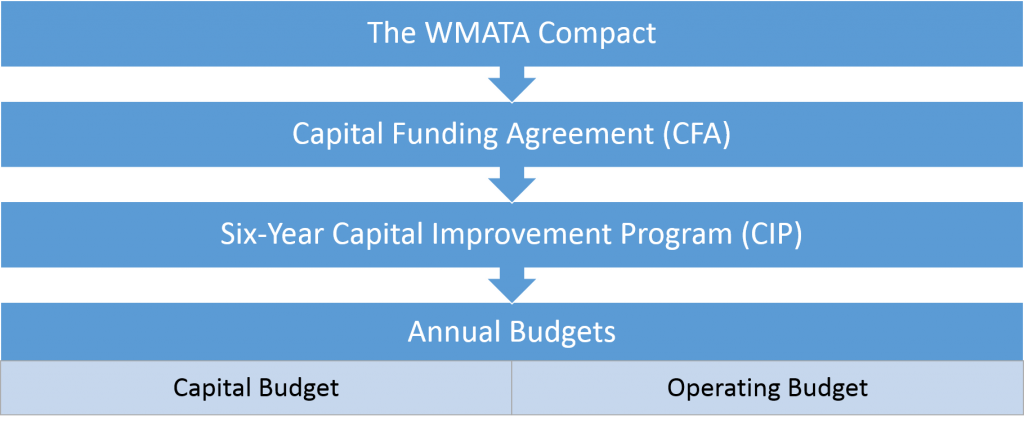
WMATA’s funding policy framework
Read more…
Metro’s new strategic planning process, Momentum, articulates a vision for the the next generation of Metro. One way to illustrate Metro’s vital role in the region’s transportation network is to show the impact of not having Metro. This series will give perspective on the many real benefits that Metro conveys to the region today.
Metrorail’s Yellow Line crosses the Potomac from Virginia into DC parallel to I-395’s 14th Street Bridge. Both the rail and highway bridges move large numbers of people into the regional core during the morning rush hour. Between the two inbound spans, the 14th Street Bridge has six lanes. The Yellow Line provides the equivalent of three additional lanes. This math is pretty simple: one lane of freeway traffic can move about 2,420 people per hour (2,200 vehicles per hour times an average auto occupancy of 1.1 people per car) and the Yellow Line moves around 7,400 passengers from Pentagon to L’Enfant Plaza during the peak AM hour. Another way to see it is that the Yellow Line removes 6,700 (7,400 pax / 1.1 pax per car) cars from the road.
What would happen to I-395 if some or all of the in-bound Metrorail Yellow Line customers switched to driving in the morning?
If only 5% of Yellow Line customers drove up the freeway to the 14th Street Bridge during the AM peak hour, I-395 would fill with stop-and-go traffic for ten miles.

Map illustrating regularly recurring three-mile queue and the 10-mile queue that would regularly form if only 5% of the inbound AM commuters on the Yellow Line across the Potomac River switched to driving.
How is this possible?
Read more…
Like every transit agency in the U.S., Metro receives contributions from the jurisdictions it serves to help supplement revenues from fares and other sources. The District of Columbia, the State of Maryland and local jurisdictions in Northern Virginia have entered into a compact to fund the operation of the Metro’s buses, trains and paratransit. These compact jurisdictions have agreed to split the tab for operating costs each year using a few allocation formulas. The factors have changed over the years, reflecting changes as the rail system was built, populations shifted, and bus service was restructured.
Operating costs are those that occur every year, like a bus and train operator wages and fuel/power for buses and trains. On the other hand, capital costs occur periodically and cover investments in infrastructure, like repairing tracks and purchasing new vehicles.
So, how are the operating costs allocated among the different jurisdictions? The first step is to take the operating costs for each mode and subtract the revenues associated with each, resulting in net operating cost. The allocation formulas apply to net operating costs (costs minus revenues). The remaining steps are different for each mode, illustrated in the graphic below and subsequently described in greater detail.

Simplified diagram of Metro’s subsidy allocation process
Read more…

Since Metro’s MindMixer site opened on September 27th, the response has been overwhelming. To date, we’ve had over 425 participants provide more than 1900 votes, 450 comments, and115 ideason a range of topics. The first round of questions generated over 150 pages of comments alone! The site is expected to continue through the end of the year at a minimum, so please continue to join the conversation.
Metro is using MindMixer to start a conversation with our customers about how they envision the next generation of Metro. A quick review of the site shows a wide range of comments and ideas, some that are short-term and many that are very far in the future.
All comments and ideas are being reviewed as part of Momentum: The Next Generation of Metro, the agency’s strategic plan. Metro staff is responding to some of the comments and ideas as they are posted. Often this is to direct a participant to work that is already underway or to provide short responses or explanations of current policies. Other ideas have created discussions between participants, which is one of the main purposes for the site. The vast majority of ideas and comments require further study, more discussion of what is possible within Metro’s environment, and/or prioritization among other needs at Metro. Many of the ideas also require substantial resources to implement.
As the site continues, we are collating and summarizing your comments and ideas based on themes, such as core capacity, information provision, and non-Metro expansion. This high level summary will be used to support Momentum, our strategic plan, as it provides an indication of the elements that are most important to you, our riders. We will also be taking comments directly from MindMixer to incorporate in the strategic plan document. As part of this blog, we will be further developing some of the ideas and comments to form the basis for a Metro 101 section on PlanItMetro. These posts will help increase the level of understanding of transit in this region. Lastly, for those ideas that require further study, they will be compiled and when MindMixer concludes, this information will be circulated to the respective Metro departments. This will help ensure that decision makers throughout the organization review the thoughtful ideas that have been provided on MindMixer.
Categories: Momentum Tags: 101, Board, Metro 101, MindMixer, Momentum, planning, plans, priority, public comment, studies, survey

FY13 Metrorail Fares by Composite Mileage
Unlike older subway systems in the United States, Metrorail uses “distance-based” fares, meaning the farther you travel, the more you pay. While a flat-fare system may be simpler, Metro has established fare policy principles that put a priority on equity rather than simplicity.
Peak Fares: Peak rail fares are based on distance traveled (calculated to the one-hundredth of a mile). The first three miles have one base fare, the next three miles have an incremental fare per mile, and smaller incremental fare is charged for the remaining distance. The resulting fare is rounded to the nearest $0.05 and is then capped at $5.75. The peak fares are show in the chart above as the blue line.
Off Peak Fares: Prior to July 2012, Metro peak fares and off-peak fares were calculated differently. Off-peak fares were fixed at three tier-based fares: short, medium and long-distance trips. This presentation on the development of a fare model (PDF) describes the old fare structure in detail. The most recent fare increase changed the off-peak fare structure to be more like the peak fare structure, with off-peak fares generally a 25% reduction from peak fares. Current off-peak fares are show in the chart above as the green line.
The table below shows the peak and off-peak fare increments for Metro’s non-discounted full fares. Senior citizens and DC students, for example, receive fare discounts.
Table 1: Metrorail “full fare” fare structure, FY13.
|
Peak |
Off-Peak |
| Flat fare for first 3 miles of travel |
$2.10 |
$1.70 |
| Incremental fare for additional miles above 3 and up to 6 |
$0.316/mile |
$0.237/mile |
| Incremental fare for additional miles above 6 |
$0.280/mile |
$0.210/mile |
| Maximum fare cap, regardless of distance |
$5.75 |
$3.50 |
This fare structure accomplishes the Metro Board’s fare policy principle of providing equitable fares (longer distances pay more) while keeping fares reasonable. Read more…


Recent Comments