Posts Tagged ‘congestion’

Monitoring Passengers Loads on Metrorail – Using New Tools to Examine the Data

January 5th, 2016 8 comments

The new version of the Line Load Application now models passengers into trains by cars. Let’s take a look at this new feature!

Remember in May when we said an updated version of the Line Load Application was coming that would include passenger distribution data at max load locations? Well it’s here now!

If you’ve seen Metro employees with clipboards out during rush hour at major stations, then chances are you’ve seen the Metro load checkers. These individuals mark down the loads of these trains. They also mark down any people who didn’t board. Last but not least, they are also doing this by car, and with that information Metro has been keeping track of the spread of the loads on the cars at the max load stations.

carloads

Average Car Loads in the AM Peak Hour – October 2014 Weekdays – Modeled Distribution of Passengers at Dupont Circle **The estimated railcar crowding is based on the scheduled Red Line service.

Read more…

Planning Tool Update Sheds Light on Rail Car Crowding Distribution

May 18th, 2015 19 comments

Latest version of Line Load tool will feature modeled car-crowding numbers.

Many factors influence which car number of a Metrorail train a customer rides.  Infrequent riders may wait for the train near the escalator and board the nearest rail car. Savvier customers may prefer to ensure they are the first to exit at their destination station or have an shorter walk at a transfer station.  Others may board cars based on understanding where seats are more likely to be available.  All of this activity can result in uneven loading of Metrorail cars across a given train, with some rail cars crowded and others near empty.

As we mentioned in 2013, the Office of Planning has an in-house tool that allows planners to estimate how crowded trains are based on origin-destination ridership data. Currently we are in the midst of a few updates, which will include the Silver Line that opened last year.  Another of the new features that we are excited about is a rail car crowding analysis for the system’s most critical segments.  Based on over six months of rail car-crowding data that was collected at selected stations by rail passenger “checkers,” the train-based ridership data will be distributed across the cars so we can estimate what kind of crowding we have by car number, at the peak load points. The following graph illustrates the observed car crowding variations at Gallery Place.

carcrowding

Customers may experience crowded conditions even when the average rail passenger per car (PPC) numbers (PDF) would indicate otherwise. This new feature is an important addition that will help Metro planners better understand the customer experience.  The car crowding analysis will begin to identify which cars of a train tend to be crowded in the peak hours, and which are less crowded.  This information will the be used as a starting point for devising strategies for better spreading customers across all cars of a train.

How do you choose which rail car you ride in?  Other than berthing trains at the center of the platform (see this informative article over at Greater Greater Washington on that topic), what strategies might Metro consider to better balance customers across rail cars?


How Will The Silver Line Impact The Region’s Traffic Hotspots?

November 19th, 2013 3 comments

The Silver Line will relieve traffic congestion on the Dulles Toll Road and I-66 when it opens in 2014.

This post is a continuation of our series that answers questions about the new Silver Line.

It’s no secret that the Washington region has some of the worst traffic in the country.  Listeners to “drive time” radio are bombarded with rapid-fire traffic reports noting congestion on major regional highways, often caused by “nothing but volume”.  This expression means there is no traffic accident, weather incident or excessive sunshine slowing cars down.   Instead, too many cars are trying to squeeze into too few lanes at critical interchanges, resulting in traffic queues that can extend for miles and miles.

Not surprisingly, the highways along the Silver Line corridor are some of the region’s most congested. The merging of I-66 and the Dulles Toll Road was ranked fourth worst congested location (PDF) in the MWCOG Spring 2011 Traffic Survey.  The survey showed the toll road has three major congestion spots in the AM Peak:  the toll plaza, the interchange with the Capital Beltway and the merger with I-66.  In all three cases, the recurring congestion was caused by vehicles weaving and merging.

Surveyed morning traffic conditions on the Dulles Toll Road, from the MWCOG 2011 Traffic Survey. Image links to PDF report.

According to the MWCOG report, the speed in the traffic queue is between 20 and 50 MPH.  This would result in between 2 and 12 minutes of delay per vehicle joining the back of the queue heading to the toll plaza. Assuming a duration of 2 hours for the queue, average vehicle occupancy of 1.1 and 1,900 vehicles per lane per mile, this results in between 560 and 3,300 person-hours of delay per day, up to 840,000 person hours per year. Read more…

A World Without Metro, Part 1: I-395 Traffic

February 19th, 2013 Comments off

Metro’s new strategic planning process, Momentum, articulates a vision for the the next generation of Metro.  One way to illustrate Metro’s vital role in the region’s transportation network is to show the impact of not having Metro.  This series will give perspective on the many real benefits that Metro conveys to the region today.

Metrorail’s Yellow Line crosses the Potomac from Virginia into DC parallel to I-395’s 14th Street Bridge.  Both the rail and highway bridges move large numbers of people into the regional core during the morning rush hour.   Between the two inbound spans, the 14th Street Bridge has six  lanes.  The Yellow Line provides the equivalent of three additional lanes.  This math is pretty simple:  one lane of freeway traffic can move about 2,420 people per hour (2,200 vehicles per hour times an average auto occupancy of 1.1 people per car) and the Yellow Line moves around 7,400 passengers from Pentagon to L’Enfant Plaza during the peak AM hour.   Another way to see it is that the Yellow Line removes 6,700 (7,400 pax / 1.1 pax per car) cars from the road.

What would happen to I-395 if some or all of the in-bound Metrorail Yellow Line customers switched to driving in the morning?  

If only 5% of Yellow Line customers drove up the freeway to the 14th Street Bridge during the AM peak hour, I-395 would fill with stop-and-go traffic for ten miles.

Map illustrating regularly recurring three-mile queue and the 10-mile queue that would regularly form if only 5% of the inbound AM commuters on the Yellow Line across the Potomac River switched to driving.

Map illustrating regularly recurring three-mile queue and the 10-mile queue that would regularly form if only 5% of the inbound AM commuters on the Yellow Line across the Potomac River switched to driving.

How is this possible?

Read more…

Categories: Impact Tags: , , ,

Congestion Report Highlights Value of Transit

February 12th, 2013 Comments off

Orange Line Metro train from I-66. (Photo by wfyurasko, click for original)

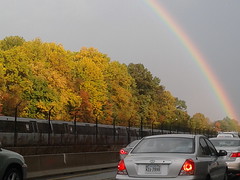
Transit lets many of us bypass the nation’s worst traffic, and plays an important role in managing our region’s congestion. (Photo by wfyurasko, click for original)

You may have seen in the news recently that the Washington region’s traffic is the worst in the country – again. However, missing from the headlines is the crucial role public transit plays in keeping congestion at bay today – and how transit should be a big part of the solution to the region’s traffic problem going forward.

The D.C. region definitely has bad traffic, but transit helps give us good options to avoid it.  In fact, traffic on the roads doesn’t matter to many of you who take Metrorail, walk, or a ride a bike. Census figures tell us that around 20% of our region’s commuters ride transit to get to work, and that number is rising. People in the Washington region are increasingly choosing to live in mixed-use, walkable neighborhoods near transit, giving them the option to avoid congestion altogether. Congestion may be bad, but many of us choose alternatives – and Metro is a big part of that.

Without transit, congestion would be even worse.  The Texas Transportation Institute’s report itself actually points to public transportation as a key way the Washington region has been able to grow despite our congestion.  According to the report, transit in our region is helping drivers avoid over $700 million per year in wasted time and fuel – nearly five minutes per day for each and every commuter, whether they ride transit or not.  In fact, the report is broadly consistent with Metro’s own estimates of transit’s role in congestion in the Washington region. Metro estimates that transit in our region saves drivers $1 billion per year in wasted time, and that transit riders are able to save nearly $500 million in auto maintenance, fuel, parking, and other costs.

Congestion matters to Metro, too – because our buses are stuck in the same traffic as regular cars. Bus-only lanes in key locations, such as H and I Streets NW downtown where buses are 2% of the vehicles but carry 40% of the people, would help make Metrobus a great way to bypass traffic. Metro has designated 24 bus corridors in the region where improvements to help get buses out of traffic could attract 100,000 new bus riders per day.

More transit in the future is a good way to help congestion.  We may never get rid of congestion entirely, but we can build our infrastructure in ways that give us good alternatives to being stuck in traffic.  High-quality public transit may not come cheap, but this report is a good reminder of some of the costs of not investing in public transportation.  The transit project needs identified by Momentum – eight-car trains, bus-only lanes, pedestrian walkways, and resolving rail bottlenecks – will help keep our region moving for years to come, despite the traffic clogging our roads.

Categories: In The News Tags: ,