How Does Metro’s Subsidy Allocation Work?
Like every transit agency in the U.S., Metro receives contributions from the jurisdictions it serves to help supplement revenues from fares and other sources. The District of Columbia, the State of Maryland and local jurisdictions in Northern Virginia have entered into a compact to fund the operation of the Metro’s buses, trains and paratransit. These compact jurisdictions have agreed to split the tab for operating costs each year using a few allocation formulas. The factors have changed over the years, reflecting changes as the rail system was built, populations shifted, and bus service was restructured.
Operating costs are those that occur every year, like a bus and train operator wages and fuel/power for buses and trains. On the other hand, capital costs occur periodically and cover investments in infrastructure, like repairing tracks and purchasing new vehicles.
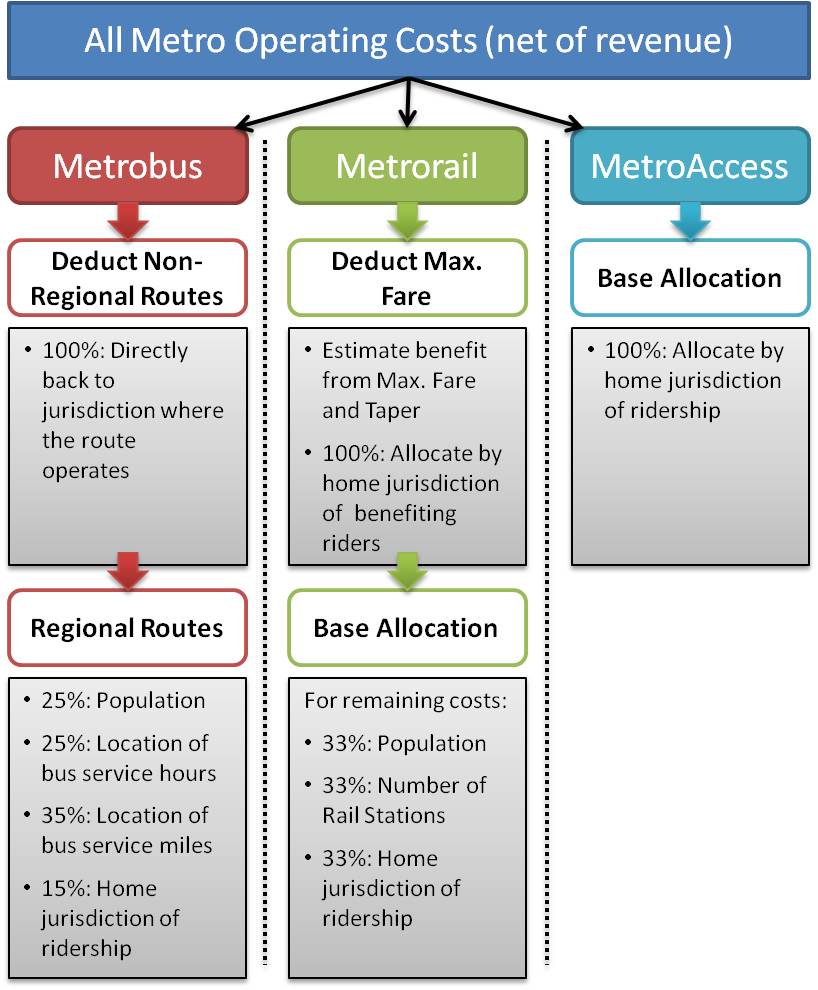
So, how are the operating costs allocated among the different jurisdictions? The first step is to take the operating costs for each mode and subtract the revenues associated with each, resulting in net operating cost. The allocation formulas apply to net operating costs (costs minus revenues). The remaining steps are different for each mode, illustrated in the graphic below and subsequently described in greater detail.
Metrobus. Metrobus routes are classified as regional or non-regional, where regional routes cross jurisdictional boundaries or are considered to have regional significance. The host jurisdiction picks up the entire cost for any non-regional routes (more details). For all regional bus routes, the net cost is divided based on each jurisdiction’s share of the following, using the weights in parentheses:
- Population*, from the Census Bureau (25%)
- The amount of bus service, measured by revenue hours (25%) and revenue miles (35%)
- Weekday ridership, by place of residence, which we learn from on-board surveys (15%)
For example, if one jurisdiction was home to half the Compact’s population, half of all regional Metrobus hours and miles, and 80% of all Metrobus riders, that jurisdiction’s share of the regional bus costs would be:(50% × 25%) + (50% × 25%) + (50% × 35%) + (80% × 15%) = 54.5%. Therefore, the jurisdiction in this example would pay 54.5% of the operating cost of the regional routes. In Fiscal Year 2013, we expect most net costs to be for Regional bus routes – $325 million vs.$73 million in non-regional.
Metrorail. Metrorail’s fare structure charges a slightly lower cost-per-mile for trips over 6 miles (the “taper”), and caps fares at a maximum regardless of distance (the “maximum fare”). We estimate each jurisdiction’s “max-fare allocation” by assessing how much the maximum fare and taper have benefited riders in each jurisdiction and allocate those costs directly. In general, outer jurisdictions have greater max-fare allocations since more of their residents are making longer trips.
Next, the jurisdictions divide up the remaining net cost of Metrorail based on each jurisdiction’s weighted share of the following, using the weights in parentheses:
- Population*, from the Census Bureau (33.3%)
- Number of rail stations (33.3%)
- Weekday ridership, by place of residence, which we learn from our Rail Survey (33.3%)
In Fiscal Year 13, we forecast about $9 million will be allocated off-the-top for the max-fare allocation, and the remaining $155 million will pass through the Base Allocation.
MetroAccess. The actual net cost of each trip is allocated to jurisdictions based on the rider’s home jurisdiction.
More Details. Note that all ridership is by place of residence – not where you boarded the train or bus. For example, if a resident of Fairfax County commutes from King Street (Alexandria) to McPherson Square (D.C.) and back again, both trips count towards Fairfax County. The rail and bus surveys are therefore a critical part to this allocation process, since we can only learn where our passengers live by asking them with a survey. We are in the process of updating the formulas with the Census 2010 population counts; the final missing piece, the final Urbanized Area boundary, was recently published.
* Weighted population: We adjust raw population numbers by each jurisdiction’s population density, which changes the numbers a little – see technical note in the Budget Book and here.
Want more? There is a lot more math and other details of these allocations, beyond this blog post. For more details, see the “Allocation of State and Local Support” section of the “Allocation of State and Local Support” section of the FY2013 Budget Book.


Recent Comments