Author Archive

What Will Happen to the rail schedules with the Silver Line?

March 12th, 2013 25 comments

DullesMap.02.05.13+v4+-+cropped

When the Silver Line opens, Metro will adjust the rail schedule to accommodate increased service. What will change, and how will it affect you?

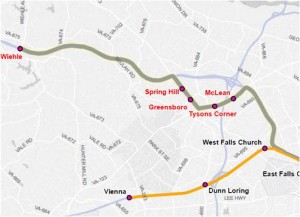
The Silver Line, which will run from Reston and Tyson’s Corner to Largo Town Center, will bring a net increase in rail service. But exactly how will it affect you? That depends on when you travel.

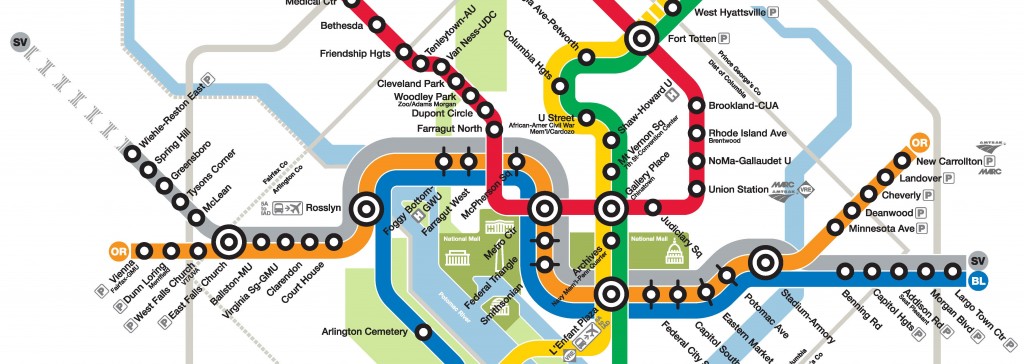
At peak times, Metro will need to make a few adjustments to make room for the Silver Line. The map below shows where the number of trains goes up, down, or stays the same. Metro’s main constraint is at Rosslyn, where three lines – Orange, Blue, and Silver – come together. At Rosslyn and into downtown, Metro can handle a maximum of 26 trains per hour, or a train every 2 minutes and 20 seconds or so.  (To keep things simple, this blog post uses the AM peak hour to illustrate peak rail changes).  In a nutshell, the Silver Line rail operating plan will:

  • Add Silver Line trains every 6 minutes,
  • Redirect 2 more Blue Line trains per hour onto the Yellow Line,
  • Convert some Orange Line trains from Vienna to Silver Line trains,
  • Discontinue some one-way Orange Line trains we currently run (called “trippers”) because they will be replaced by Silver Line trains.

As a result, service will increase in several places, shown in green below: Read more…

Categories: In The News Tags: , ,

What is the Silver Line, and Where Will it Go?

March 11th, 2013 7 comments

New Silver Line stations opening around the end of 2013. (Click for full map)

New Silver Line stations (Click for full map)

You may have heard about the Silver Line – but what is it, and where will it go? What’s nearby the new stations? To go along with the open houses on the Silver Line this week, here’s a primer on some Silver Line basics:

What is the Silver Line? A new Metrorail extension in Virginia serving Tysons Corner and Reston.  Phase 1 is nearing completion now and will open around December 2013. Phase 2 is just beginning construction, and will serve Dulles International Airport and beyond. Because the line serves the Dulles corridor and will eventually serve the Airport, the Silver Line is sometimes called the “Dulles Corridor Metrorail Extension.”

Where will the Silver Line go? The new tracks will branch off from the Orange Line between East Falls Church and West Falls Church. There will be five new stations in Phase 1 – four clustered around Tysons Corner, and one farther west at Wiehle Avenue in Reston. Phase 2 will reach Dulles Airport and beyond in several years.

Read more…

Categories: In The News Tags: ,

Congestion Report Highlights Value of Transit

February 12th, 2013 Comments off

Orange Line Metro train from I-66. (Photo by wfyurasko, click for original)

Transit lets many of us bypass the nation’s worst traffic, and plays an important role in managing our region’s congestion. (Photo by wfyurasko, click for original)

You may have seen in the news recently that the Washington region’s traffic is the worst in the country – again. However, missing from the headlines is the crucial role public transit plays in keeping congestion at bay today – and how transit should be a big part of the solution to the region’s traffic problem going forward.

The D.C. region definitely has bad traffic, but transit helps give us good options to avoid it.  In fact, traffic on the roads doesn’t matter to many of you who take Metrorail, walk, or a ride a bike. Census figures tell us that around 20% of our region’s commuters ride transit to get to work, and that number is rising. People in the Washington region are increasingly choosing to live in mixed-use, walkable neighborhoods near transit, giving them the option to avoid congestion altogether. Congestion may be bad, but many of us choose alternatives – and Metro is a big part of that.

Without transit, congestion would be even worse.  The Texas Transportation Institute’s report itself actually points to public transportation as a key way the Washington region has been able to grow despite our congestion.  According to the report, transit in our region is helping drivers avoid over $700 million per year in wasted time and fuel – nearly five minutes per day for each and every commuter, whether they ride transit or not.  In fact, the report is broadly consistent with Metro’s own estimates of transit’s role in congestion in the Washington region. Metro estimates that transit in our region saves drivers $1 billion per year in wasted time, and that transit riders are able to save nearly $500 million in auto maintenance, fuel, parking, and other costs.

Congestion matters to Metro, too – because our buses are stuck in the same traffic as regular cars. Bus-only lanes in key locations, such as H and I Streets NW downtown where buses are 2% of the vehicles but carry 40% of the people, would help make Metrobus a great way to bypass traffic. Metro has designated 24 bus corridors in the region where improvements to help get buses out of traffic could attract 100,000 new bus riders per day.

More transit in the future is a good way to help congestion.  We may never get rid of congestion entirely, but we can build our infrastructure in ways that give us good alternatives to being stuck in traffic.  High-quality public transit may not come cheap, but this report is a good reminder of some of the costs of not investing in public transportation.  The transit project needs identified by Momentum – eight-car trains, bus-only lanes, pedestrian walkways, and resolving rail bottlenecks – will help keep our region moving for years to come, despite the traffic clogging our roads.

Categories: In The News Tags: ,

Metrorail Ridership on Inauguration Day

January 23rd, 2013 Comments off

On Monday, hundreds of thousands thronged the National Mall to watch the Presidential Inauguration and parade, and many came by Metrorail.  To accommodate the crowds, Metro ran rush-level service for 17 consecutive hours.  Just how busy was Metrorail?  Here are some highlights, using our preliminary faregate counts:

Metrorail ridership (entries) by fifteen-minute intervals, Inauguration Day 2013

  • Total rail ridership came in at about 800,000 passengers for the day– higher than a typical weekday, 2-3 times the level of a weekend day or holiday, but lower than the 2009 Inauguration.
    • It should be noted that this year Inauguration Day fell on the Martin Luther King Jr. Day holiday.  Therefore, part of the lower ridership this year is likely due to many people having the day off this year when in 2009 they did not.
  • Early start! Over 90,000 customers entered the Metrorail system before 7:00 am.
  • By the time the President began speaking at noon, Metrorail had already provided 343,000 trips.
  • From miles around!  End-of-line stations saw the biggest increases in ridership.
  • Carpooling helped many more people access rail at stations where parking is limited.  Franconia-Springfield, for example, recorded over 16,000 rail system entries before noon – 10,000 more than normal, and well over the 5,069 parking spaces available.
  • Hundreds of tour buses at RFK Stadium helped generate 10,200 entries at Stadium-Armory before noon, about 5 times that station’s normal ridership.
  • The afternoon peak lasted nearly 5 hours from 12:30 to 5:30pm. During this time, another 300,000 passengers entered the system – nearly half through only six stations downtown.

Rail ridership was especially concentrated at a few stations around the Mall:

  • By noon, the top 10 busiest stations near the Mall had collectively seen twice as many passengers exiting as a normal weekday.
  • L’Enfant Plaza station recorded an impressive 70,000 exits before noon on Monday (normal is around 15,000 for the same timeframe on a weekday). At one point, between 8:00 and 8:15am, 3,600 people exited at L’Enfant Plaza – about 240 passengers per minute.
  • Gallery Place handled 53,000 entries after noon on Monday (more than twice its normal ridership for the same timeframe) and experienced three “peaks” – 1-2pm after the Inaugural address, 4-5pm after the parade, and then again at 10pm-1am for late-night revelers.
Top 10 Stations for Entries, Before Noon:
  1. Franconia-Springfield: 16,319
  2. Vienna: 14,289
  3. Greenbelt: 12,500
  4. New Carrollton: 11,917
  5. Shady Grove: 10,431
  6. Pentagon City: 10,303
  7. Stadium-Armory: 10,245
  8. Silver Spring: 9,630
  9. Branch Avenue: 9,520
  10. Crystal City: 8,567

Top 10 Stations for Entries, After Noon:

  1. Gallery Place: 53,077
  2. L’Enfant Plaza: 36,628
  3. Metro Center: 34,125
  4. Union Station: 31,574
  5. Farragut West: 22,618
  6. Farragut North: 20,030
  7. Federal Triangle: 19,331
  8. Foggy Bottom: 18,152
  9. Judiciary Square: 14,458
  10. McPherson Square: 13,161

Did you ride Metro on Monday?   These numbers provide one perspective, and we’d like to hear about your experiences in the comments below.

Categories: In The News Tags: , , ,

Metrobus Testing Bike Racks with Space For 3 Bikes

December 13th, 2012 5 comments

Every Metrobus has a bike rack on the front of the bus with room for two bikes. But if you ride the F12 or F13 bus routes around the Cheverly and Landover areas, you may have noticed a different kind of rack on one of our buses – with space for three bikes, not two.  Our Bus group is testing out this new style of rack on one bus operating on the F12 and F13 routes to see how it works. The instructions for using this test rack are the same as the standard racks.

Have you seen or tried this rack? Did you try the middle or back-most rack? What do you think?

Let us know in the comments below.

Metro is testing a new style of bicycle rack on buses with space for 3 bikes.All Metrobuses currently have racks for 2 bikes.


Bikes are allowed on Metrobus at all times, even during peak times. Unsure about how they work? See instructions for how to use the standard racks.

Categories: Planning Studies Tags: ,

How Does Metro’s Subsidy Allocation Work?

November 29th, 2012 Comments off

Like every transit agency in the U.S., Metro receives contributions from the jurisdictions it serves to help supplement revenues from fares and other sources.  The District of Columbia, the State of Maryland and local jurisdictions in Northern Virginia have entered into a compact to fund the operation of the Metro’s buses, trains and paratransit. These compact jurisdictions have agreed to split the tab for operating costs each year using a few allocation formulas. The factors have changed over the years, reflecting changes as the rail system was built, populations shifted, and bus service was restructured.

Operating costs are those that occur every year, like a bus and train operator wages and fuel/power for buses and trains. On the other hand, capital costs occur periodically and cover investments in infrastructure, like repairing tracks and purchasing new vehicles.

So, how are the operating costs allocated among the different jurisdictions?  The first step is to take the operating costs for each mode and subtract the revenues associated with each, resulting in net operating cost.  The allocation formulas apply to net operating costs (costs minus revenues).  The remaining steps are different for each mode, illustrated in the graphic below and subsequently described in greater detail.

Simplified diagram of Metro’s subsidy allocation process

Read more…

Census Figures Show Transit Use Up in Washington Region

November 7th, 2012 1 comment

Data recently released by the Census Bureau show that more commuters are using public transportation than ten years ago, and that transit use has been growing faster than the workforce. Transit’s share of commuters rose from 14.6% in 2000 to 19.4% in 2011. The growth can be chalked up to all transit operators in the region, and it is an encouraging sign that transit’s role supporting the economy has been increasing. Nearly all jurisdictions in WMATA’s Compact area experienced a growth in public transportation usage.

Public transit's share of commuting has grown in the last decade across nearly all jurisdictions in the WMATA Compact area, the latest Census data show.

Transit’s growth in the region highlights the need for us, our partners, and the public to start talking strategically about Metro’s future. Not only are more people taking transit, but more people are choosing to make the Washington region their workplace and home. How can Metro best accommodate growing ridership?  Join the online conversation at Momentum to express your thoughts on these and other questions. Over the next few months we will post questions, conduct polls, and ask you to prioritize various elements of the plan. Your input matters, and we’re listening.

In the coming months, we’ll be releasing what we learned about our rail ridership through the 2012 Metrorail Ridership Survey.These findings from the Census will help put the survey results in context.

The table below shows the change in number of workers for whom means of transportation work is determined, and their transit mode share, between the 2000 Census and 2011 1-Year American Community Survey.

Number of Workers (for whom mode is known)

Transit Commute Share

2000

2011

2000

2011

District of Columbia

260,884

306,801

33.2%

39.6%

Montgomery County

455,331

516,545

12.6%

15.8%

Prince George’s County

397,403

446,551

11.9%

19.5%

Arlington County

116,046

139,722

23.3%

28.4%

Alexandria City

77,190

89,831

16.4%

18.2%

Fairfax County

527,464

580,430

7.3%

9.9%

Fairfax City*

11,845

12,106

7.6%

9.0%

Falls Church City*

5,853

5,667

15.9%

15.8%

TOTAL – WMATA Compact Jurisdictions

1,852,016

2,097,653

14.6%

19.4%

These numbers describe commuters’ “primary” mode of transportation to work. The American Community Survey figures are estimates based on sampling, and are accompanied by statistical margins of error (not shown here).

* Note: For sampling size reasons, the American Community Survey does not publish 1-year statistics for Falls Church City and Fairfax City. This post shows 5-year 2005-2009 ACS statistics for those two jurisdictions.

Data Download: Metrorail Ridership by Origin and Destination

October 31st, 2012 25 comments

Photo courtesy Josh Bancroft (click for original context)

Every day, Metro gathers a vast amount of information on how customers use the system – where and when they pass through turnstiles and board buses, how they pay, and more. There’s much to be learned from this data, and many in the past have done so.  We’ve heard through MindMixer, Metro’s new online community engagement site, that more detailed ridership statistics would be useful.  So in the spirit of open data and collaboration, here’s a data download of rail station-to-station passenger counts, by time period, by day of the week, for May 2012.

May 2012 Metrorail OD Table by Time of Day and Day of Week (.xls, 6.8 MB)

This data can answer many questions, such as: Where do passengers entering at one station go? Where do late-night riders enter the system? How does Saturday ridership differ from Sunday? Which stations are most commuter-oriented, and which are most lively at midday and evening hours?

What does this data tell you? Do you see any patterns? Feel free to post a link in the comments!

What other data that would help answer additional questions?

Technical notes about this data:

  • The data show average ridership, averaged across all days in May 2012, excluding Memorial Day. (We typically use May as an “average” month, since it falls in the middle of seasonal swings, is relatively unaffected by extreme weather, etc.)
  • Time period shows the time the passenger entered (not the time they exited).
  • AM Peak = opening to 9:30am
  • Midday = 9:30am to 3:00pm
  • PM Peak = 3:00pm to 7:00pm
  • Evening = 7:00pm to midnight
  • Late-Night Peak = Friday and Saturday nights only, midnight to closing

What Happens to Metrorail Ridership on Holidays?

October 25th, 2012 3 comments

About ten days a year, Metrorail operates on a holiday schedule. On some holidays, most commuters have the day off, like Christmas, Labor Day, or Independence Day. But other days can be holidays for some, but not others – like Columbus Day, Veterans Day, or Martin Luther King, Jr. Birthday – and these often fall on a Monday or Friday to make a long weekend.  Federal workers, whom we estimate at over a third of peak ridership, usually get these days off, as do others.  Metro often uses some holidays to do trackwork. So what happens to rail ridership on holidays?

To answer this question, this post examines total ridership on holidays over the past few years, by holiday, and by time of day. I excluded Christmas, New Year’s Day, and Independence Day, since these holidays are strongly influenced by how they fall in the calendar, and by the events on the National Mall on Independence Day.

Here’s a look at ridership on the remaining 7 holiday weekdays.  For the sake of comparison, I also show an average weekday, Saturday, and Sunday for May 2012.

Historical Metrorail ridership on holidays, compared to average May weekday, Saturday, and Sunday

So, all holidays shown have much lower ridership than a typical weekday, and are more in the range of a Saturday or Sunday. A typical weekday on Metrorail shows around 730,000 riders per day, with Saturdays about half that, and Sundays around a third of a weekday.  The holidays shown above are in the range of  200,000 to 400,000 riders per day.

Read more…

Categories: Engage Tags: , , ,

Metrobus Fuel Efficiency on the Rise

September 27th, 2012 8 comments

In recent years, the fuel efficiency of the Metrobus fleet has significantly improved, reducing Metro’s fuel expenses, and improving Metro’s environmental sustainability.

Metro’s bus fuel efficiency has increased by 27% over the past eight years, reducing fuel costs and improving environmental sustainability.

Over the past 8 years, the average fuel economy of Metro’s bus fleet has increased by 27%, from 2.96 miles per gallon (MPG) to 3.76 MPG today. The chart at right illustrates this trend, using actual odometer and fuel readings which are gathered and stored by our bus technology group.(Note that these figures include the consumption of compressed natural gas [CNG], expressed as gallon-equivalents. The slight dip in FY2011 is the result of some data loss during a transition to an electronic mileage tracking system.)

What is Causing this Trend? This steady increase in fuel economy is generally the result of technological improvements in the fleet.  Metro has been replacing older standard diesel buses with newer diesel-electric hybrid, CNG, and clean diesel models.  In particular, introducing diesel-electric hybrid buses to the fleet has helped push up the average: on the streets today, our diesel-electric hybrid fleets are achieving average mileage of 4.49 MPG.  Metro purchased its first hybrid bus fleet in 2006, and today these buses provide 41% of Metro’s bus vehicle-miles.commercial jumping castle for sale

Read more…