Metrobus Fuel Efficiency on the Rise
In recent years, the fuel efficiency of the Metrobus fleet has significantly improved, reducing Metro’s fuel expenses, and improving Metro’s environmental sustainability.

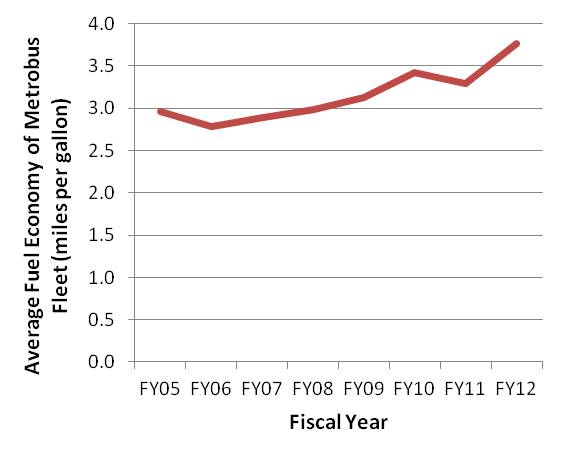
Metro’s bus fuel efficiency has increased by 27% over the past eight years, reducing fuel costs and improving environmental sustainability.
Over the past 8 years, the average fuel economy of Metro’s bus fleet has increased by 27%, from 2.96 miles per gallon (MPG) to 3.76 MPG today. The chart at right illustrates this trend, using actual odometer and fuel readings which are gathered and stored by our bus technology group.(Note that these figures include the consumption of compressed natural gas [CNG], expressed as gallon-equivalents. The slight dip in FY2011 is the result of some data loss during a transition to an electronic mileage tracking system.)
What is Causing this Trend? This steady increase in fuel economy is generally the result of technological improvements in the fleet. Metro has been replacing older standard diesel buses with newer diesel-electric hybrid, CNG, and clean diesel models. In particular, introducing diesel-electric hybrid buses to the fleet has helped push up the average: on the streets today, our diesel-electric hybrid fleets are achieving average mileage of 4.49 MPG. Metro purchased its first hybrid bus fleet in 2006, and today these buses provide 41% of Metro’s bus vehicle-miles.commercial jumping castle for sale
Of course, this is only a fuel efficiency analysis, and more goes into decisions about fuel technologies. Generally, Metro’s experience has shown that lifecycle costs (total capital + fuel + maintenance costs spread over the bus’s lifespan) are comparable across the different technologies, with both hybrids and CNG buses barely more expensive than diesel.
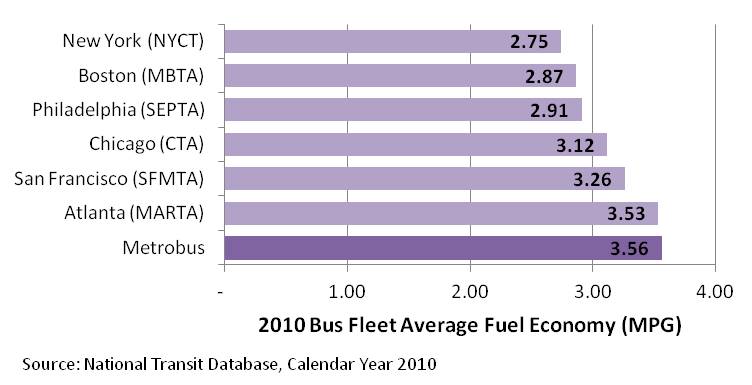
That Seems Low! When average cars get 25 MPG or more, 4 MPG for a bus may not seem like much. But most heavy-duty transit buses operating in a dense downtown environment get around that amount, and in fact Metrobus compares fairly well to other transit agencies in this regard. The chart below compares Metrobus to several other big-city transit agencies for calendar year 2010 (the latest data available in the National Transit Database).

Many big-city urban transit bus operators achieve around 3 miles per gallon.Metrobus compares favorably to other operators (Metrobus has since improved further from calendar year 2010)
What Does this Mean? These improvements in fuel efficiency have meant that our buses can travel the same distance while consuming less gas, reducing fuel costs and emitting fewer greenhouse gas pollutants into the air. Altogether, Metrobuses drive nearly 50 million miles per year, and we typically budget around $40 million per year for diesel and CNG fuel. If diesel costs $3.00/gallon, a change in fuel economy of 0.5 MPG fleetwide equates to approximately $6 million in fuel costs per year. So, small changes in fuel economy have made a big difference.


With total life cycle costs comparable across vehicle technologies, it would be interesting to add another layer to the quantitative part of the analysis – the improvement in emissions and the resulting air quality improvements from the change in composition of the fleet. Although this doesn’t translate directly into benefits for WMATA’s capital and operating budget, measuring these public benefits would be a helpful addition to the analysis above.
Thanks for providing this article.
Great piece, and really nice to see this blog moving beyond just transit planning, there are so many good transit stories to talk about in operations, fare payment, policing, you name it.
For us civilians, this is like getting an upgrade in mileage from 25 to 32 MPG. That’s pretty big. Nice work!
(This is why I prefer to think in terms of gallons per 100 miles — Metro’s performance improved from spending 34 gallons to drive 100 miles to only 27.)
Nice to hear! Although I guess the life-time maintenance costs of the new buses are still early estimates, rising fuel cost should improve the equation for the more efficient buses.
The next thing to look at would be passenger miles per gallon. Since I think passenger numbers are up, I assume that that would show an even bigger relative increase, and would give a better comparison to car fuel economy (and put the low MPG in perspective).
Good point, thanks @Chad . While fuel economy is fairly directly convertible to greenhouse gases, this technology change has also brought about changes in ground-level emissions (NOx, VOCs, CO, etc.). Maybe a future post!
I like the idea, @Thomas. Passenger-miles per gallon would combine an analysis of both our fuel-efficiency and our service-effectiveness, which would be pretty interesting.
To keep things simple to start, we wanted to focus only on fuel economy. But good for a future post!
4mpg doesn’t sound much, but if a bus averages 10 passengers a day, that’s like all of them getting 40mpg. I bet 10 passengers is low.
Also, an M-2 Bradley IFV gets 1mpg. An M-1 Abrams gets 0.5mpg. And they carry far fewer people (but to be fair, they are armed to the teeth and could blow any metrobus off the road or simply drive over one).
@Chad
What would be interesting in a ttotal cost analysis is to see the difference in acquisition cost for hybrid buses vs current technology diesel buses. If it’s anything like the difference in costs between hybrid cars and the same model non-hybrid there’s a higher lifecycle cost.