
Right Underneath our Feet – How Planning, Zoning, and Development Influence Metrorail Ridership
Metrorail ridership is heavily-determined by station-area land use patterns, so attention to land use as a transportation strategy will be important to sustaining Metrorail’s long-term ridership growth.
There has been a tremendous amount of attention recently paid to Metrorail’s ridership trends. While history tells us that the current ridership snapshot – which shows that ridership has essentially flatlined – is quite normal given the cyclic nature of ridership growth, Metro’s Office of Planning has been exploring why certain station areas and rail segments have seen ridership gains during the downturn, while other station areas and segments have seen losses.
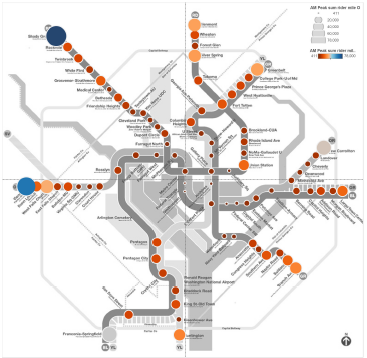
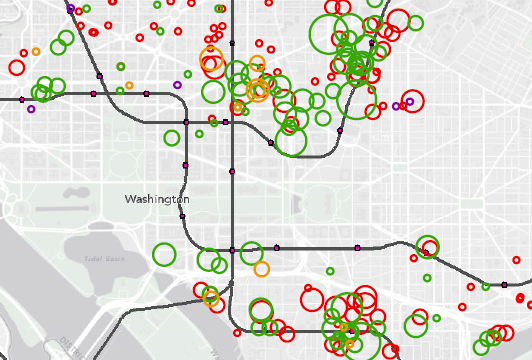
Passenger Miles Traveled by Trip Origin at Each Metrorail Station, AM Pea, Full-Fare Riders with no Transit Benefits. One of the inputs from this study.
The questions we sought answers to included, for instance:
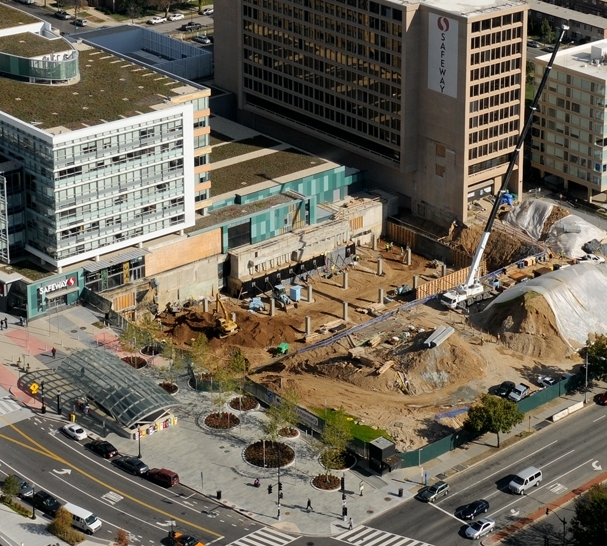
- Why is it that while system-wide ridership declined last year, we saw ridership gains at stations with lots of transit-oriented development, such as NoMA, Columbia Heights, and Navy Yard-Ballpark?
- How much of an impact does transit-oriented development have on overall ridership, and can that impact be measured, both in terms of new ridership as well as in terms of net new farebox revenue?
- With so many ways to get around – including walking and biking and Uber and Lyft – and gas prices at near historic lows, how does a Metorail trip compare to other ways of getting around in terms of overall competitiveness?
- Does the location of a transit oriented development project matter in terms of how much ridership it generates? Does that vary by the type of project (i.e. office, retail, residential, etc)


Recent Comments