
Why We Care About GSA’s Location Decisions: Lessons from the History of Metro’s Federal Customers (4 of 5)
Data show that where GSA chooses to locate federal office buildings has a huge impact on Metrorail ridership from federal commuters. But in the meantime, non-Federal riders in the inner jurisdictions are driving up ridership outside of the usual commute market. (Fourth in a series of posts on Metro’s Federal Customers - see posts 1, 2, and 3)
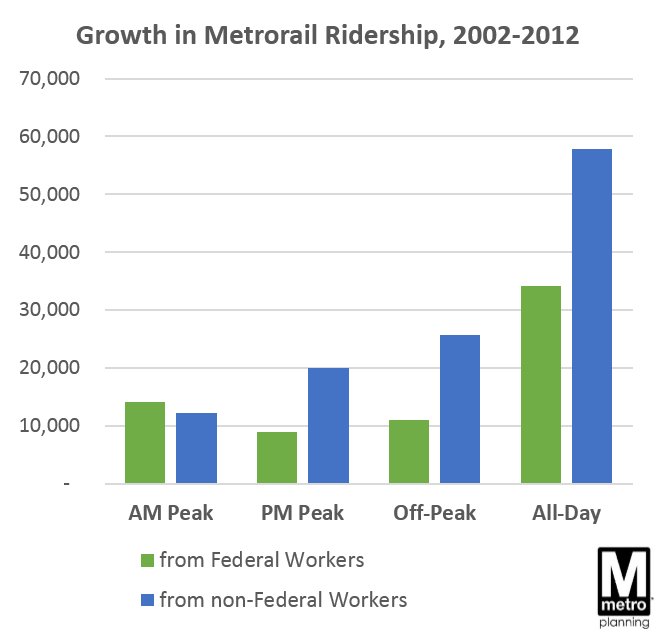 Between 2002 and 2012, rail ridership from federal employees has grown 15%, the same as from non-federal riders. (N.B. this post focuses on rail only; no comparable survey data for bus is available.) Federal employees have remained about a third of total ridership, as overall ridership ebbed and flowed. Most of these new federal riders live in the inner jurisdictions of D.C., Arlington, and Alexandria - ridership from federal employees has been much slower in the outer jurisdictions, particularly Fairfax County (growing at 5-15%, vs. 25-40% over ten years). The growth from federal riders has mimicked existing riders - they are focused on the peak commute too, with a moderate amount of off-peak travel as well.
But over the same timeframe, non-federal customers drove up ridership much faster in the PM Peak and Off-Peak times. These riders similarly come from the inner jurisdictions.
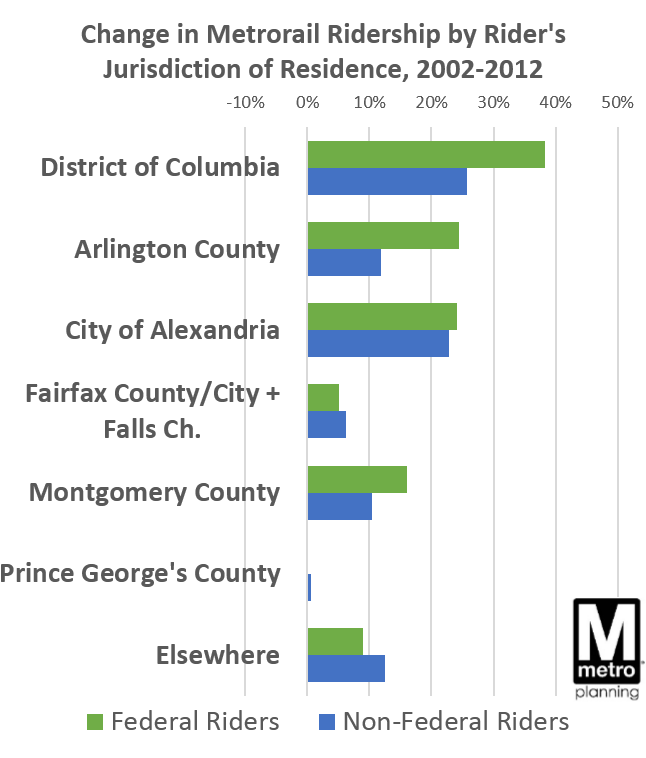 Notably, rail ridership from people living in Prince George’s County was flat between 2002 and 2012, despite the Green Line extension to Branch Ave in 2001 and the Blue Line extension to Largo in 2004.
Looking at this by destination station makes the Federal Government’s decisions about where to locate federal employment abundantly clear. The map below shows change in rail exits in the AM Peak by federal employees between 2002 and 2012.
Change in Destinations of Federal Riders, 2002-2012, AM Peak
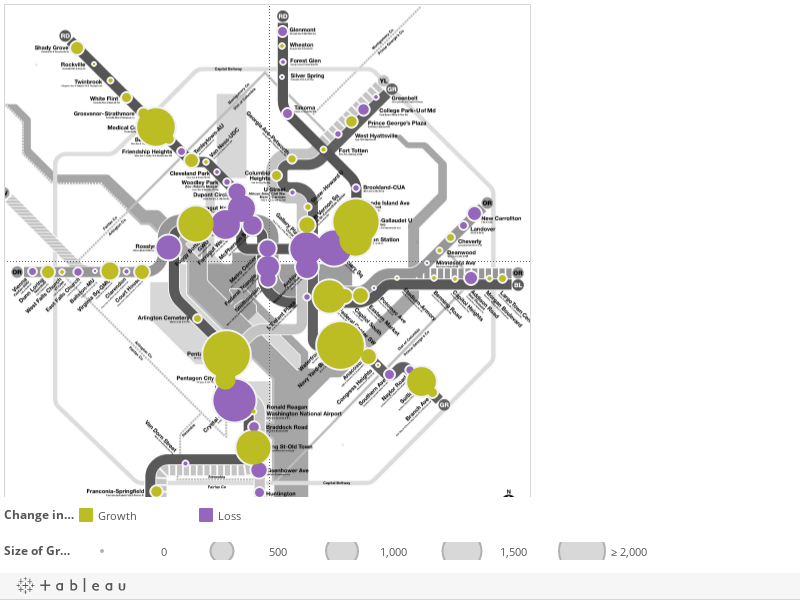
So, why do we care about GSA’s location decisions? Most of the big yellow circles on this map can be explained by where the Federal Government has decided to locate (or not locate) office buildings and facilities. The single biggest jump is Navy Yard-Ballpark station, where ridership from federal customers grew by 2,500 per day after the U.S. DOT moved there. Close behind is NoMa-Gallaudet (1,900 new trips, boosted by the ATF headquarters move there in 2007, and others), and Pentagon (2,000 new trips). We also see gains at Suitland due to the Suitland Federal Center’s arrival in 2001 - gains above and beyond what the other nearby stations saw due to the opening of the Green Line to Branch Ave generally. The BRAC-related decision to relocate Walter Reed Army Medical Center to the grounds of the National Naval Medical Center helped spur nearly 1,300 new exits at Medical Center station from federal workers. In addition, since the U.S. Patent and Trademark Office located near King St-Old Town metro station in 2003, ridership from federal workers increased by over 1,000 exits each morning.
On the other hand, the single biggest loss is at Crystal City, the result of a BRAC-related decision to relocate many federal employees from locations served by Metrorail to locations that are not (the Mark Center and Fort Belvoir, primarily). We also see moderate losses at many stations in the downtown core that are not easily explainable by a location decision.
So are there reasons we might not care about where federal facilities are located? Yes, because we are seeing significant growth from markets that are not federal workers commuting to work. So while Metro advocates for locating federal facilities near Metrorail, other customers are equally important too.
Coming up next - the four biggest questions for Metro’s future and the federal worker!

Love all the posts lately! How are you measuring these stats? Is this data from the on-board survey, or is it drawn from SmarTrip data that receives a transit benefit from a federal employer?
@MLD
Thanks! Yes, this data is all from on-board surveys, since that’s the only way to isolate federal employees. (SmarTrip data can identify SmartBenefits users, but those can be non-federal workers too).
Parts 1, 2, and 3 all use the 2012 Rail Survey and the 2014 Bus Survey combined. This Part 4 uses the 2002 and 2012 Rail Surveys longitudinally. You can pull the stats underlying the visualizations from the Tableau site as well.
If federal workers (and some private sector workers) weren’t subsidized by their employer for riding Metro, I wonder what this survey would show.
Interesting stuff.
The non-federal ridership growth piques my interest in particular, as it wasn’t explored during this post. Any thoughts on why non-federal employee ridership growth has been so much higher in PM peak and off-peak?
Two things come to mind —
1) Perhaps coincides with growth in retail and food/beverage employment in the region (where its conceivable that a shift starts mid-day and ends after PM peak, or starts PM peak and ends after 10PM)
2) There’s been a larger growth in entertainment rather than work-based trips, and these trips are primarily evenings and/or weekends.
Both are interesting as they imply that there are emerging destinations (those where the activity is focused primarily on shopping, dining, and nightlife) that are not part of the traditional bedroom-community-to-downtown-office pathway that Metro focuses are serving.