Posts Tagged ‘rail’

Metro Celebrates Permanent Restoration of Transit Benefit

February 1st, 2016 1 comment

After years of analysis, advocacy and lobbying, Congress has restored the transit commuter benefit to match the parking benefit, helping Metro, the region and the nation.

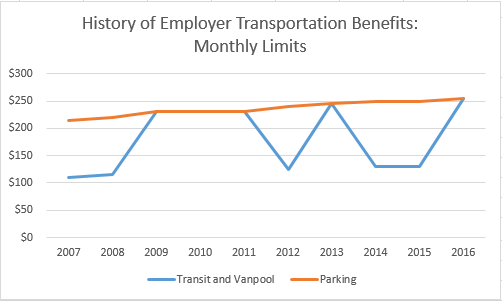
The employer transportation benefit for transit and vanpools has fluctuated a lot in recent years. In February of 2009, it was increased from $120 to $230, matching the parking benefit.  Almost three years later, in January of 2012 it was slashed to $125 only to be raised to $245 the following year.  After only a year, it was slashed again, this time to $130 where it stayed for two full years.  In January of this year, it was raised to $255 to permanently match the parking benefit.  Metro Board of Directors member Tom Bulgeran outspoken advocate for the transit benefit —  played a vital role in ensuring its restoration to match the parking benefit.  Thanks, Tom!

History of Employer Transportation Benefits, Monthly Limits. Data from Wikipedia.

History of Employer Transportation Benefits, Monthly Limits. Data from Wikipedia.

The benefit amount wasn’t the only thing that has been changing.  In 2010, the Metro implemented a series of new IRS rules for how the transit benefit could be used.  For example, on smart media the transit benefit dollars had to be stored in a separate “purse” that could only be use for transit fares and not for parking costs at park-and-ride facilities.  Employers also began asking employees to specify exactly how much transit fare was needed each month, instead of setting one amount and accruing benefits for trips untaken.  Perhaps most importantly, a new rule stated that those unused dollars in this transit-only purse were to be “clawed back” at the end of each month. Read more…

Metro Confidential – Expert Tips to Hack Your Trip

January 7th, 2016 2 comments

In 2016, resolve to travel like a transit pro with these five Metro master tips and tricks.

Even the most seasoned Washingtonian learns a thing or two each day about a tip, tweak, hack, or just plain common sense adjustment to their transit trip that makes their journey quicker, hassle-free, and more fun!  Here are some of our favorites that we hope you’ll try in 2016 – happy transiting!

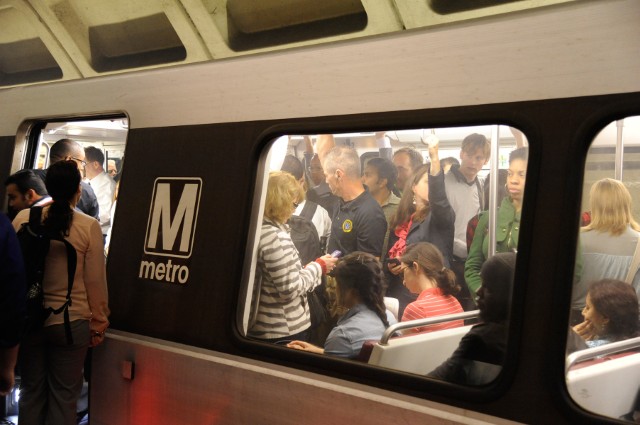
We've all been there. These tips will help you master train crowding and more. Image: WMATA

We’ve all been there. These tips will help you master train crowding and more. Image: WMATA

  1. Set up Auto Reload – You’ve got more important things to do than fuddle with a 1970s era fare machine or to get stuck at the end of your trip without enough stored value to exit the system.  Set it and forget it to skip this step forever!  Auto Reload allows you to set up stored value and pass products so they can be automatically reloaded to your SmarTrip® or CharmCard® when your stored value runs low or your pass is about to expire.
  2. When it comes to train cars, there’s usually more room up front or in back.  WMATA runs trains in two different “consists” – those with eight cars, and those with six.  For whatever reason, customers tend to gather on the platforms near the middle cars and pack them way too tightly.  Meanwhile, even when the middle cars are overloaded, there is often room in the first or last car in the train (Cars 1 and 6/8).  We don’t know exactly why human behavior fosters “bunching” (we do know that lack of traffic priority fosters bus bunching) but now that you know, try the first or last cars when you want to spread out and/or have a seat.
  3. You’ve heard of Next Bus – try Next Station.  What’s that?  A new app?  New service?  Nope – it’s a handy tip for making your journey simpler.  The next time you’re approaching your destination, try peeking up from your phone and get into the aisle (not vestibule, and please don’t block priority seating if our most sensitive customers are standing!) one stop ahead.  That way you are pre-positioned to exit the train without pushing/shoving through on boarding passengers (or getting elbowed yourself as you slow everyone else down!)
  4. Plan an exit strategy.  I’m a Red Line rider and my office at WMATA is convenient to Judiciary Square.  I try and make sure to board the train at Car 3, door 1.  That way I’m exactly where the escalator meets the platform when I disembark.  Try figuring out your exit strategy next time you travel, or use the Metro Master website.  Which car and door makes the most sense for your journey?  How does that work with/against the tips above?
  5. There’s an App for that.  WMATA works with the developer community to help them help you.  Choose from the multitude of apps out there that help you plan the perfect transit trip.  Is your line running smoothly or gummed up?  Hop on a bus or take the train?  Blue for you or Hello Yellow? Eliminate the guesswork and join the transit technology revolution – you’ll be surprised how much easier your trip is when you app before you tap.

What other tips help you ride Metro like a regular?


Sneak Peak of Metro Activities at the 95th TRB Annual Meeting

January 7th, 2016 No comments

The 95th Transportation Research Board (TRB) annual meeting is coming to town!  This annual meeting will host 12,000 transportation professionals from around the world and more than 5,000 presentations covering all transportation modes, including public transportation. At the 2016 annual meeting, Metro staff will be sharing Metro’s experience and best practices on a number of transit development and planning initiatives.

Jordan from the Office of Performance will introduce the development of a new performance measure of travel time reliability (Event 823: Where is My Ride?).  This new measure can be used by customers to better plan their trips and by Metro to optimize rail operations. Read more…

Why We Care About GSA’s Location Decisions: Lessons from the History of Metro’s Federal Customers (4 of 5)

December 2nd, 2015 4 comments

Data show that where GSA chooses to locate federal office buildings has a huge impact on Metrorail ridership from federal commuters.  But in the meantime, non-Federal riders in the inner jurisdictions are driving up ridership outside of the usual commute market. (Fourth in a series of posts on Metro’s Federal Customers – see posts 1, 2, and 3)

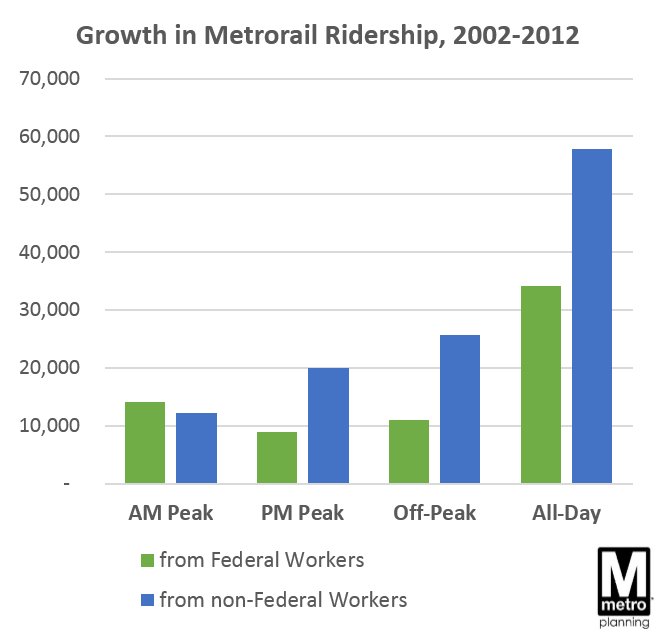
Growth in Metrorail Ridership from Feds by Time of DayBetween 2002 and 2012, rail ridership from federal employees has grown 15%, the same as from non-federal riders.  (N.B. this post focuses on rail only; no comparable survey data for bus is available.)  Federal employees have remained about a third of total ridership, as overall ridership ebbed and flowed. Most of these new federal riders live in the inner jurisdictions of D.C., Arlington, and Alexandria – ridership from federal employees has been much slower in the outer jurisdictions, particularly Fairfax County (growing at 5-15%, vs. 25-40% over ten years).  The growth from federal riders has mimicked existing riders – they are focused on the peak commute too, with a moderate amount of off-peak travel as well.

But over the same timeframe, non-federal customers drove up ridership much faster in the PM Peak and Off-Peak times.  These riders similarly come from the inner jurisdictions. Read more…

Metro’s Federal Customers: A Snapshot (1 of 5)

November 19th, 2015 Comments off

Think Metro is all about getting the federal commuters to work? Think again!

(First in a series of posts on Metro’s customers who are Federal Government employees)

Just as the workforce in the Washington region has a sizeable share of federal workers, so has Metro’s ridership.  Metro serves major federal employment centers downtown, and even boasts stations named for the federal sites they serve, like Federal Triangle, Medical Center, and Pentagon. But while Metro has a long supported the federal government, it’s a myth that Metro is all about federal government commuters and nothing more. Federal workers are a minority of riders and have been for years, and federal funding is playing an increasingly smaller role in Metro’s finances.

So just who are Metro’s federal customers?  When and what do they ride? Where are they coming from and going to, and how has this changed in the last decade? The next series of posts seeks to answer just that, using passenger survey data (bus and rail) where customers identified as employees of the federal government or not (contractors excluded).

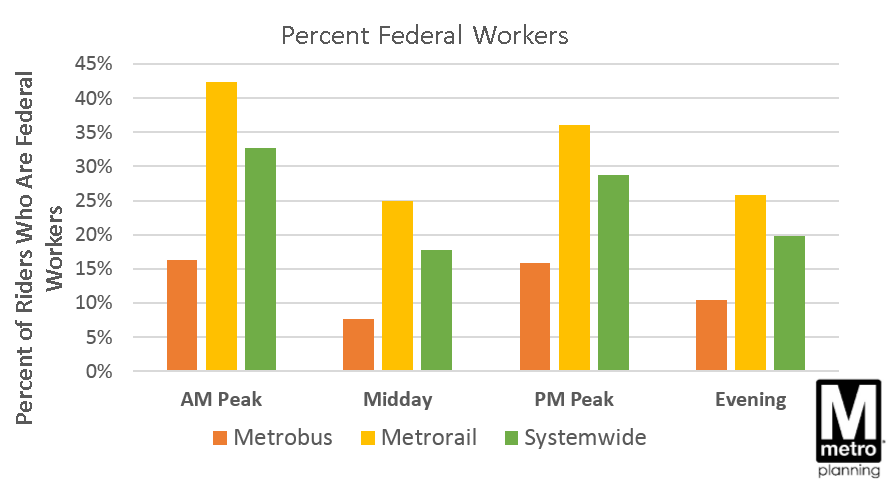
How Many, Where, and When? About 27% of all Metro weekday trips are made by federal workers – a total of 317,000 boardings across bus and rail.  These federal employees can be anyone from a nurse at Walter Reed Medical Center, to a military officer at the Pentagon, to a Congressional staffer on Capitol Hill.  The majority of these trips (255,000) are made on Metrorail, where federal workers make up 35% of all boardings (all-day).  The remainder – just over 60,000 boardings from federal workers – happen on Metrobus, where riders are generally less likely to be federal workers (14% of all bus boardings are federal).

Pct Fed Workers by Mode and Period Read more…

Beyond Rush Hour – Taking a Peek at the Off-Peak

November 18th, 2015 3 comments

Metrorail ridership isn’t only about rush hour! Here’s a deeper look at why off-peak riders travel, and what segments are most traveled.

You may not be surprised that the peak period travel on Metrorail is dominated by commuting and business related trips.  Every day from opening to 9:30am, nearly 90 percent of passengers travel to work and business.  However do you know that over almost a third of daily ridership takes place in the off peak?  This post explores what is happening during weekday off-peak periods.

The weekday “off-peak” time typically refers to the weekday midday period (9:30am to 3:00pm) and the weekday evening period (from 7:00pm to closing), excluding late night service on Friday and Saturdays between midnight and 3:00am. In recent years, weekday off-peak travel demand has remained stable at 32 percent of the daily ridership, with the midday ridership at 19-20 percent and the evening ridership at 12 percent.

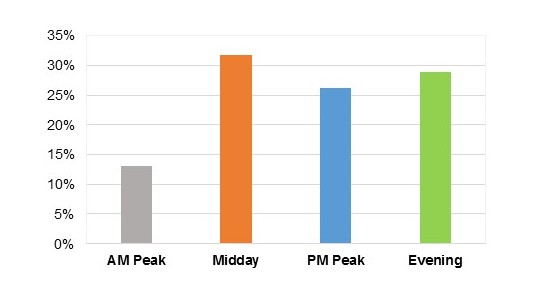
Most non-work trips, such as personal, recreational, and shopping trips, occur during the off-peak times and are spread fairly evenly between the midday and evening, as illustrated in Figure 1. 

blog figure

Figure 1: Percentage of Non-Work Trips by Time of Day (2012 Metrorail Passenger Survey)


The off-peak, non-work travel market has showed strong growth between 2007 and 2012 (our last two passenger surveys where we can distinguish between work and non-work travel). According to the Metrorail passenger surveys, off-peak non-work trips grew by 15 percent for the midday and evening from 2007 to 2012, higher than the 9 percent increase in the daily non-work trips. Read more…

Metro to Create First Regional Open Transit Schedule Data Feed

September 14th, 2015 2 comments

Metro is coordinating with other regional agencies to release a single data file that will contain schedule data for all transit operators in the Washington DC Metropolitan Area.

Over 10 years ago, Metro began coordinating with local bus operators and commuter rail agencies to incorporate all of their transit schedules into wmata.com Trip Planner.  It took some time and effort, but eventually Metro reached agreements with all the operators in the region and began to consolidate transit schedules in one online, searchable data source.  In fact, Metro’s Trip Planner is the most comprehensive online data source for regional transit trip planning.  So much so, that when the Transportation Planning Board (TPB) needs to update their four-step travel demand model they request all of the region’s transit schedules from Metro and we deliver them as a General Transit Feed Specification (GTFS) file.

Over two years ago, we posted here a data visualization of that GTFS file developed by STLTransit.  GreaterGreaterWashington subsequently published a post advocating for the public release of this regional GTFS file, arguing that it would fill a big gap in regional online transit trip planning.  There are two primary benefits of Metro releasing this file:

  • Sites and app developers can load one data file for all the region’s transit instead of downloading separate files for each agency.
  • Only some agencies in the region publish their own GTFS files, and releasing this file will make several agencies’ schedule data available online for the first time.

Over the past two years, Metro staff have worked to negotiate the release of this GTFS file.  We were pleased reach out to the other regional operators in July requesting sign-off on a regional data-sharing agreement that would permit Metro to release the other agencies’ data online in this GTFS format.  We are excitedly awaiting executed agreements from the operators, and we’ve received one back already, thanks RideOn!  Once we have received a few more replies, we will begin to publish a regional file including the data of all agencies that have executed the agreement.

In the meantime, feel free to contact your local bus, commuter bus or commuter rail operator and ask that they expedite the signing of this regional transit schedule data sharing agreement.

Categories: Engage Tags: , , , ,

Ask the Professors – How Local Land Use Decisions Impact Metrorail Ridership

August 24th, 2015 1 comment

This post is guest-written by Chao Liu, Hiro Iseki, and Gerrit Knaap, researchers from University of Maryland’s National Center for Smart Growth, who helped Metro develop our Land Use Ridership Model.

Even though Metro doesn’t control where new jobs and households locate in the region, these decisions are critical to the agency’s ridership and financial future. 

It is well known that the form and intensity of development in and near rail transit station areas can have measurable impacts on transit ridership.  For these reasons, transit oriented developments (TOD) generally feature high-density construction, mixed land uses, and bike and pedestrian friendly infrastructure.  But not all TODs are alike, and the effects of TOD on transit ridership are likely to depend on how well the station is connected both locally and regionally, whether the station is near the center or end of a transit corridor, and what kinds of jobs and household are located nearby.

To explore how different forms of development might impact ridership on the Washington Metrorail system, Dr. Hiroyuki Iseki and Dr. Chao Liu assisted Metro to develop a direct ridership model (DRM), called Metro’s Land Use Ridership Model.  A DRM uses statistical techniques to quantify the relationship between entries and exits at rail stations and land uses nearby.  This model can then be used to estimate the number of passengers who will access the station, by waking or biking, as a result of changes in land use features, transit service characteristics, and socio-demographics within the walkshed of any given station.

The direct ridership model includes a large number of variables for each station, including the density, diversity, and design of local environment; transit service and connectivity; job accessibility by auto and transit; walk score; the availability of parking; the demographics of nearby residents; the number and types of jobs nearby, and more.  The model was estimated for the AM Peak, Midday, PM Peak, and Evening travel periods.  The AM Peak model is best suited for estimating the increase in morning boardings that would result from locating more households near the station; the PM Peak model is best suited for estimating the increase in afternoon boardings that would result from locating more jobs near the station.
Pedicted AM Peak Entries per New HH

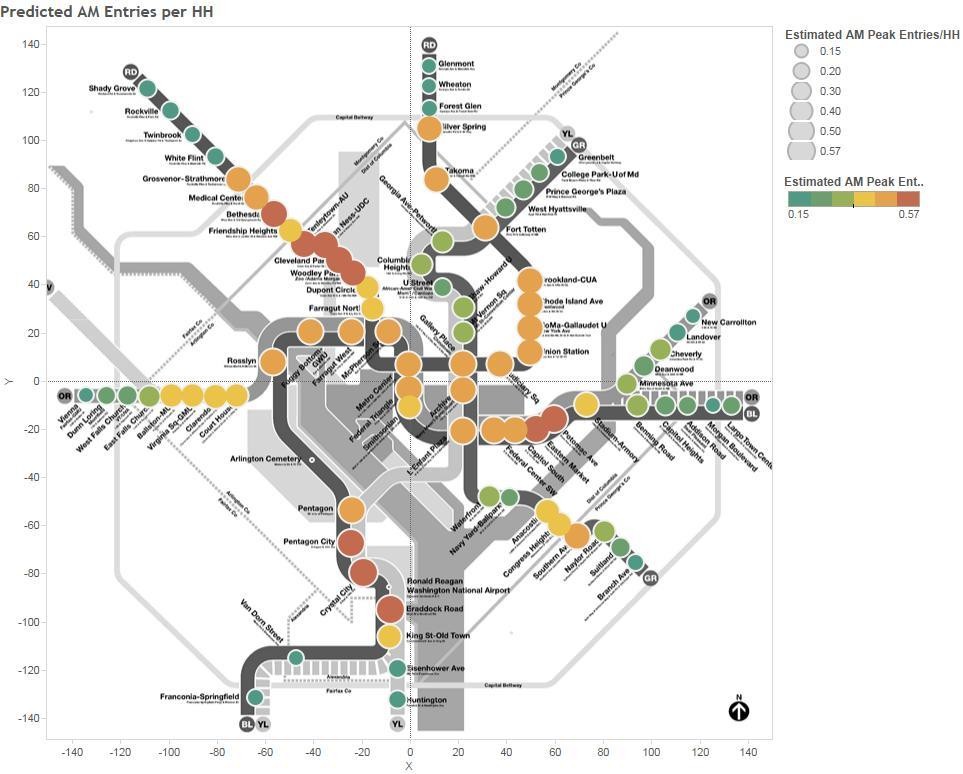
Map 1. Predicted AM Peak Entries per New Household

The impact of adding jobs and households near stations varies by station area.  Map 1 above, for example, shows the estimated entries per new household in the morning peak—that is, how many additional boardings would occur in the AM peak if one additional household was located in the walkshed of the station.  Stations shown by red dots gain more than 0.57 boardings per day, for each new household in the walk shed, while stations shown with green dots gain only about 0.20 boardings per day. As a concrete example, Rhode Island Row is a 274-unit, mixed-use, TOD project built on a WMATA site.  Situated along the busy Red Line, the project has long been considered as a prime location for new housing development.  According to the DRM model, adding 274 new households near the Rhode Island station would increase boardings by 144 passengers in the AM peak.  The same development at the New Carrollton station, however, would have added only 52 passengers.  This is because, compared to New Carrollton, the Rhode Island Avenue station has better job accessibility and more frequent transit service, and is thus likely to stimulate more transit ridership. Read more…

Rhode Island Avenue – an Opportunity to Truly Connect Communities (and Bolster WMATA Finances)

July 23rd, 2015 5 comments

Low-cost planning maneuvers could increase transit-accessibility for one thousand households and save the region $1.3 million per year!

We recently covered an exciting development project in Northeast D.C., one that will create housing and jobs right next to the Rhode Island Avenue Metro station. Because the site is located within the station’s half-mile walk shed, all those new residents, employees and shoppers are likely Metro customers, whose fares will help improve the system for everyone.

But is that the end of the story?

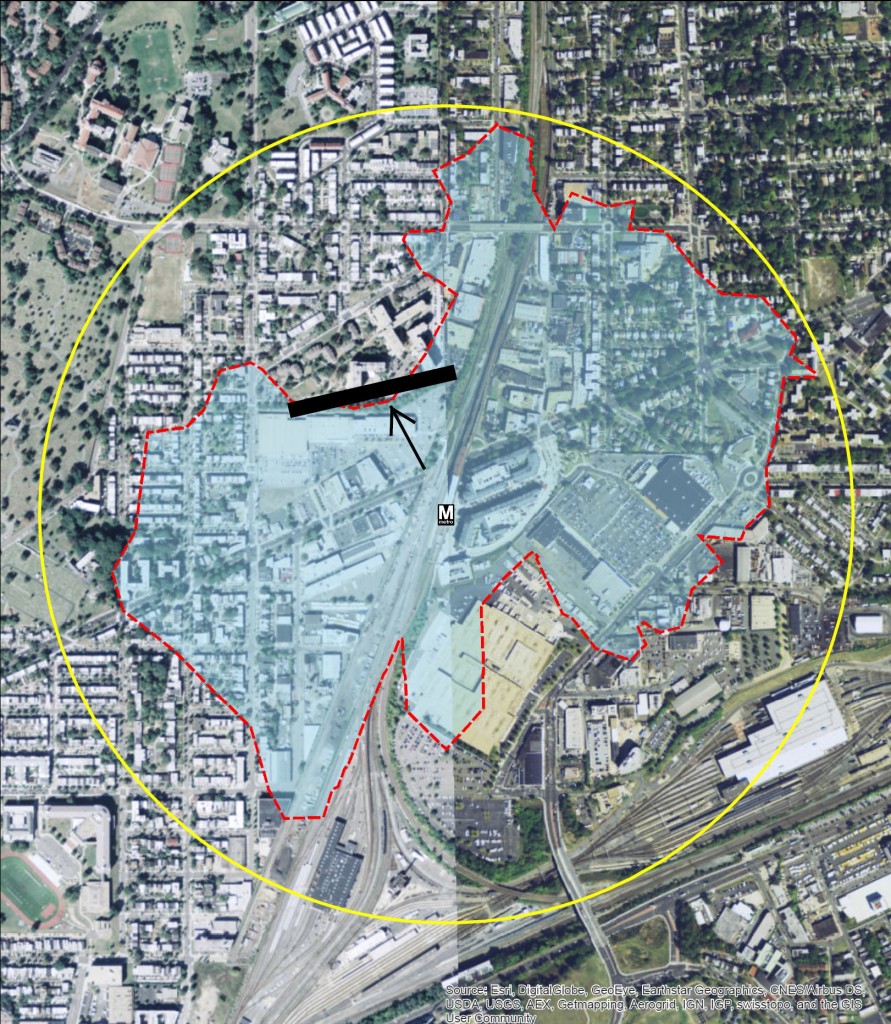
In our analysis of station walk sheds — the area within a half-mile walk of the station — we discovered that the Rhode Island Avenue walk shed is constrained by physical barriers that force pedestrians to make lengthy detours. The most notable of these is a retaining wall along the northern edge of the redevelopment site (currently the Rhode Island Center shopping mall):

RIExisting+Barrier

Current walk shed of Rhode Island Ave station, with illustration of the retaining wall.

For Edgewood residents living immediately to the north, walking to the Rhode Island Avenue Metro requires a detour around the barrier that inflates the walking distance by up to half a mile – making the total walking distance a full mile or more. While some choose to make the long hike to the station, we know that people are significantly more likely to use Metro if the station is within the half-mile walk shed.

This led us to ask: What if we make a pedestrian connection through that wall part of the large-scale redevelopment? Read more…

Do You Bike to Metro in Fairfax County? Your input is needed!

April 28th, 2015 Comments off

Fairfax County seeks input from bike-and-ride commuters.

Bike FairfaxAs we have discussed previously, safe and convenient pedestrian and bicycle access is critical to Metro’s success, and WMATA works closely with local jurisdictions to find ways to improve conditions for customers arriving on foot or bike. Compared with the high expense of building more parking garages for park-and-ride customers, investing in better walking and biking infrastructure is an incredibly cost-effective way of attracting Metro customers. On Metro station property, WMATA is making investments such as bike parking and path improvements.  On the public streets beyond, our local and state partners are installing their own new facilities for people walking/biking to the station. Read more…