With a wide variety of languages spoken in our region, Metro uses the latest Census data to inform how we reach out to the diverse communities we serve.
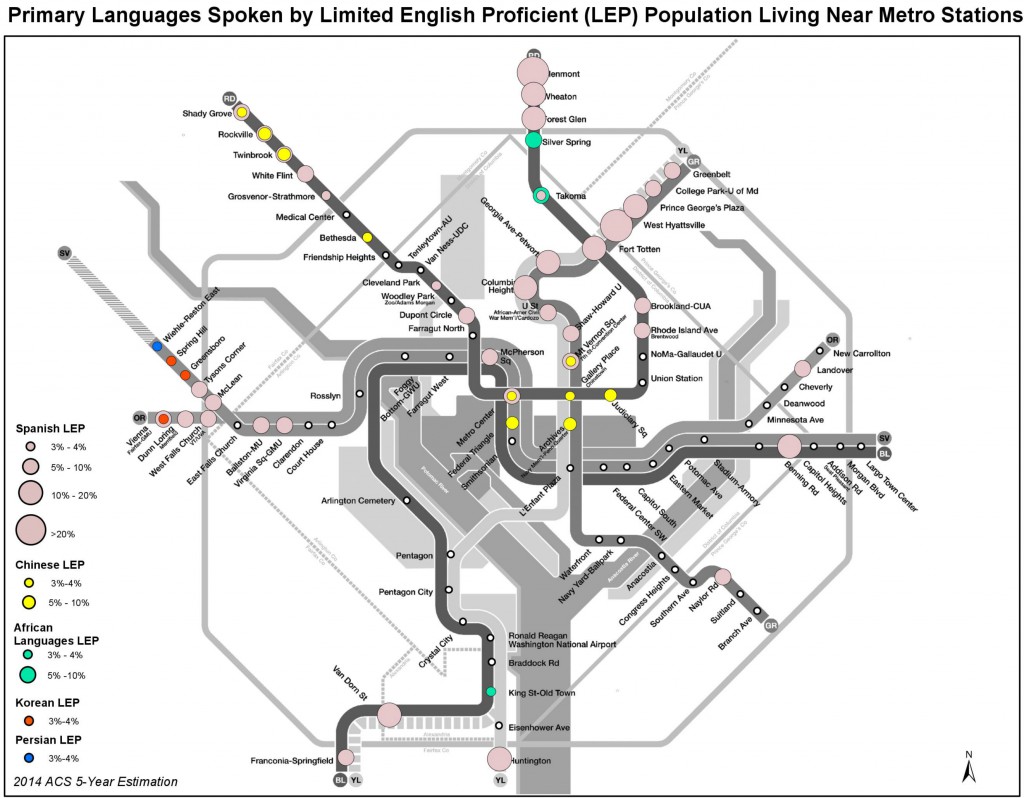
Federal Transit Administration (FTA) guidance to transit agencies on meeting the needs of limited English proficient (LEP) populations - i.e., those who have a limited ability to read, write, speak, or understand English - says that the agency should provide written translation of vital documents for “each eligible language group that constitutes 5 percent or 1,000 persons, whichever is less, of the total population of persons ‘eligible to be served’.” For a region like ours, that’s a pretty tall order as there are more than 26 non-English language groups where there are more than 1,000 speakers of the language. However, by aggregating the latest Census-based language data for areas near our Metrorail stations and bus routes, we can develop a better understanding of the linguistic diversity in Metro’s service area as well as the proportion of LEP persons.
To ensure rider communication and meaningful public outreach to these language populations, Metro develops a Language Assistance Plan that is updated every three years, with the next update due in 2017. The Census language data developed for this document guides the types of information we need to translate and helps inform our public outreach activities. This latest round of language data shows that the top seven languages spoken in our service area are Spanish, Korean, Vietnamese, Chinese, French, Arabic and Amharic. For these languages, we provide written translations of all vital materials and offer language assistance services upon request. The map below shows the predominant LEP populations near each Metrorail Station along with the proportion of LEP speakers for each language.
Read more…
A new tool helps estimate ridership and revenue from transit-oriented development projects near Metrorail stations. Download it for yourself!

For months we have been detailing our work that quantifies the relationship between land use and rail ridership. This is important because Metrorail has been experiencing large changes in ridership, and we were interesting interested in understanding why certain station areas – like Navy Yard and NoMa – were showing ridership gains while the system as a whole is experiencing losses in the long arc of ridership growth.
To get to the bottom of this, we worked with researchers from the University of Maryland’s National Center for Smart Growth to analyze how walk ridership at a Metrorail station relates to its surrounding land uses, and create a tool that accurately estimates the likely change in ridership from changes in land uses. This tool, the Station Walk Area Ridership Model (or S.W.A.R.M., for short), helps us estimate the potential impacts of land use changes – new households, new jobs (by type of employment!), and even changes in the station’s walkshed – on ridership and revenue to Metrorail. Read more…
Metro’s commitment to developers was well received following our informal “Coffee Chat” event designed to foster connections between and among Metro and the developer community.
Wednesday, Metro set aside some time for Developer Coffee Chats to enable dialogue between Metro’s API users and other developers. The informal event proved successful, with numerous developers taking advantage of the resources available to them (provided both by Metro and by their developer peers). Although several topics were discussed, the clear focal point was Metro’s Real-Time Train Position API, released last week through the General Manager’s CARe Initiative.

Metro staff members engaged in various dialogues with third-party developers
At the event, several developers spoke with Metro’s API team to seek guidance regarding the technical backend of their apps and others simply showed Metro their work for feedback and suggestions for implementing new features. One attendee commented on the quality of Metro’s API documentation, crediting the documentation with enabling him to move from building local-apps and scripts to building a full-fledged Metro app using the APIs. Read more…
Starting Wednesday, July 27th, Metrorail customers can see their own, personal on-time score for trips that they’ve taken over the past 90 days by logging into the SmarTrip website.
Metro has a long history of reporting system-wide performance via our quarterly Vital Signs reports. However, our customers often say that this information doesn’t resonate with their own experience because it averages things out across all operating hours and all stations.
Customers: we heard you! MyTripTime reports your own, personal on-time score based on every trip that you’ve taken over the past 90 days.
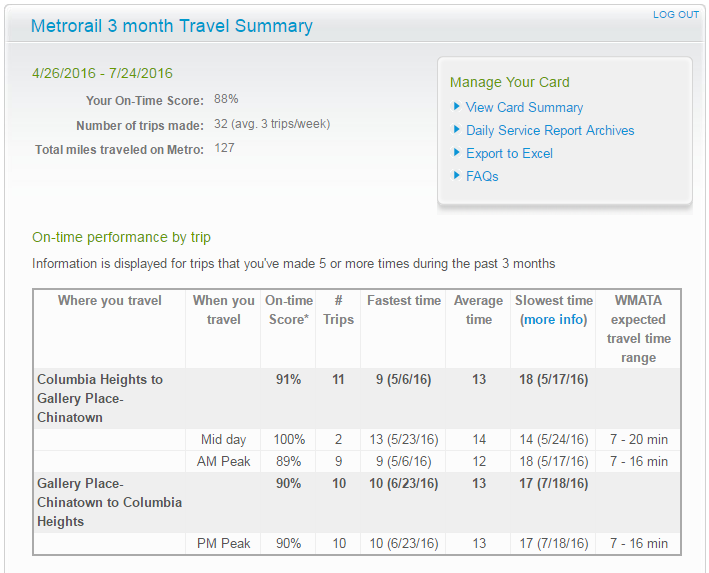
Screenshot of MyTripTime, from smartrip.wmata.com
Read more…
Metro is committed to working with the developer community - we’ve launched a real-time train position API, are hosting developer coffee chats this Wednesday (7/27) from 4pm to 6pm, created a developer google group, and are seeking submissions for an App Gallery!
If you frequently monitor Metro news, you’ll have already seen some of Metro’s latest developments regarding the commitment to open data and third-party developers. Most notably, Metro last week released a real-time train position API, making it possible to identify the specific locations of trains in the system at a given time.
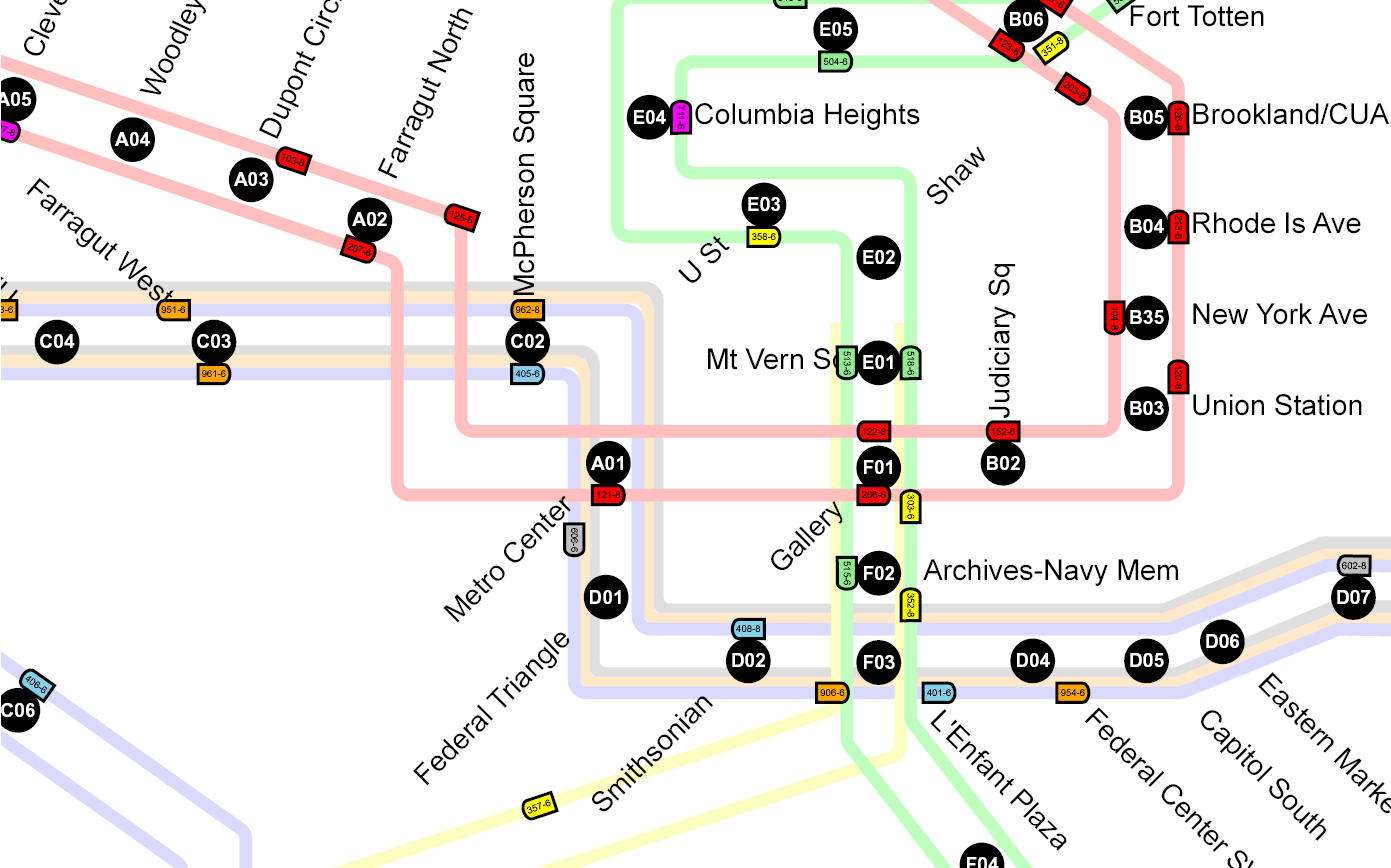
Screen capture of Metro’s internal real-time train positions map. Now, third-party developers can make their own versions of this using a recently released data feed.
We can’t wait to see what you do with the data. But we know you’ll have questions. That’s why we’re hosting an informal “Coffee Chat” this Wednesday, July 27, at Compass Coffee on F Street (near the Gallery Place-Chinatown station and 70/74/D6 buses). Stop by any time from 4pm to 6pm to say hello, show us something on your computer, or ask us questions!
Two other notable updates, Metro now has created a google group to serve as the intra-developer community forum and will be launching an “App Gallery” to showcase apps available for the Metro system.
Population and jobs are up, but regional travel is down - Why? The very nature of trip-making may be changing in this region.
 For several years, we have been reporting internally and externally about declines in Metrorail ridership. Our most recent rail ridership numbers show continued patterns of ridership levels that are five to eight percent below its 2009 peak, and despite gains in March, the trend in April and May suggests that the ridership patterns that we are seeing now are more structural than cyclical. The implication here is that Metrorail may be operating at a “new normal” level that is still poised for growth, but growing from a baseline that has been reset at a lower level.
Theories abound about why this is taking place – telework and rail reliability are among the most talked-about culprits – but it’s almost impossible to isolate one cause among many in a time period that also witnessed fare increases, gas prices drop to historically low levels, and wild variations in the Federal transit benefit.
Now we have new information that may present a compelling theory about the declines in Metrorail ridership – the region is making fewer and fewer trips. Data recently released by our Transportation Planning Board depicts a startling story of this region’s travel patterns over the last decade or so. This data tell us that despite economic factors that would normally portend increased trip-making – rising population, household, and employment growth – this region is actually seeing fewer trips overall, regardless of mode. Read more…
In the DC region, shared mobility (Uber, Lyft, etc.) are actually complementary to the transit network. Here’s why we see opportunities to consider even better system integration.
“Transportation Network Companies” - you know them as Uber, Lyft and a host of other brands - are now part of the urban transportation landscape. Some have suggested that the rise of their popularity contributes to ridership decline on Metrorail and still others have heralded their emergence as the end of transit as we know it. Always focused on investigating trends and proliferating fact rather than folklore, we wanted to know the truth. Should Metro be nervous? Are customized trips like these going to put traditional bus and rail out of business?
Unlikely.
Research (PDF) published by the American Public Transit Association and Transportation Research Board - and which I had the pleasure of helping to oversee - tells us that customers of ridesourcing tend to use the services when transit is less available as well as to get to destinations not easily served by traditional transit. Furthermore, we learned that in the DC region especially, these TNCs tend to function as informal “Metrorail shuttles” - almost two thirds of Uber trips in the District begin or end at a Metrorail station, and slightly more than a third of Uber trips follow that pattern when we zoom out to the entire region. Similar statistics prevail when examining the usage of car sharing companies such as Zipcar and Enterprise. Finally, the data indicates that 57% of frequent users of ridesourcing companies as well as car- and bike-sharing customers identified bus and rail transit as their preferred transportation mode. This tells us that these services have an important role in complementing the Metro rail system for many customers. Read more…
Metro turned 40 this year. Regional leaders are looking to ahead to what Metro could be in the next 40 years.
 On Monday, June 13th, the Metropolitan Washington Council of Governments (COG) and the Greater Washington Board of Trade (BOT) convened a second Metro Summit to discuss opportunities and lessons learned from peer systems across North America. One hundred elected and business officials from across the region gathered at the Mayflower Hotel to discuss funding and governance structures with the leaders of Toronto, Miami, Atlanta, Chicago, and New York’s transit agencies. Additionally, Alex Barron, the Head of Metro Benchmarking, Railway and Transport Strategy Centre, Imperial College London, provided context on what attributes define a world class metro. (pdf)
Audio of the entire proceedings is also available. Information on the first Metro Summit, which was held on March 30, 2016 and discussed funding, safety, development around Metro stations, and governance is also available by audio.
Customers are saying great things about SelectPass, Metro’s new unlimited monthly pass program.
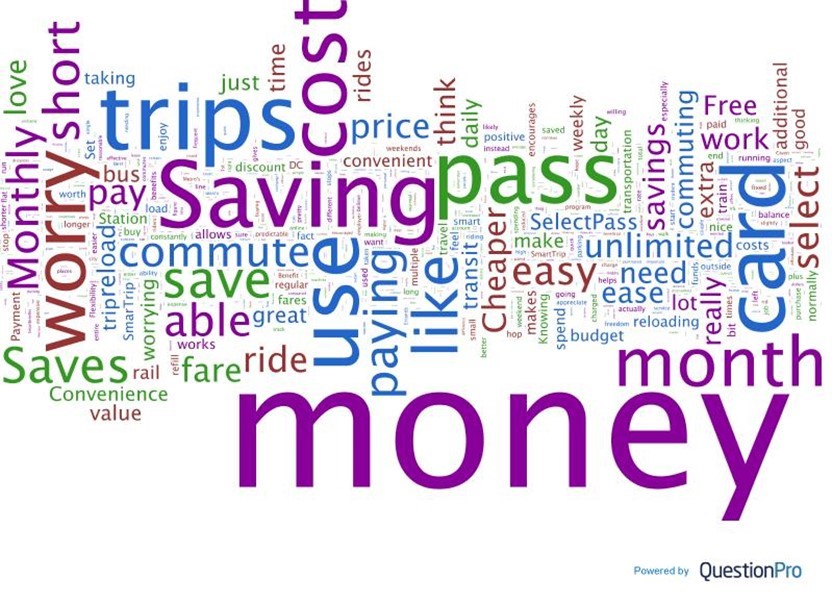
Word Cloud representing what SelectPass customers have said about the new pass program. Click for a larger version.
This post was submitted by Metro’s Director of Customer Research.
Metro’s limited time offer SelectPass has early adopters talking. In April, Metro sought to provide new payment methods by introducing SelectPass—a multi-tiered pass option allowing customers to ride as much as they want on Metrorail (and Metrobus). Currently two price points are available. Read more…
We have developed a customer impact analysis that shows how and where customers may be impacted in the SafeTrack safety surges, to help guide regional partners plan mitigation and alternatives
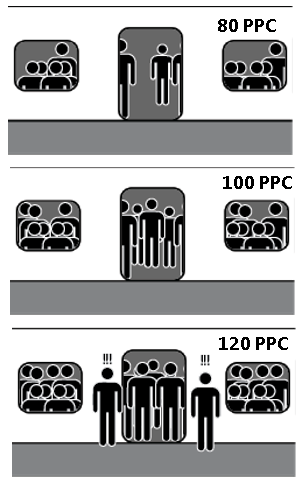 The first SafeTrack project began on June 4, meaning that Monday, June 6th, was the first day with peak-period service disruptions. This first safety surge is to accommodate the track improvement project planned for the Orange and Silver lines between East Falls Church and Ballston. With only one track available for revenue service, we are cutting back to just over 3 trains per hour on each line through the work zone. When service levels decrease without a decrease in demand, we see an increase in passenger loading on rail cars. We measure that with a metric called passengers per car, or PPC.
Our rail cars are designed to comfortably transport around 100 passengers each, with most sitting and a few customers standing. After special events (or any given weekday on some lines) we often find rail cars with much higher passenger loads. From a planning perspective, an average PPC of greater than 120 is considered crowded. Also, we know that customers don’t evenly distribute themselves across rail cars, so an average PPC of 120 means some cars are much more crowded. Read more…


Recent Comments