‘Metro 101’

When Work Evolves – Metrorail in the Era of the Flexible Workplace

December 21st, 2015 10 comments

Between 2007 and 2012, off-peak work trips were the fastest-growing segment of Metrorail ridership.

The traditional “rush hour” remains important, but Metrorail ridership seems to reflect a broader trend regionally – people are making more and more trips during “off peak” hours. According to the 2012 Metrorail survey, rail ridership growth was stronger in its off-peak (8 percent since 2007) than the peak (5 percent over the same time period). In certain jurisdictions – including those that have fostered re-investment in dense, walkable areas – off peak growth was into the double digits while peak growth grew more modestly. In one jurisdiction, off-peak trips grew by 50% during this period while peak trips grew at less than half that clip. 

Compact Jurisdictions Peak Off-Peak
% Change % Change
District of Columbia 8.3% 12.9%
Arlington County 18.4% 9.0%
City of Alexandria 9.5% 12.7%
Montgomery County 0.1% 5.9%
Prince George’s County -7.4% -1.4%
Fairfax County -1.4% 3.0%
City of Falls Church 21.3% 46.9%
Fairfax City 32.8% 19.4%
Compact Total 3.0% 8.0%

Data sources, Metrorail ridership surveys, 2007 and 2012.  2012 is the most recent dataset we have on trip purpose. 

In the past these trips would be for theaters, late night entertainment, or shift work, but the bulk of these off-peak trips were during the midday – almost twice the number of late night trips – and the bulk of these trips were for work. Read more…

Four Key Questions about Metro’s Future with the Federal Worker (5 of 5)

December 9th, 2015 Comments off

The answers to these four questions will shape the future of Metro’s federal customers, and the region’s transportation future. (Fifth and last in a series of posts on Metro’s Federal customers – see posts 1, 2, 3, and 4)

The ATF headquarters adjacent to NoMa Metrorail station has helped grow ridership there significantly.

1. Will the transit benefit be restored to parity with parking? When Congress cut the transit benefit in half, it hurt Metro riders hard. 42% of Metro’s ridership – around 500,000 rail and bus trips per day – comes from riders who use the Federal Transit Benefit, including private-sector workers. At Metro, 22% of all ridership comes from commuters who spend over $130 per month on transit. Following the changes to the SmartBenefits program, Metro saw ridership losses concentrated on these riders hit the hardest, and federal employees overwhelmingly pay with SmartBenefits.

If Congress restores the maximum transit benefit to parity with parking, it would be a huge boon to Metro’s federal customers and Metro’s bottom line. Read more…

Why We Care About GSA’s Location Decisions: Lessons from the History of Metro’s Federal Customers (4 of 5)

December 2nd, 2015 4 comments

Data show that where GSA chooses to locate federal office buildings has a huge impact on Metrorail ridership from federal commuters.  But in the meantime, non-Federal riders in the inner jurisdictions are driving up ridership outside of the usual commute market. (Fourth in a series of posts on Metro’s Federal Customers – see posts 1, 2, and 3)

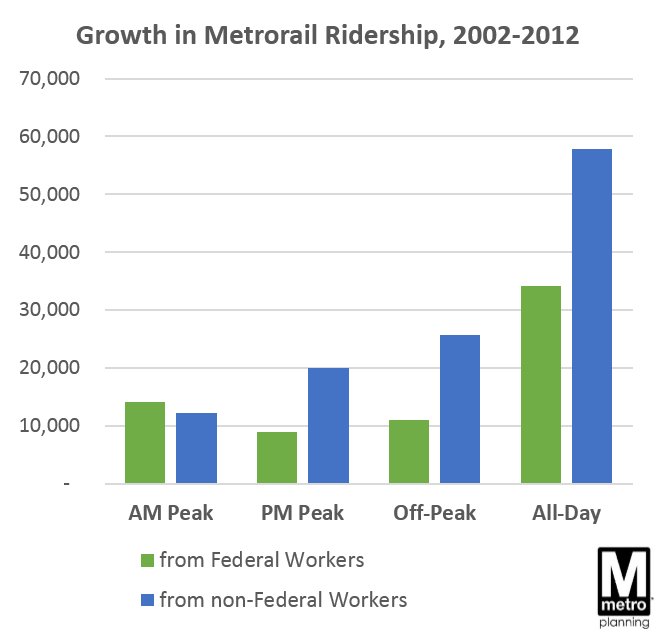
Growth in Metrorail Ridership from Feds by Time of DayBetween 2002 and 2012, rail ridership from federal employees has grown 15%, the same as from non-federal riders.  (N.B. this post focuses on rail only; no comparable survey data for bus is available.)  Federal employees have remained about a third of total ridership, as overall ridership ebbed and flowed. Most of these new federal riders live in the inner jurisdictions of D.C., Arlington, and Alexandria – ridership from federal employees has been much slower in the outer jurisdictions, particularly Fairfax County (growing at 5-15%, vs. 25-40% over ten years).  The growth from federal riders has mimicked existing riders – they are focused on the peak commute too, with a moderate amount of off-peak travel as well.

But over the same timeframe, non-federal customers drove up ridership much faster in the PM Peak and Off-Peak times.  These riders similarly come from the inner jurisdictions. Read more…

Where Are Metro’s Federal Customers Going? (2 of 5)

December 1st, 2015 Comments off

Employees of the federal government comprise 27% of Metro’s weekday ridership, but what rail stations and bus routes are they using?

(Second in a series of posts on Metro’s Federal Customers – see post 1)

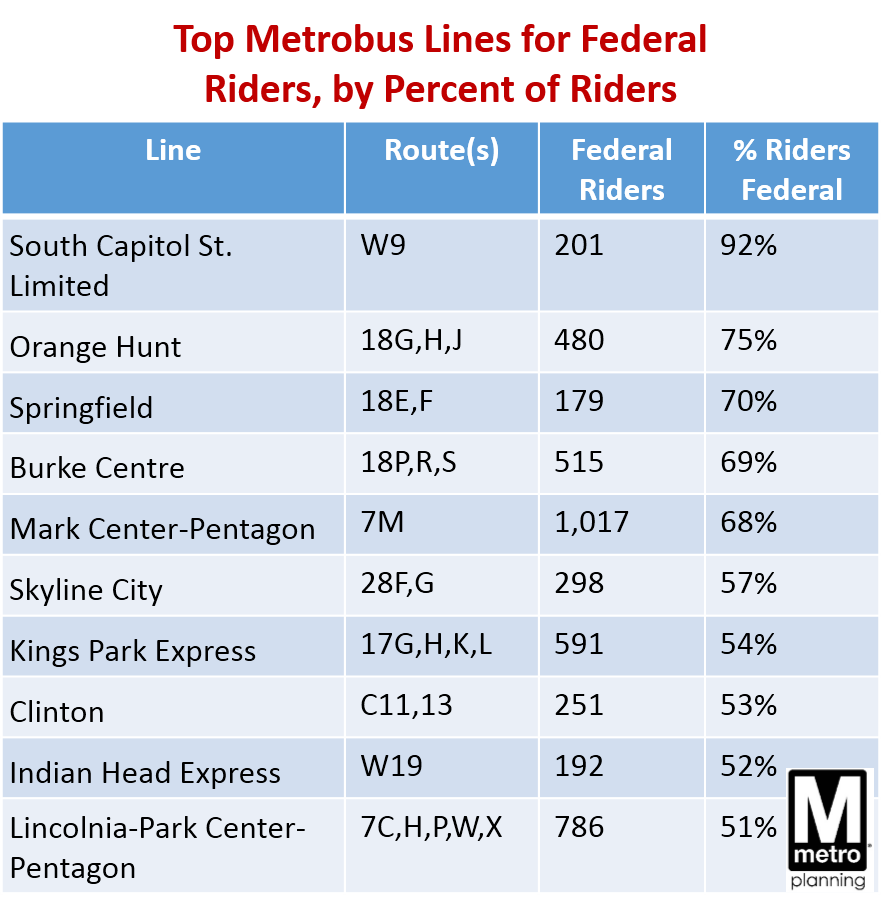
On Metrobus, federal workers are about 10-20% of most bus routes’ ridership, with a few logical exceptions. Federal ridership is higher on bus routes that are more “peaked” and commute-oriented, and/or on routes that directly serve federal facilities.

Top Metrobus Lines for Feds, by Pct of Riders

Read more…

How Metro’s Federal Customers Pay Fares, and Why It Matters (3 of 5)

November 30th, 2015 3 comments

Metro’s federal customers pay fares a little differently than other riders. Why is that such a big deal for Metro’s financial future? 

(Third in a series of posts on Metro’s Federal customers – see posts 1 and 2)

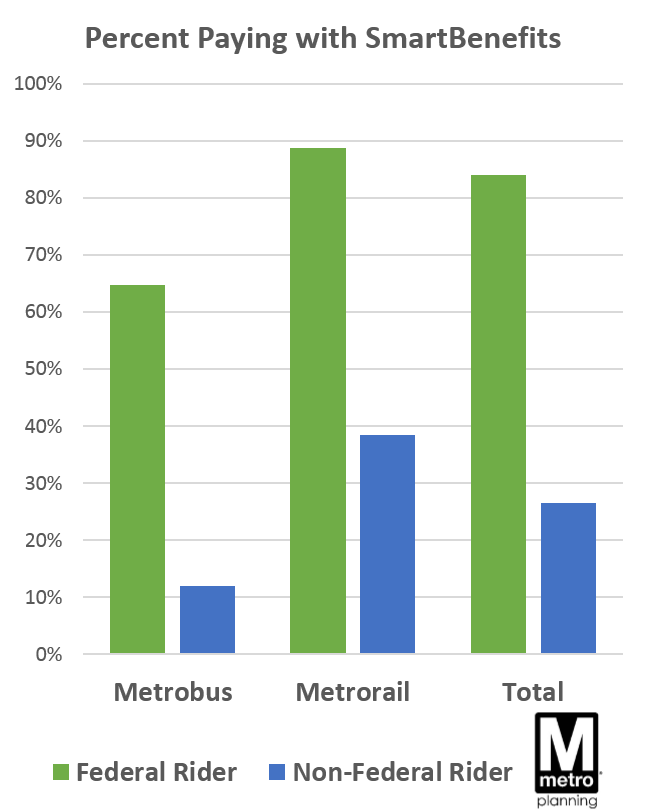
SmartBenefits Feds vs NonCompared to other riders, Metro’s federal customers are much more likely to pay their fare using SmartBenefits.  SmartBenefits are the type of funds you load onto your SmarTrip card – usually through your employer, either as direct subsidy, or a certain amount of pre-tax dollars you set aside for transit fares. Metro riders in the Washington region may know the program manager WageWorks.

 (Importantly, SmartBenefits is not exclusively a federal government benefit!  On the contrary, non-federal workers are nearly half the overall enrollment in the SmartBenefits program, and 42% of Metro’s overall ridership comes from riders paying with SmartBenefits.  We’ll make clear the difference between SmartBenefits and SmartTrip in an upcoming Metro 101 post – stay tuned.)

84% of federal employees on Metro pay their fare with SmartBenefits, compared to 27% of non-federal customers. In addition, federal customers tend to pay higher fares on rail – because federal workers typically take longer trips and ride more at peak times (average peak fare $3.00, vs. $2.87 non-federal customers).

Finally, 87% of Metro’s federal customers pay using “stored value” (pay-as-you-go funds), rather than a weekly or a monthly pass. Very few still use paper tickets or passes – but this is similar to other riders.

Read more…

Metro’s Federal Customers: A Snapshot (1 of 5)

November 19th, 2015 Comments off

Think Metro is all about getting the federal commuters to work? Think again!

(First in a series of posts on Metro’s customers who are Federal Government employees)

Just as the workforce in the Washington region has a sizeable share of federal workers, so has Metro’s ridership.  Metro serves major federal employment centers downtown, and even boasts stations named for the federal sites they serve, like Federal Triangle, Medical Center, and Pentagon. But while Metro has a long supported the federal government, it’s a myth that Metro is all about federal government commuters and nothing more. Federal workers are a minority of riders and have been for years, and federal funding is playing an increasingly smaller role in Metro’s finances.

So just who are Metro’s federal customers?  When and what do they ride? Where are they coming from and going to, and how has this changed in the last decade? The next series of posts seeks to answer just that, using passenger survey data (bus and rail) where customers identified as employees of the federal government or not (contractors excluded).

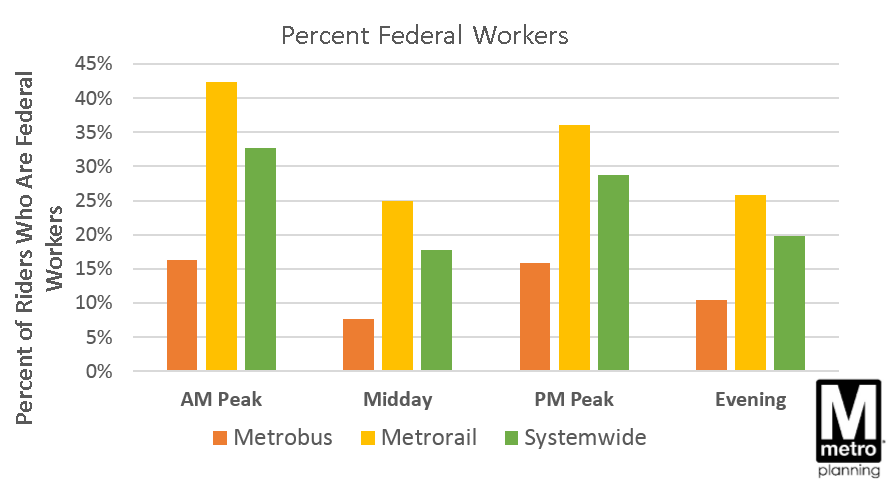
How Many, Where, and When? About 27% of all Metro weekday trips are made by federal workers – a total of 317,000 boardings across bus and rail.  These federal employees can be anyone from a nurse at Walter Reed Medical Center, to a military officer at the Pentagon, to a Congressional staffer on Capitol Hill.  The majority of these trips (255,000) are made on Metrorail, where federal workers make up 35% of all boardings (all-day).  The remainder – just over 60,000 boardings from federal workers – happen on Metrobus, where riders are generally less likely to be federal workers (14% of all bus boardings are federal).

Pct Fed Workers by Mode and Period Read more…

Transit-Oriented Development’s Return on Investment

November 16th, 2015 Comments off

For at least the past decade, the region’s real estate has revolved around transit.  That is expected to continue for the next decade, and we can already see signs of its impact along the Silver Line, according to a new report.

We’ve been highlighting the impact that Metro has on the regional economy for many years now.  From the Regional Benefits of Transit study which highlighted the quarter of a billion dollars in incremental tax revenue that the jurisdictions enjoy each year solely because of Metro, to recent data which highlights that almost all of the development pipeline in the D.C. region is within walking distance of Metrorail, it’s crystal clear that this region’s economic future is inextricably linked to Metro.

Joining the library of compelling evidence of this is recent information from CoStar and Transwestern.  They have been monitoring the development pipeline and activity in the region and have had a special eye trained on the Silver Line.  Here’s what they found: Read more…

The (Hidden) High Cost of Cheap Real Estate

September 24th, 2015 6 comments

As jurisdictions balance the need to redevelop “prime” Metrobus garage sites, new facilities are located in less desirable and cheaper real estate submarkets.  That may sound like great business sense, but it has an impact on non-revenue (or “deadhead”) mileage, creating scheduling challenges and adding millions of dollars in additional operating costs to operate Metrobus service. This trend will increase into the future.

Today, Metro dispatches 1,634 buses for 315 bus routes from only nine bus garages spread throughout Virginia, the District, and Maryland. In a perfect world, Metrobuses would magically appear at the start of a bus route and no additional costs would be incurred. In reality, many bus routes begin far from their assigned bus garages, and travel long distances before they can begin service.

Excluding our two youngest bus divisions (both replacement divisions built in the last five years), the median age of our bus divisions is 61.5 years. These facilities need more than just tender loving care to keep up with today’s service demands.  For example, older garages are not equipped to deal with modern buses (the 70-year-old Royal Street bus division was literally too short for modern buses). And only two garages, Four Mile Run in south Arlington and Bladensburg in northeast DC, are equipped to handle Metro’s 457 compressed natural gas (CNG) buses.  So often times Metrobus needs new facilities despite the tantalizing prospect of simply refurbishing old ones.  These new facilities fall under the category of “LULU” – Locally Unwanted Land Use.  Many do not want to live near a bus division, but if the region wants bus service, we need bus garages.

So, bus divisions get pushed out farther and farther from central locations and the neighborhoods where the customers are.  All sounds logical so far, except for the fact that the buses now need to travel further to start revenue service.  All of this extra journey time simply to get from the division to the customer adds extra deadhead miles to each route. That deadhead is now starting to cost big bucks.
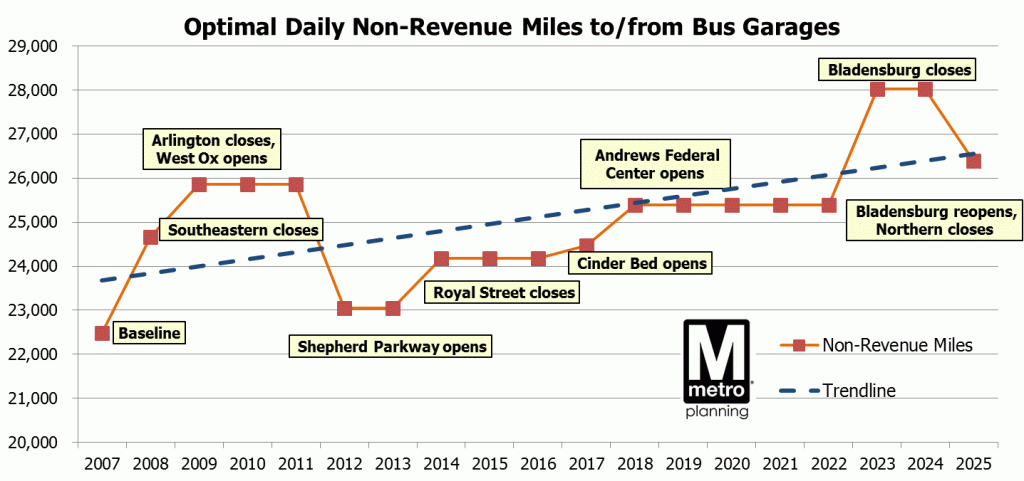
Since 2007, increased deadhead miles have added $5 million to the cost to operate Metrobus.

Since 2007, increased deadhead miles have added $5 million to the cost to operate Metrobus.

Since 2007, Metrobus’ total operating costs have increased $5 million to cover an increase of 1,700 daily deadhead miles. Closures of bus divisions have had a large impact on operations, steadily increasing daily deadhead miles from the 22,500 mile baseline. The 2008 closure of Southeastern Bus Division (now the Half Street Fairgrounds) as part of the Navy Yard/Nats Park redevelopment caused daily deadhead miles to jump nearly 2,200 miles. Most of the remaining DC garages and Southern were forced over their normal capacity limits, and some service was shifted to Montgomery Division. A year later, the World War II-era Arlington bus division closed and capacity was shifted to the new West Ox Division in Fairfax County. Shepherd Parkway Division opened in 2012, 4 years after its predecessor Southeastern closed, bringing overall deadhead miles about 600 miles shy of the 2007 baseline. Two years later, the Royal Street bus division in Alexandria closed, increasing miles once again.

Metro had intended to hold off closing the Royal Street bus division until after the opening of Cinder Bed Road. The project was substantially delayed to accommodate neighborhood concerns, and we were unable to mitigate the 1,127 mile increase in deadhead during the protracted delay.

The animated graphic below shows the change in deadheading between 2007 and current.  Read more…

Two Business Challenges Facing Metrobus

September 2nd, 2015 5 comments

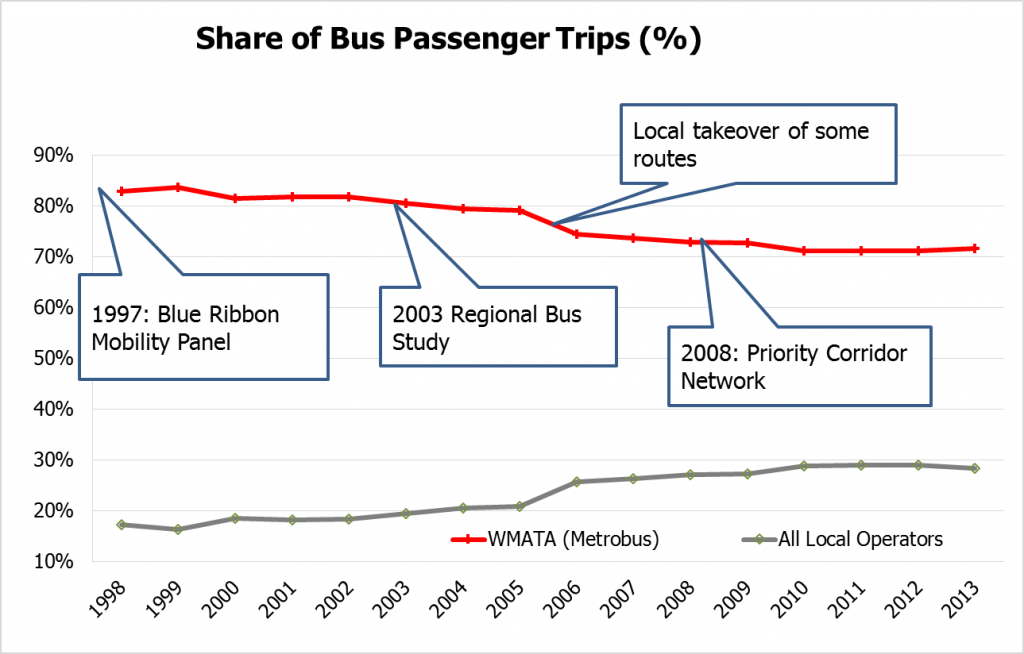
In the past 17 years, Metrobus has faced dual challenges: increased competition and increased roadway congestion.

Market Share Decline 1998-2013 v2

A past post discussed the role of the 1997 Blue Ribbon Mobility Panel in resetting the regional role and funding structure for Metrobus. In the decade-plus since then, several trends have emerged:  Local operators are rolling out more and more bus service, and buses are getting slower.

Read more…

Preparing for the Future of Metrobus

August 17th, 2015 2 comments

Since the signing of the WMATA compact more than 40 years ago, there has been an ongoing debate about the role of Metrobus as the Washington region’s primary bus service provider. 

Prior to the formation of Metrobus in 1973, bus services in the Washington region were operated by numerous private providers across the region operating on dedicated lanes, many of which were operating at a loss.  In the 1970s, Metro consolidated bus service under the Metrobus brand and increased service and headways throughout the WMATA compact area.  While Metro’s role as the regional rail provider has always been clear, its role as a bus provider has been more nuanced.

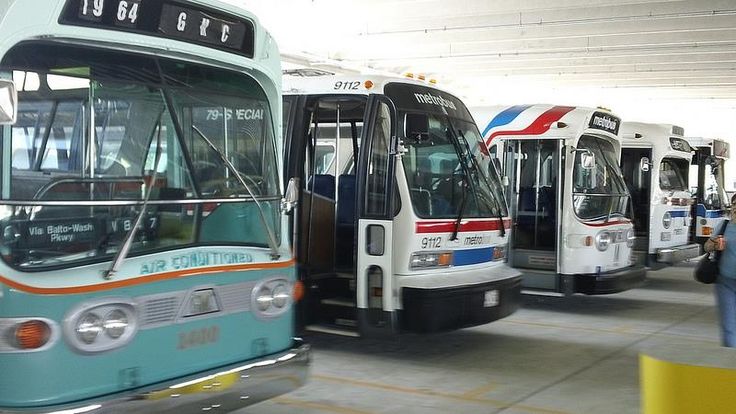
Old DC Transit and Metrobuses from the 1960s and 70s

This is the first in a series of posts which aim to provide a brief overview of the efforts undertaken over the past 20 years by Metro, and its regional partners,  to balance the responsibilities and funding of Metrobus with the wants and needs of our jurisdictional partners all while maintaining our regionally focused mission.

Read more…