Metrobus Market Effectiveness Study Under Way

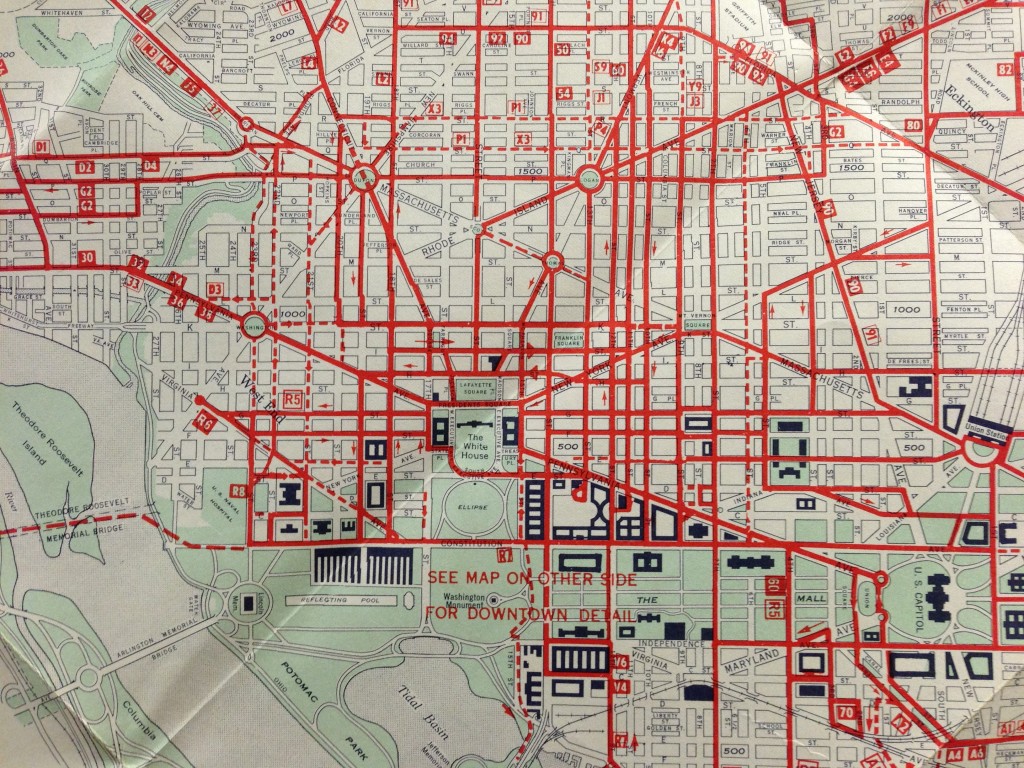
Photo of a 1969 1968 map of DC Transit System Inc routes. Many routes listed here are still running today.
WMATA bus began operations in 1973, when it consolidated the four Washington-region bus operators under one system and brand. As many commented in MindMixer, many of these lines were originally streetcar lines established in the late 19th century and majority of services were based in the inner areas.
The inclusion of old streetcar lines in the current Metrobus network informs a rich history about natural progression of transit network and the interaction between urban development and transit investment. The century-old streetcar investment helped develop those areas and transform them into transit-friendly markets. In return, these areas and corridors are among the most transit supportive markets today, generating high bus ridership.
Over the past 30 years, strong growth in jobs, population and urban development in the DC region continued to demand the expansion of bus transit service from the central core to suburbs, from traditional activity centers and corridors to the new or emerging local centers and corridors, some of which are near or beyond the edge of Metrobus market. Metro currently operates nearly 300 revenue bus routes organized into approximately 150 lines throughout the jurisdictions in the Metro compact area.
To better understand how the current Metrobus system serves travel needs in the DC region, Metro’s planners are conducting the Metrobus Market Effectiveness Study to identify market constraints and opportunities for Metrobus, and most importantly, strategically position Metrobus toward building an effective network that can better serve current and future demand, enhance productivity and efficiency, and improve integration between Metrobus and local services.


Where is the plan that Ygelisias blogged about 1/24? I saw plans for walkways between Farragut West and North, something that’s been needed for 40 years. Great if overdue!
This map has to be older than 1969; the Inner Loop Freeway and the E Street Expressway significantly altered the street grid depicted, and both were completed earlier in that decade.
I just checked the hardcopy hanging in my office: copyright 1966, last updated January 1968. I must have erred somehow with the 1969 date but perhaps they didn’t update the base street map after 1966?
Is this study going to ask the question of whether the route network/service pattern of the current bus network generates the biggest bang for the $600 million budget / $450 million subsidy? i.e., are you going to posit other types of networks that would also consume $450 million in subsidy per year and compare their performance to the current network?
For example, will you be able to show the region another, distinctly different bus network with a service plan that costs $450 million in subsidy per year, and reach a conclusion like: “A gridded network with fewer routes/lines overall and more frequent service per route/line would carry 10% more travelers per day with the same subsidy, but the average rider would have to walk two more blocks to get to their route/line and some parts of the City would lose easy transit access.”
If you can set things up that way, you really can frame a choice that the Board of Directors/Region can think about and decide on, and set a strategic direction.