
Growth Mode or Stuck in Neutral? Or Both?
Population and jobs are up, but regional travel is down – Why? The very nature of trip-making may be changing in this region.
 For several years, we have been reporting internally and externally about declines in Metrorail ridership. Our most recent rail ridership numbers show continued patterns of ridership levels that are five to eight percent below its 2009 peak, and despite gains in March, the trend in April and May suggests that the ridership patterns that we are seeing now are more structural than cyclical. The implication here is that Metrorail may be operating at a “new normal” level that is still poised for growth, but growing from a baseline that has been reset at a lower level.
Theories abound about why this is taking place – telework and rail reliability are among the most talked-about culprits – but it’s almost impossible to isolate one cause among many in a time period that also witnessed fare increases, gas prices drop to historically low levels, and wild variations in the Federal transit benefit.
Now we have new information that may present a compelling theory about the declines in Metrorail ridership – the region is making fewer and fewer trips. Data recently released by our Transportation Planning Board depicts a startling story of this region’s travel patterns over the last decade or so. This data tell us that despite economic factors that would normally portend increased trip-making – rising population, household, and employment growth – this region is actually seeing fewer trips overall, regardless of mode.
Consider, for example:
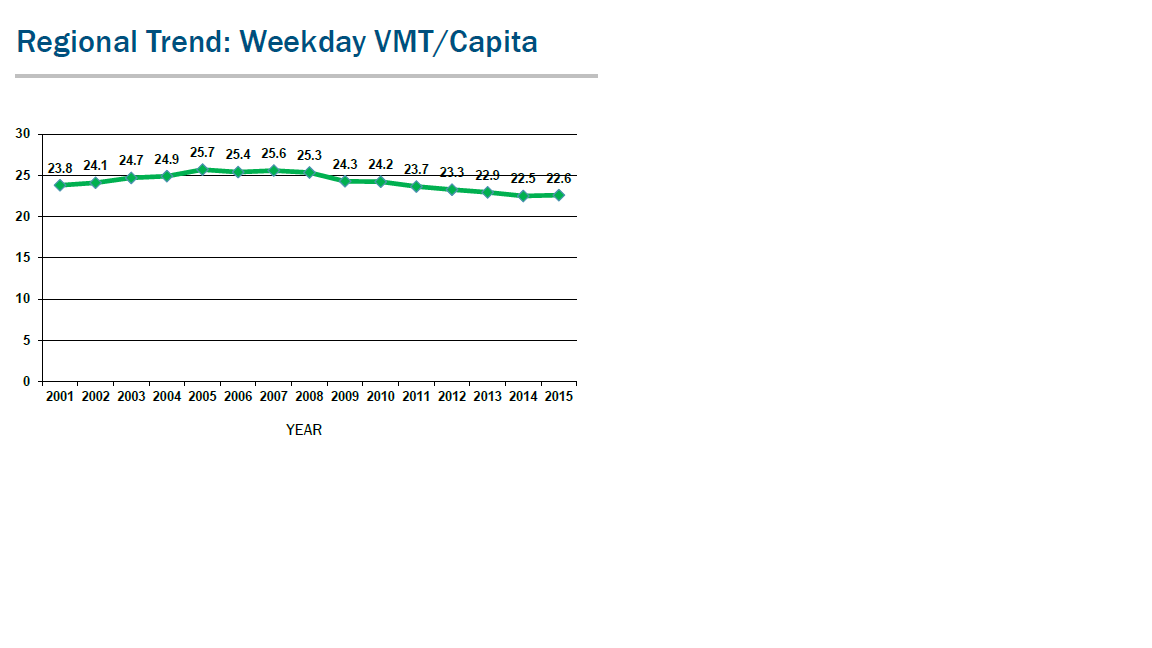
- Weekday vehicle-miles travelled (VMT), an indicator of how much driving goes on in the region, was relatively flat between 2009 and 2014, and 2014 was actually down from a peak in 2010. The 2015 preliminary numbers show a modest gain from 2009 of 2.9%, but less than a 1% gain from the 2010 peak.
- Because population growth was strong in the region – we added 520,000 people between 2009 and 2015 – per capita VMT is down almost 10% during that timeframe.
- Traffic coming from beyond the DC region is flat or down over this time period, meaning that we are seeing fewer “super commuters” or regional tourists entering the DC region on a daily basis than we did back in the mid-2000s, despite regional employment growth.
- Regional transit providers (regional buses, MARC, VRE) are all flat or down not just recently, but since 2012).
 Within the report, two potential causes continue to be potentially relevant – telecommuting and the regional economic picture.
- In 2013, 27% of regional employees indicated that they participated in telecommuting, up from 19% in 2007.
- Meanwhile, and perhaps critically importantly, Federal procurement spending nose-dived in the region. Totals for Federal procurement spending are 8.6% below their 2010 levels and are poised for continued declines.

It is worth considering at this point the possibility that the very nature of trip-making is changing in this region. More households, more jobs, and trip-making is flat or perhaps down – regardless of mode. We’ll monitor these trends going forward as data emerge.

Interesting data. The next question would be how does the national capital region compare with other large urban areas where transit ridership is stronger? Has VMT growth in other metro areas stalled out?
@Mr. Transit
I don’t have that data handy, but I would suggest that the national capital region has been much more directly impacted by sequestration and the dropoff in contracting dollars than other major metropolitan areas.
Note also that there is a fascinating piece on NPR today about the rise in contingent employment (1099 workers) nationwide, going from 31% to 40% of the national working labor force. These employees don’t have fixed locations, and are not often counted in at-place employment counts. These employees are the ones least likely to make a regular set of home-based work trips with consistent O-D pairs.