‘Engage’

Off-Peak Fare Discounts and their Behavioral Implications

June 8th, 2016 4 comments

Metrorail riders facing a high percentage off-peak discount are motivated to delay their travel and save.

This post is guest-written by Sam Winward, a behavioral economist and Metrorail commuter who lives and works in the District. His analysis of Metro ridership patterns sheds light on the influence of off-peak pricing.

If you’ve ever waited a few extra minutes before swiping through a Metrorail faregate to qualify for the off-peak fare, you’re not alone. Within the afternoon peak / off-peak cusp period, when riders may be somewhat time flexible, Metrorail data from AprilMay 2015 confirms that some riders are delaying entry for savings.

What riders probably don’t know, is that their off-peak pricing discount could be substantially different from the riders around them. In fact, off-peak percent discounts can range from a 19% to 40% reduction of peak fares. Given the varying degree of off-peak incentive, riders are responding as we’d expect when weighing their opportunity cost of time.

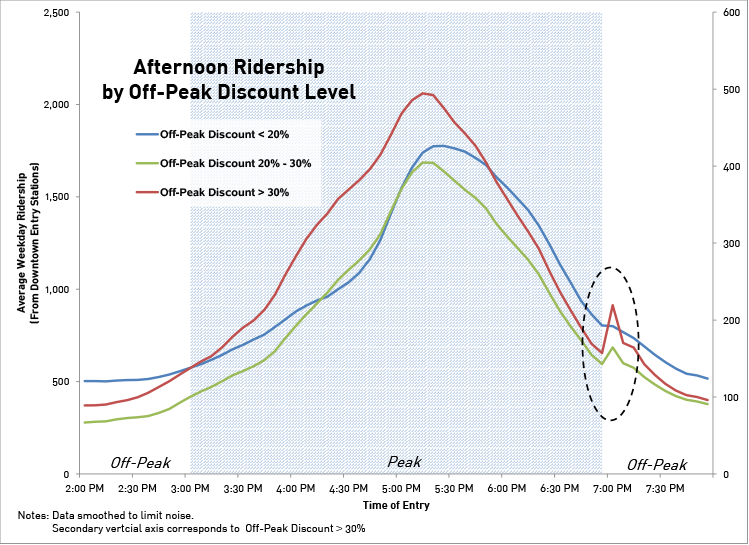
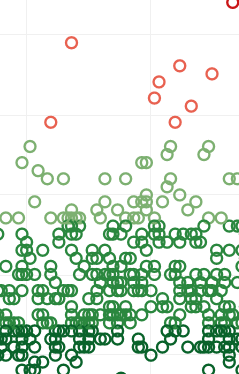
As percent savings increase, riders are more likely to delay travel for off-peak fares. The graph below, derived from WMATA data, displays this ridership tendency.

Note the ridership uptick just after 7 pm. This runs counter to the natural pattern of declining ridership over this period, and the uptick steepens as the percent discount facing riders increases.

Exhibit 1_Ridership Uptick

So why is there so much variation in off-peak discounts, and who are the lucky riders allowed large savings?

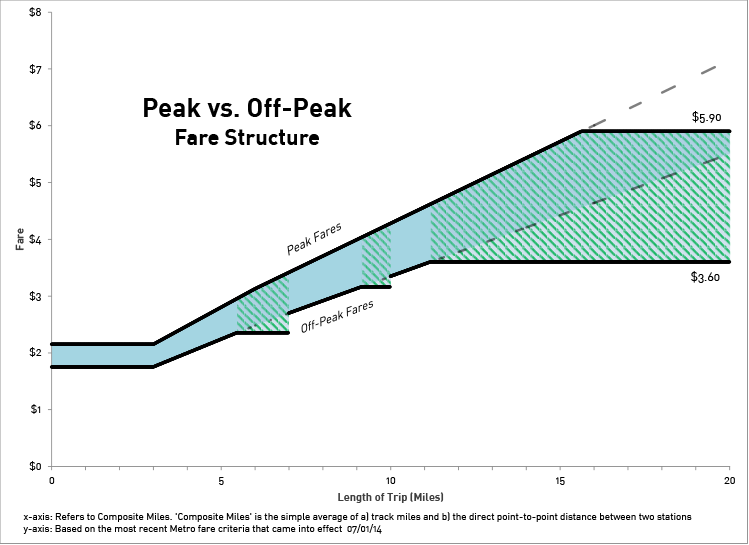
Particular trips, based on mileage between origin / destination stations, are subject to off-peak fare “caps.” WMATA introduced the caps in 2012 when off-peak fares switched to incremental fee-per-mile pricing. Off-peak fares for trips of just under 7 and 10 miles were capped, as these trip distances would have otherwise seen very large increases between the old and new fare structure. A maximum off-peak fare cap of $3.60 was also implemented, affecting riders with trips lengths greater than 11 miles.

The effects of these fare caps remain in the system today, and are not mirrored in peak fares.

As displayed below, the gap between peak and off-peak fares increases over regions subject to off-peak fare caps. This makes off-peak travel more enticing for riders’ whose trip length falls within a green zone.

Exhibit 2_Fares

Notably, small tweaks in the fare structure have large behavioral effects.

Even if you decide that added off-peak savings aren’t worth the wait, at least your decision can be informed. To see the off-peak discount applicable to your route, and how it compares to the rest, check out the interactive off-peak discount calculator on my website.

The full story, including the off-peak discount calculator and a formal analysis of the delayed ridership patterns, can be found at Sam’s site.

WMATA Begins a New Capital Needs Inventory

June 6th, 2016 1 comment

Restoring Metro’s reliability and quality requires a comprehensive approach to asset management and reinvestment.

dupont_escalator_replacement

Capital needs include escalator replacement, as pictured here.

In April, Metro staff commenced the important work of updating its Capital Needs Inventory (CNI), a financially unconstrained prioritized plan of capital needs that documents Metro’s infrastructure, vehicle, facility, technology, and system capacity investment needs over an immediate to 10-year horizon, and provides input to the development of the six-year Capital Improvement Plan (CIP).  This document, which itemizes and prioritizes the capital investment needs of the entire Authority over a ten-year period, not only informs our jurisdictional partners about funding needs, but is now also a component of the federally required Transit Asset Management Plans outlined in MAP-21.  Importantly, Metro’s CNI effort is occurring at a critical time both for the Authority and within the transit industry. Concurrent with recent asset-related failures on Metro’s rail system, international standards for asset management (ISO 55000) and Federal Transit Administration (FTA) proposed rules have recently been published that can help guide the methodology and tools used to develop a best-in-class CNI.

Have we done this before?

Awareness of the need to focus on the maintenance and renewal of Metro’s capital assets has existed since the system opened, but a comprehensive approach to long-term planning for the funding and management of capital assets has been lacking for much of Metro’s history. In the early years of Metrorail operations, the focus of funding campaigns was on construction of the full system. Toward the late 1990s, as the 103-mile rail system neared completion, efforts began to quantify capital improvement needs and to increase the size of the capital improvement program budget. Some key milestones during that period included: Read more…

Categories: Engage Tags: , , , ,

Rail Ridership Data to Help the Region Plan for SafeTrack

May 27th, 2016 3 comments

To help the region and our partners plan alternatives and mitigate the impacts of SafeTrack, Metro releases rail ridership data applicable to this important maintenance effort.

SafeTrack example 2Rail Link Volumes: This data describes the number of customers on board trains between two contiguous stations, for a given hour of the day, then assigned to rail links.  For example, the link volume from Bethesda to Friendship Heights is the sum of everyone who boarded upstream, minus those who exited at or before Bethesda. This can be useful for planning SafeTrack mitigation efforts because it gives a first-order estimate of the potential demand for a bus bridge, for example.

Online Interactive Map of Metrorail Link Volumes, average weekday and Saturday in May 2015

Metrorail Link volumes, average weekday in May 2015, by hour, by line color (580kb, .xlsx)

Read more…

Metrobus Ridership During the Rail Safety Shutdown

May 23rd, 2016 2 comments

When Metrorail closed on March 16th, tens of thousands of rail riders switched to bus, including almost 20,000 riders who took their first bus ride in over a month! Bus-to-bus transfers spiked 45%, and ridership surged in downtown and central areas but fell in the suburbs.

Ballston Bus

Special thanks to the Systems & Performance Analysis team in Bus Planning for their help developing this analysis.

When Metrorail closed on Wednesday, March 16, Metrobus braced for impact as over 700,000 displaced rail trips sought alternatives. But there was little time or capacity to significantly alter bus service. What happened to bus ridership?

Overall ridership as tallied by the farebox came in at just 5% over the monthly average, or about 20,000 additional trips. So the changes look fairly small given the volume of displaced rail trips.

But don’t be fooled by the bottom line.  Underneath that total, a seismic shift was taking place. Read more…

Designing the SelectPass Test Phase

May 4th, 2016 9 comments

The new Metro SelectPass is structured to to maximize pilot participation while minimizing the risks.  Making that happen involves overcommitting to truth in advertising – and we’re fine with that!

The two most likely fare levels for the SelectPass are $2.25 and $3.75.

The two fare levels most likely to be popular for the SelectPass are $2.25 and $3.75.

We are excited about the launch of the new SelectPass pilot.  As we have begun to roll out this new pass product, we are listening to your questions (via twitter, comments posted to articles, etc.) and we hope to address as many of them through the proper venues.  PlanItMetro seems to be the best forum to answer the persistent question, “Is this really only for two fare levels, and why don’t you tell everyone that they can probably save money?”

Testing the capacity of the Fare System

When we roll out new features, we want to eliminate as many risks as possible before committing to them.  In this case, the primary risk Metro faces is that our aging fare technology might not be able to accommodate a very different fare product such as SelectPass.  So we developed a program to test the pass at two individual “levels” as a proof of concept and not push any limits of our fare collection technology. Read more…

Categories: Engage Tags: , , , , ,

Reserving Bus-Only Lanes for Buses Only

April 20th, 2016 5 comments

Metro kicks off an evaluation of bus-only lane enforcement strategies.

BusLawDiagram

Montgomery County uses bus cameras to enforce safe driving rules around school buses.

As the state and local departments of transportation begin to consider bus priority treatments (PDF) in earnest, their success will be dependent on the development and implementation of a comprehensive driver education and lane enforcement strategy prior to the bus lane installation.

New bus-only lanes are currently being implemented or are planned in many of our compact jurisdictions: Corridors currently under study include Georgia Avenue NW in DC, Rockville Pike in Montgomery County and Leesburg Pike in Northern Virginia.  As BRT becomes a more popular and effective mode for cities seeking high-quality, higher-speed transit at a relatively low cost, there is an increasing interest in identifying strategies to successfully enforce vehicle restrictions in bus-only lanes. Read more…

Categories: Engage Tags: ,

2016 Travel Trends Rail Passenger Survey is Underway

April 19th, 2016 No comments

Metrorail riders get excited; the 2016 Travel Trends Rail Passenger Survey is here! If you haven’t noticed all the orange in the stations yet (surveyors in orange Metro bibs handing out orange surveys, offering orange Travel Trends pens to fill them out), keep an eye out! Throughout April and May of 2016, WMATA (Metro) will be conducting the Travel Trends survey on a rolling basis throughout the system, to cover all 91 stations.

The Rail Passenger Survey is an FTA-mandated survey that Metro is required to administer every five years, or at least two years after the launch of new rail service (this year’s survey comes two years after the launch of the Silver Line). The primary use of the survey is to:

  1. Determine jurisdictional transit subsidy allocations.
  2. Improve our service and validate our internal systems.

Here is a video that summarizes the work being conducted and why it’s important:

Your answers to the survey contribute to the data used to support operating and planning activities—it provides us with greater insight into how we can best match service to fit the overall needs of our customers using the system.

Here is a sample of some of the questions we ask in the survey, and what your answers to those questions will be used for: Read more…

Categories: Engage Tags: , , ,

Data Download: Metrorail Ridership by Station by Month, 2010-2015

March 24th, 2016 6 comments

Data_clipSee how seasons, land use, and service drive trends in rail ridership at the station level, in this new data download.

This latest data download shows Metrorail ridership by station, by month, for the last five years or so. It hints at the complex factors driving rail ridership – from short-term effects like weather or service changes, to long-term trends like real estate development and office relocations.

We see a few tidbits in this data:

  • Seasonal trends: rail ridership follows a predictable pattern each year – peaking in the summer and around Cherry Blossoms, and reaching lows around the holidays.  Compare the high seasonality of Arlington Cemetery to a more commuter-oriented station, for example.  Ridership in the summer at that station can quintuple over its winter base.
  • Weather impacts: see how the blizzard this past January lowered the average for the month as service was shut down.
  • Service changes: See how the opening of the Silver Line shifted riders from Orange to Silver in July-August 2014.
  • Land Use is key! Look at the recent growth rates at stations like Navy Yard and NoMa (formerly New York Ave.), reflecting the new jobs and residences near those stations.

Metrorail Ridership, by Station by Month, 2010-2015, Average Weekday (.xlsx, 120kb)

Metrorail Ridership, by Station by Month by Period, 2010-2015, Average Weekday (.xlsx, 630kb) (Added 3/30/2016)

Notes: these numbers are raw entries for an average weekday in the month, including snow days, excluding holidays when we did not run a weekday schedule.  The numbers are for trend analysis and will differ slightly from those we report in financial statements, which undergo additional data scrubbing and normalization.

What do trends you see?

Metrorail Ridership Data Download, October 2015

March 14th, 2016 10 comments

New data download features rail ridership by origin, destination, day of week, and quarter-hour intervals.

ridership_plots_subset

Subset of the visualization made by BioNrd aka Mike from our October 2014 data download data.

As you’ve probably noticed, it’s been a while since we’ve released a fresh batch of Metrorail ridership data.  Continuing the spirit of openness, we have recently uploaded data from October 2015 in CSV format.  (The number of rows is too great for Microsoft Excel).

This new dataset includes day of week data, so you can begin to investigate impacts of evolving workplace policies such as compressed work schedules.  You can also compare it to October 2014.

In the past, we have seen a lot of innovative analyses of the data we share.  Perhaps the best so far was a visualization of Metrorail station entries and exits by station by “BioNrd” aka “Mike.” What else can we learn from this dataset?


Improving Bicycle Access to Vienna Metrorail Station – Come one, Come all!

February 29th, 2016 Comments off

Next Wednesday, March 2,  join Fairfax County’s bike program for a kick-off meeting about its Vienna Metrorail Bicycle Access Study.  This is your opportunity to make it even easier to get to the station on a bike.

On March 2nd, from 6:00-8:00 pm, in the Oakton High School cafeteria, Fairfax bike planners will will introduce the public to this planning project and gather feedback on existing conditions, concerns, and ideas to improve bicycling in the area.  The study will look at ways to improve bicycle access to the Vienna Metrorail Station on Nutley Street, Virginia Center Boulevard, Country Creek Road, and Sutton Road.  The meeting includes a presentation and a breakout session to gather feedback on areas of concern, ideas for improvements, and overall goals for bicycling in this area.  We hope you can attend and help make our station more bike-friendly.  viennametrostudymap-thumb2

The project is funded through the Metropolitan Washington Council of Governments’ (MWCOG) 2016 Transportation and Land Use Connection (TLC) Grant Program.  Hopefully, we will see more projects coming through the TLC program since it is through studies like these that the region can advance the projects identified in Metro’s Station Area Strategic Investment plan and make progress toward achieving Metro’s strategic goal to connect communities and move us closer to the bicycle access goals our Board established in 2011.

Categories: Engage Tags: , , ,