
Study Recommends New Mezzanine to Connect Red/Purple at Silver Spring
To handle future ridership demand, Silver Spring may need a new mezzanine to connect Metrorail to the planned Purple Line light rail station.
Last year, we began a study looking at potential station capacity issues at Silver Spring. The assessment determined that the demand at the Silver Spring Metrorail station (entries and exits) is adequately served by the existing station infrastructure. Since then, the study has assessed the future conditions that will be impacted both by ridership growth due to growth of jobs and households in the station area, but also the arrival of the Purple Line light rail to Silver Spring.
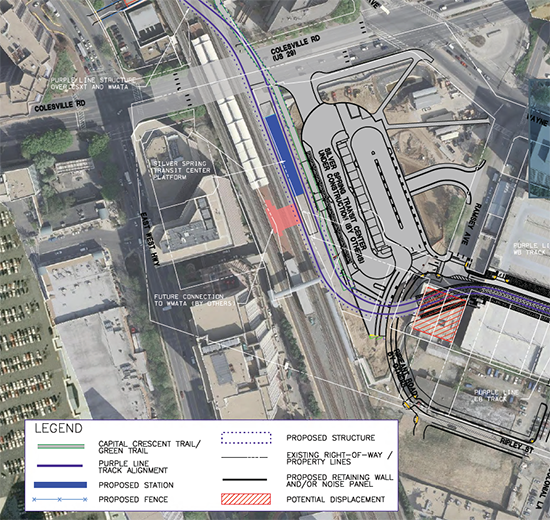
Purple Line station and potential Metrorail connection at Silver Spring. Source, purplelinemd.com, PDF.
The Purple Line station at Silver Spring is planned as an elevated platform and mezzanine, with the mezzanine connecting to the top floor of Silver Spring Transit Center, Metropolitan Branch Trail, and Ripley Street to the south. The elevated light rail platform will be approximately 80 feet above the street, about the height of the current MARC pedestrian bridge. The MTA design team envisioned a possible direct connection between Metrorail and the Purple Line, as illustrated in the red shape in the center of the above image. Without such a connection, riders transferring between Metrorail and the Purple Line at Silver Spring would have to descend those 80 feet to the ground level, enter an existing Metrorail mezzanine, and then ascend again to the Red Line platform. Read more…


Recent Comments