Posts Tagged ‘rail’

What Will Happen to the Buses with the Silver Line?

March 18th, 2013 17 comments

Some bus routes will change when the Silver Line arrives late this year.

Some bus routes will change when the Silver Line arrives late this year.

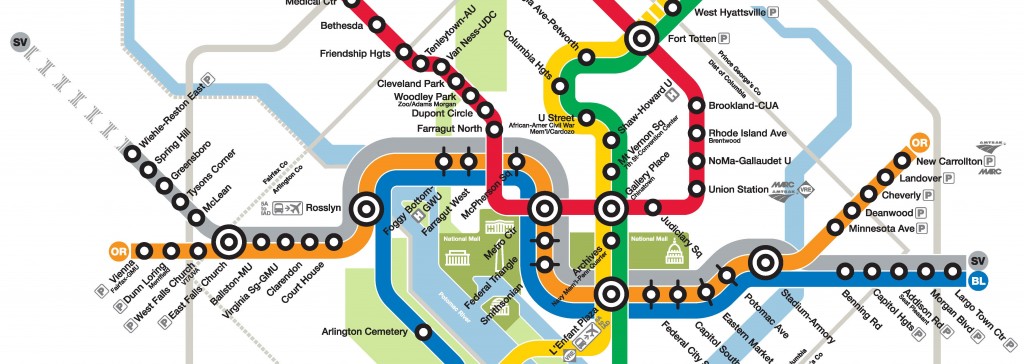
When the Silver Line opens, many bus lines will be reorganized – to serve the five new Metrorail stations, change routes that will become redundant, and to ensure an integrated approach to the overall bus and rail network.

The Metro Board of Directors approved the Metrobus service changes in December (details). Exact schedules are not yet  finalized but will become available as we get closer to the Silver Line opening at the end of the year.

60 bus routes serve the areas affected by the Silver Line, 13 of which are Metrobus routes. Metro has been working closely with Fairfax Connector, Loudoun County, and other operators to be sure all the changes work together and make sense. Generally, here’s what to expect:

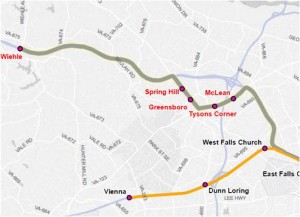
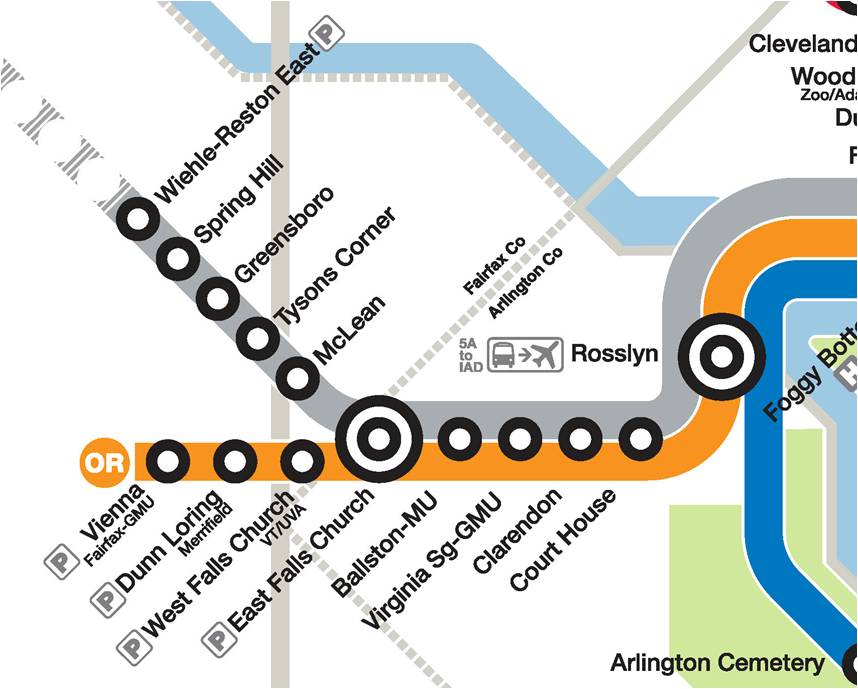
  • All 5 new Silver Line stations will have bus service
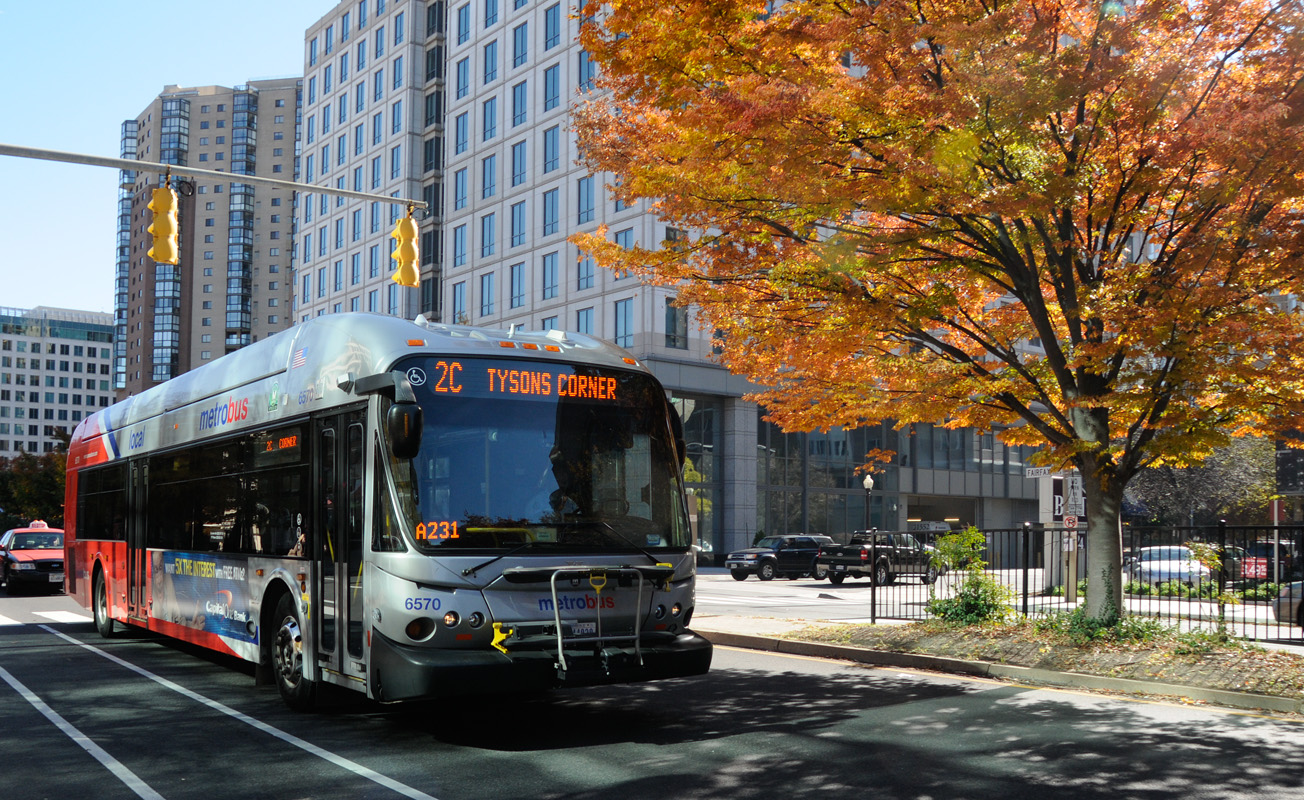
  • Many Metrobus routes will be re-routed to serve the Tysons Corner area. Affected routes include the 1C, 2A, 2B, 2C, 2G, 2T, 3A-E, 3T, 15K, 15L, 15M, 23A, 23C, 24T, 28A, 28T, and 28X.  (See the more detailed Metrobus proposal).
  • A circulator bus system will serve the Tysons area, including the new Silver Line stations in Tysons
  • Many Fairfax Connector buses connecting Reston and Herndon to West Falls Church station will now serve the Wiehle Avenue Silver Line station
  • 7 Loudoun County buses will move from West Falls Church to Wiehle Avenue station
  • 3 Prince William County buses will move to Tysons Corner station
  • Going to Dulles Airport? Metrobus 5A will remain unchanged, and the express Washington Flyer buses will move from West Falls Church to Wiehle Avenue station.

When does all this happen? All bus changes will need to take effect by the first day of Silver Line operations!

For more information on Fairfax County bus changes in particular, visit their extensive website on the Silver Line changes.

Categories: In The News Tags: , ,

What Will Happen to the rail schedules with the Silver Line?

March 12th, 2013 25 comments

DullesMap.02.05.13+v4+-+cropped

When the Silver Line opens, Metro will adjust the rail schedule to accommodate increased service. What will change, and how will it affect you?

The Silver Line, which will run from Reston and Tyson’s Corner to Largo Town Center, will bring a net increase in rail service. But exactly how will it affect you? That depends on when you travel.

At peak times, Metro will need to make a few adjustments to make room for the Silver Line. The map below shows where the number of trains goes up, down, or stays the same. Metro’s main constraint is at Rosslyn, where three lines – Orange, Blue, and Silver – come together. At Rosslyn and into downtown, Metro can handle a maximum of 26 trains per hour, or a train every 2 minutes and 20 seconds or so.  (To keep things simple, this blog post uses the AM peak hour to illustrate peak rail changes).  In a nutshell, the Silver Line rail operating plan will:

  • Add Silver Line trains every 6 minutes,
  • Redirect 2 more Blue Line trains per hour onto the Yellow Line,
  • Convert some Orange Line trains from Vienna to Silver Line trains,
  • Discontinue some one-way Orange Line trains we currently run (called “trippers”) because they will be replaced by Silver Line trains.

As a result, service will increase in several places, shown in green below: Read more…

Categories: In The News Tags: , ,

What is the Silver Line, and Where Will it Go?

March 11th, 2013 7 comments

New Silver Line stations opening around the end of 2013. (Click for full map)

New Silver Line stations (Click for full map)

You may have heard about the Silver Line – but what is it, and where will it go? What’s nearby the new stations? To go along with the open houses on the Silver Line this week, here’s a primer on some Silver Line basics:

What is the Silver Line? A new Metrorail extension in Virginia serving Tysons Corner and Reston.  Phase 1 is nearing completion now and will open around December 2013. Phase 2 is just beginning construction, and will serve Dulles International Airport and beyond. Because the line serves the Dulles corridor and will eventually serve the Airport, the Silver Line is sometimes called the “Dulles Corridor Metrorail Extension.”

Where will the Silver Line go? The new tracks will branch off from the Orange Line between East Falls Church and West Falls Church. There will be five new stations in Phase 1 – four clustered around Tysons Corner, and one farther west at Wiehle Avenue in Reston. Phase 2 will reach Dulles Airport and beyond in several years.

Read more…

Categories: In The News Tags: ,

Come Learn About the Silver Line

March 4th, 2013 8 comments

Come learn about the new Silver Line next week

Come learn about the new Silver Line this week and next

Join us for a series of community events to learn about service improvements to bus and rail coming along with the new Silver Line service to Tysons Corner and Reston.  We will be on-hand to discuss what the new service means to you, including changes to the Orange and Blue Lines, and local buses.

The “main event” will be three Open Houses which will feature informational exhibits on rail and bus service, a table where we will be collecting public feedback, a section for children’s activities as well as a “WMATA tools section” where folks can learn about Next Bus, sign-up for e-Alerts and get other useful information. Here’s the schedule and locations:

–      Tuesday, March 12, 5-8p at Faith Temple #2 Baptist Church, 211 Maryland Park Drive, Capitol Hgts., MD 20743 (walk from Capitol Heights Metrorail station, Metrobus 96 or 97)

–      Thursday, March 14, 5-8p at the Reston Community Center Hunters Woods, 2310 Colts Neck Road, Reston, VA 20191 (Fairfax Connector: RIBS 1/3, RIBS 2 & Route 551)

–      Saturday, March 16, 11a-4p at the Sheraton Crystal City, 1800 Jefferson Davis Highway, Arlington, VA  22202 (walk from Crystal City Metrorail station, Metrobus 9A, 9E, 9S, 10A, 10E)

Prior to the Open Houses, we will host a series of smaller events or “Pop-Ups” this week in the community.   At each of these, we’ll be stationed at a table to answer your questions, provide information and give you a chance to provide us your feedback.  Here’s the schedule and locations for these events:

–      March 5, 4-6p at Largo Town Center Metro

–      March 7, 4-6p at West Falls Church Metro

–      March 8, 10a-2p at Tysons Corner Center Mall I (on the first floor near Barnes & Noble)

–      March  8, 4-6p at Pentagon City Metro

–      March 9, 10a-2p at the Eden Center (6751 Wilson Blvd, Falls Church, VA 22044)

The public comment period will run from February 28 through March 18, 2013.  You may submit your comments at the events or online on the project’s website, wmata.com/silverline.

Metro Studying Opportunities for Coordination of Regional LRT and Streetcar Systems

February 21st, 2013 1 comment

Streetcar and LRT Map

This map shows the corridors being studied by the region for potential light rail, streetcar, or bus rapid transit lines. Click the image for a larger version.

The Washington, DC metropolitan region may be the home of a light rail line and several streetcar lines in the near future according to regional plans.  The state of Maryland is in the preliminary engineering phase of the Purple Line, a 16-mile light rail line that is proposed to run between Bethesda in Montgomery County to New Carrollton in Prince George’s County.  The District of Columbia has almost completed construction of the H Street-Benning Road streetcar line, with scheduled revenue operation expected to begin later this year, and has also planned an expanded streetcar network.  Meanwhile, Arlington and Fairfax Counties have submitted an application for federal Small Starts funding to begin project development for the Columbia Pike Streetcar line, running almost five miles from Pentagon City in Arlington to Bailey’s Crossroads in Fairfax County.  Arlington County is also advancing planning for its Crystal City Streetcar project, which would run from Pentagon City, through Crystal City, to the southern Arlington County line in Potomac Yard.   (The Crystal City Streetcar project can be considered a follow-up to the Crystal City Transitway project currently under construction.)

Recognizing that Metro isn’t the sponsor or funding agent for these LRT and streetcar systems, and that key decisions made early in the process on the Columbia Pike and H Street streetcar lines have the potential to affect other systems for years to come, Metro has been coordinating with the sponsors since 2010 through the LRT and Streetcar Interoperability Study.  A briefing on this study was presented to the Metro Board in early 2011. Read more…

A World Without Metro, Part 1: I-395 Traffic

February 19th, 2013 Comments off

Metro’s new strategic planning process, Momentum, articulates a vision for the the next generation of Metro.  One way to illustrate Metro’s vital role in the region’s transportation network is to show the impact of not having Metro.  This series will give perspective on the many real benefits that Metro conveys to the region today.

Metrorail’s Yellow Line crosses the Potomac from Virginia into DC parallel to I-395’s 14th Street Bridge.  Both the rail and highway bridges move large numbers of people into the regional core during the morning rush hour.   Between the two inbound spans, the 14th Street Bridge has six  lanes.  The Yellow Line provides the equivalent of three additional lanes.  This math is pretty simple:  one lane of freeway traffic can move about 2,420 people per hour (2,200 vehicles per hour times an average auto occupancy of 1.1 people per car) and the Yellow Line moves around 7,400 passengers from Pentagon to L’Enfant Plaza during the peak AM hour.   Another way to see it is that the Yellow Line removes 6,700 (7,400 pax / 1.1 pax per car) cars from the road.

What would happen to I-395 if some or all of the in-bound Metrorail Yellow Line customers switched to driving in the morning?  

If only 5% of Yellow Line customers drove up the freeway to the 14th Street Bridge during the AM peak hour, I-395 would fill with stop-and-go traffic for ten miles.

Map illustrating regularly recurring three-mile queue and the 10-mile queue that would regularly form if only 5% of the inbound AM commuters on the Yellow Line across the Potomac River switched to driving.

Map illustrating regularly recurring three-mile queue and the 10-mile queue that would regularly form if only 5% of the inbound AM commuters on the Yellow Line across the Potomac River switched to driving.

How is this possible?

Read more…

Categories: Impact Tags: , , ,

Metro Anchors the Region’s Growth

February 14th, 2013 Comments off

Regional Activity Centers in the core jurisdictions served by high-quality Metro service. Click the image for a full regional map.

Of the 120 COG regional activity centers in the Metro Compact Jurisdictions, 81 are now or will soon be served by high quality Metro transit, either Metrorail or the Metrobus Priority Corridor Network (PCN). That means that two-thirds of these activity centers are primed to support transit-oriented developments. The map above illustrates the activity centers in the core jurisdictions and their level of transit service. Click the image  for a full regional map.

Some jurisdictions have placed a greater emphasis on high-quality transit service when deciding upon areas to designate as regional activity centers.  The chart below shows the total number of activity centers per jurisdiction and the percentage served by Metrorail and/or the PCN.  The core jurisdictions (the District, Arlington and Alexandria) each have over 80% of their activity centers served by high-quality Metro transit.  The beltway jurisdictions (Montgomery, Prince George’s and Fairfax counties) have between 48% and 70% of their activity centers served.   Loudoun County, soon to be added to the compact with two activity centers receiving Metrorail service when the Metrorail to Dulles Phase II comes online, has the lowest percentage of activity centers served by Metro.

The relationship between regional activity and high-quality transit is no accident.  Economic activity gravitates towards areas of greater accessibility, including Metrorail station areas and commercial corridors — once streetcar routes — currently served by Metrobus. However, transit service can also be extended to areas of economic activity which developed due to good highway accessibility, such as Tysons Corner.

As the local jurisdictions continue to focus population and employment growth into these areas, Metro and other regional transit operators are working to connect them to the regional core and to one another through high-quality transit.  It is clear from the current levels of highway congestion that Metropolitan Washington needs more high-quality Metro service (bus and rail) in order to support the growth anticipated over the next 25 years.

One goal of Momentum, Metro’s strategic planning process, is increasing regional mobility and connecting communities.

About the COG Activity Centers

The activity centers list, recently updated by the Metropolitan Washington Council of Governments (COG), describes where the local jurisdictions plan to focus household and job growth in order to support regional goals of transit-friendly development patterns and sustainability. This updated list includes 120 activity centers within the Metro Compact Jurisdictions (including Loudoun County) and additional 19 within the COG planning area not served by Metro, including Charles, Frederick and Prince William Counties, and the cities of Manassas and Manassas Park.

Categories: Impact Tags: , , , , ,

One Day of Washington Region Transit

February 11th, 2013 1 comment

Recently we showed you a visualization of Metrorail, Metrobus and Circulator transit created by a STLTransit.  The developer had created the previous visualization from the GTFS file available from the WMATA developers resources page.

Metro regularly exports all of the data from our Trip Planner into a separate GTFS file which we share with COG/TPB for updating regional transit schedules in their travel demand model.  We are working to make this file publicly available.  In the mean time, we were able to share it with STLTransit who kindly created the updated fully regional visualization of Washington area transit, embedded above.

As with last time, this visualization is best viewed full-screen and in HD mode.

Some interesting things to note:

  • Frederick County TransIT service use of timed transfers (or pulse points) at transit centers is very noticeable.
  • MARC and VRE commuter rail are illustrated as white tadpoles, not to be confused with the colored tadpoles representing Metrorail service.
  • The expansiveness of the commuter rail network becomes very apparent, as those white tadpoles shoot towards the edges of the map to the northeast, northwest and south.

STLTransit apparently cranks out one or two visualizations of a city or regional transit system every few days.  Check out their YouTube channel and subscribe.

Categories: Engage Tags: , , ,

Metrorail Ridership on Inauguration Day

January 23rd, 2013 Comments off

On Monday, hundreds of thousands thronged the National Mall to watch the Presidential Inauguration and parade, and many came by Metrorail.  To accommodate the crowds, Metro ran rush-level service for 17 consecutive hours.  Just how busy was Metrorail?  Here are some highlights, using our preliminary faregate counts:

Metrorail ridership (entries) by fifteen-minute intervals, Inauguration Day 2013

  • Total rail ridership came in at about 800,000 passengers for the day– higher than a typical weekday, 2-3 times the level of a weekend day or holiday, but lower than the 2009 Inauguration.
    • It should be noted that this year Inauguration Day fell on the Martin Luther King Jr. Day holiday.  Therefore, part of the lower ridership this year is likely due to many people having the day off this year when in 2009 they did not.
  • Early start! Over 90,000 customers entered the Metrorail system before 7:00 am.
  • By the time the President began speaking at noon, Metrorail had already provided 343,000 trips.
  • From miles around!  End-of-line stations saw the biggest increases in ridership.
  • Carpooling helped many more people access rail at stations where parking is limited.  Franconia-Springfield, for example, recorded over 16,000 rail system entries before noon – 10,000 more than normal, and well over the 5,069 parking spaces available.
  • Hundreds of tour buses at RFK Stadium helped generate 10,200 entries at Stadium-Armory before noon, about 5 times that station’s normal ridership.
  • The afternoon peak lasted nearly 5 hours from 12:30 to 5:30pm. During this time, another 300,000 passengers entered the system – nearly half through only six stations downtown.

Rail ridership was especially concentrated at a few stations around the Mall:

  • By noon, the top 10 busiest stations near the Mall had collectively seen twice as many passengers exiting as a normal weekday.
  • L’Enfant Plaza station recorded an impressive 70,000 exits before noon on Monday (normal is around 15,000 for the same timeframe on a weekday). At one point, between 8:00 and 8:15am, 3,600 people exited at L’Enfant Plaza – about 240 passengers per minute.
  • Gallery Place handled 53,000 entries after noon on Monday (more than twice its normal ridership for the same timeframe) and experienced three “peaks” – 1-2pm after the Inaugural address, 4-5pm after the parade, and then again at 10pm-1am for late-night revelers.
Top 10 Stations for Entries, Before Noon:
  1. Franconia-Springfield: 16,319
  2. Vienna: 14,289
  3. Greenbelt: 12,500
  4. New Carrollton: 11,917
  5. Shady Grove: 10,431
  6. Pentagon City: 10,303
  7. Stadium-Armory: 10,245
  8. Silver Spring: 9,630
  9. Branch Avenue: 9,520
  10. Crystal City: 8,567

Top 10 Stations for Entries, After Noon:

  1. Gallery Place: 53,077
  2. L’Enfant Plaza: 36,628
  3. Metro Center: 34,125
  4. Union Station: 31,574
  5. Farragut West: 22,618
  6. Farragut North: 20,030
  7. Federal Triangle: 19,331
  8. Foggy Bottom: 18,152
  9. Judiciary Square: 14,458
  10. McPherson Square: 13,161

Did you ride Metro on Monday?   These numbers provide one perspective, and we’d like to hear about your experiences in the comments below.

Categories: In The News Tags: , , ,

Chart of the Week: “Hotspots” for Pedestrian and Bike Access to Rail Stations

December 17th, 2012 11 comments

Heat map showing short-distance parking access at Forest Glen station, which indicates good opportunities for pedestrian and bicycle access (click for full map)

In our effort to improve safety, access and sustainability, Metro is expanding our understanding of bike and pedestrian barriers faced in commuting to our Metrorail stations. Over the past several years, we have focused our bike and pedestrian project planning and implementation efforts on improvements we can make to our station areas such as, installing bike racks or constructing pedestrian improvements. Now, we’d like to expand the envelope and develop a list of access needs beyond our own boundaries and work with our jurisdictional partners to make needed improvements.

One way we are doing this is by gaining a better understanding of where auto commuters come from when they drive to our stations, and zeroing in on areas where we see a good deal of auto access to determine if there are barriers to walking or biking to the station.

The map at right (full version) shows auto-to-station “hot spots” around the Forest Glen station, to pick one example, locations from which clusters of customers drive and park at Metro. According to the 2007 Metrorail Passenger Survey data, many customers drive from within a 1-3 mile radius; some are even closer. So why are so many people from this area driving? In our 2010 Bicycle and Pedestrian Master Plan, we teased out some of the more broad-based reasons why people drive rather than walk or bike – now we’d like to explore each station’s local conditions and see what can be done to improve walk and bike access.

The Forest Glen station is located north of the Capital Beltway and west of Georgia Avenue. More commuters to Forest Glen are from north of the Beltway and east of Georgia Avenue. There is pedestrian overpass over the Capital Beltway which helps facilitate foot traffic:  Is crossing Georgia Ave then a barrier?  There are four Metro rail stations located within a 2-mile radius of Forest Glen which draw away commuters farther from the station. This could help to explain the highly localized nature of the parking shed.

There are many factors not considered here such as demographics, bus usage, and average driving trends. Further research into parking and commuting trends is in the works.

If you commute from this area, can you comment about what you experience on your commute? Do you drive?  If so, what factors influence you to drive instead of walk or bike? Would you like to walk or bike, but the infrastructure isn’t there or the traffic is too daunting? Or do you see something else from this data? We want to hear from you and appreciate any feedback you have that can make our system more accessible to pedestrians and cyclists.