Search Results

Keyword: ‘Metrorail Rider’

Metrorail Ridership on Inauguration Day

January 23rd, 2013 Comments off

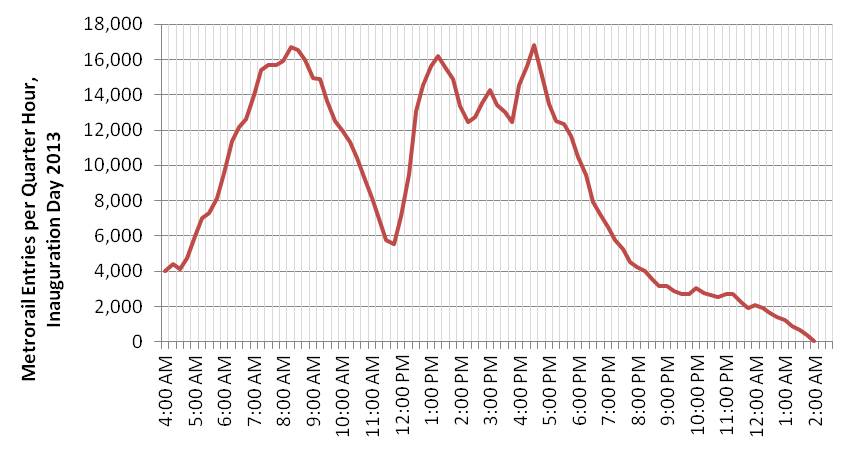
On Monday, hundreds of thousands thronged the National Mall to watch the Presidential Inauguration and parade, and many came by Metrorail.  To accommodate the crowds, Metro ran rush-level service for 17 consecutive hours.  Just how busy was Metrorail?  Here are some highlights, using our preliminary faregate counts:

Metrorail ridership (entries) by fifteen-minute intervals, Inauguration Day 2013

  • Total rail ridership came in at about 800,000 passengers for the day– higher than a typical weekday, 2-3 times the level of a weekend day or holiday, but lower than the 2009 Inauguration.
    • It should be noted that this year Inauguration Day fell on the Martin Luther King Jr. Day holiday.  Therefore, part of the lower ridership this year is likely due to many people having the day off this year when in 2009 they did not.
  • Early start! Over 90,000 customers entered the Metrorail system before 7:00 am.
  • By the time the President began speaking at noon, Metrorail had already provided 343,000 trips.
  • From miles around!  End-of-line stations saw the biggest increases in ridership.
  • Carpooling helped many more people access rail at stations where parking is limited.  Franconia-Springfield, for example, recorded over 16,000 rail system entries before noon – 10,000 more than normal, and well over the 5,069 parking spaces available.
  • Hundreds of tour buses at RFK Stadium helped generate 10,200 entries at Stadium-Armory before noon, about 5 times that station’s normal ridership.
  • The afternoon peak lasted nearly 5 hours from 12:30 to 5:30pm. During this time, another 300,000 passengers entered the system – nearly half through only six stations downtown.

Rail ridership was especially concentrated at a few stations around the Mall:

  • By noon, the top 10 busiest stations near the Mall had collectively seen twice as many passengers exiting as a normal weekday.
  • L’Enfant Plaza station recorded an impressive 70,000 exits before noon on Monday (normal is around 15,000 for the same timeframe on a weekday). At one point, between 8:00 and 8:15am, 3,600 people exited at L’Enfant Plaza – about 240 passengers per minute.
  • Gallery Place handled 53,000 entries after noon on Monday (more than twice its normal ridership for the same timeframe) and experienced three “peaks” – 1-2pm after the Inaugural address, 4-5pm after the parade, and then again at 10pm-1am for late-night revelers.
Top 10 Stations for Entries, Before Noon:
  1. Franconia-Springfield: 16,319
  2. Vienna: 14,289
  3. Greenbelt: 12,500
  4. New Carrollton: 11,917
  5. Shady Grove: 10,431
  6. Pentagon City: 10,303
  7. Stadium-Armory: 10,245
  8. Silver Spring: 9,630
  9. Branch Avenue: 9,520
  10. Crystal City: 8,567

Top 10 Stations for Entries, After Noon:

  1. Gallery Place: 53,077
  2. L’Enfant Plaza: 36,628
  3. Metro Center: 34,125
  4. Union Station: 31,574
  5. Farragut West: 22,618
  6. Farragut North: 20,030
  7. Federal Triangle: 19,331
  8. Foggy Bottom: 18,152
  9. Judiciary Square: 14,458
  10. McPherson Square: 13,161

Did you ride Metro on Monday?   These numbers provide one perspective, and we’d like to hear about your experiences in the comments below.

Categories: In The News Tags: , , ,

Chart of the Week: Influencing Factors on Weekend Metrorail Ridership

November 13th, 2012 2 comments

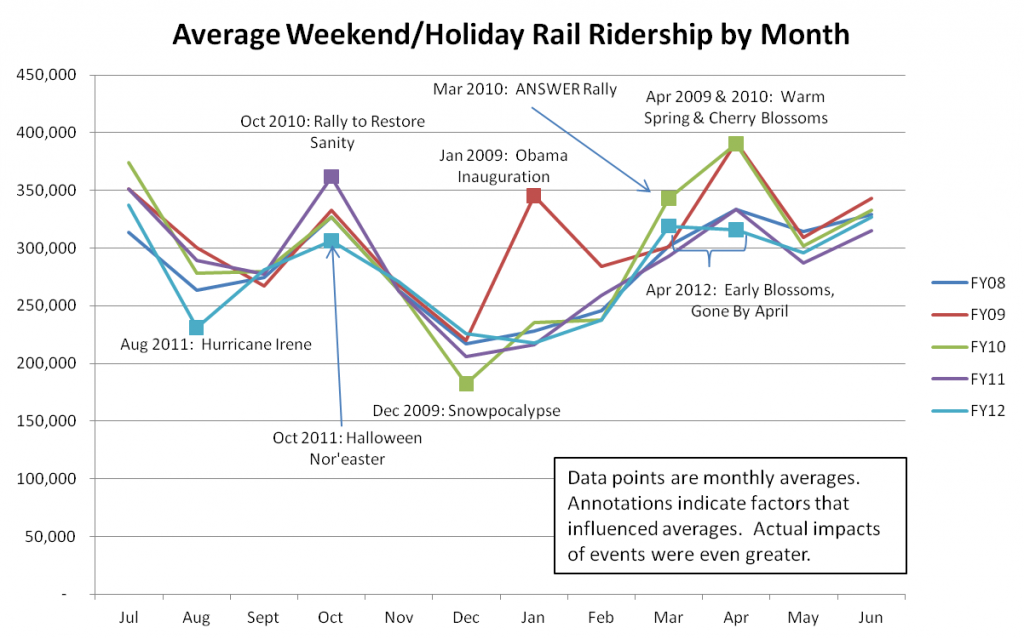
Average weekend ridership by month, FY08 to FY12.Events that impacted the average ridership during a given month are indicated with annotations.(Click for a larger version.)

A recent assessment of rail ridership over the past five years has concluded that in addition to moving people to and from work during the week, Metro also has a critical role to play in moving people to and from weekend activities and special/holiday events.

From the chart above, it is clear that Metrorail supports a large volume of travel to a wide variety of special events that are unique to the area:presidential inaugurations, issues rallies, and cultural events such as the annual Cherry Blossom Festival.  Metro is more than just a commuting tool:  the hundreds of thousands of trips on weekends and holidays show that the rail system is busy on weekends, too.

It is also important to note that Metrorail is not immune from the impacts of severe weather, such as the massive weekend snowstorm in December of 2009 and Hurricane Irene in August of 2011, both of  which cut into ridership and reduced revenues.  And because weekend trips are more often discretionary than weekday work trips, the impact of weather on weekend ridership can be much greater (in percentage terms) than on weekdays.


Data Download: Metrorail Ridership by Origin and Destination

October 31st, 2012 25 comments

Photo courtesy Josh Bancroft (click for original context)

Every day, Metro gathers a vast amount of information on how customers use the system – where and when they pass through turnstiles and board buses, how they pay, and more. There’s much to be learned from this data, and many in the past have done so.  We’ve heard through MindMixer, Metro’s new online community engagement site, that more detailed ridership statistics would be useful.  So in the spirit of open data and collaboration, here’s a data download of rail station-to-station passenger counts, by time period, by day of the week, for May 2012.

May 2012 Metrorail OD Table by Time of Day and Day of Week (.xls, 6.8 MB)

This data can answer many questions, such as: Where do passengers entering at one station go? Where do late-night riders enter the system? How does Saturday ridership differ from Sunday? Which stations are most commuter-oriented, and which are most lively at midday and evening hours?

What does this data tell you? Do you see any patterns? Feel free to post a link in the comments!

What other data that would help answer additional questions?

Technical notes about this data:

  • The data show average ridership, averaged across all days in May 2012, excluding Memorial Day. (We typically use May as an “average” month, since it falls in the middle of seasonal swings, is relatively unaffected by extreme weather, etc.)
  • Time period shows the time the passenger entered (not the time they exited).
  • AM Peak = opening to 9:30am
  • Midday = 9:30am to 3:00pm
  • PM Peak = 3:00pm to 7:00pm
  • Evening = 7:00pm to midnight
  • Late-Night Peak = Friday and Saturday nights only, midnight to closing

What Happens to Metrorail Ridership on Holidays?

October 25th, 2012 3 comments

About ten days a year, Metrorail operates on a holiday schedule. On some holidays, most commuters have the day off, like Christmas, Labor Day, or Independence Day. But other days can be holidays for some, but not others – like Columbus Day, Veterans Day, or Martin Luther King, Jr. Birthday – and these often fall on a Monday or Friday to make a long weekend.  Federal workers, whom we estimate at over a third of peak ridership, usually get these days off, as do others.  Metro often uses some holidays to do trackwork. So what happens to rail ridership on holidays?

To answer this question, this post examines total ridership on holidays over the past few years, by holiday, and by time of day. I excluded Christmas, New Year’s Day, and Independence Day, since these holidays are strongly influenced by how they fall in the calendar, and by the events on the National Mall on Independence Day.

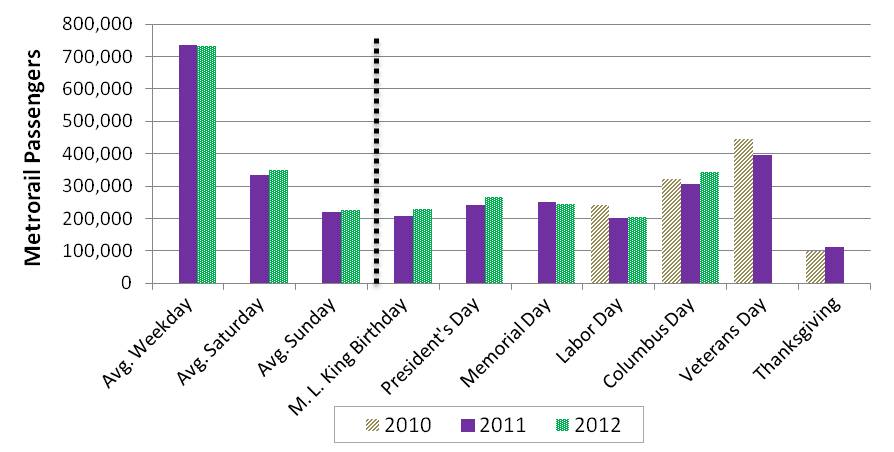
Here’s a look at ridership on the remaining 7 holiday weekdays.  For the sake of comparison, I also show an average weekday, Saturday, and Sunday for May 2012.

Historical Metrorail ridership on holidays, compared to average May weekday, Saturday, and Sunday

So, all holidays shown have much lower ridership than a typical weekday, and are more in the range of a Saturday or Sunday. A typical weekday on Metrorail shows around 730,000 riders per day, with Saturdays about half that, and Sundays around a third of a weekday.  The holidays shown above are in the range of  200,000 to 400,000 riders per day.

Read more…

Categories: Engage Tags: , , ,

Chart of the Week: Metrorail and Metrobus Ridership 5-Year Trend

October 29th, 2012 Comments off

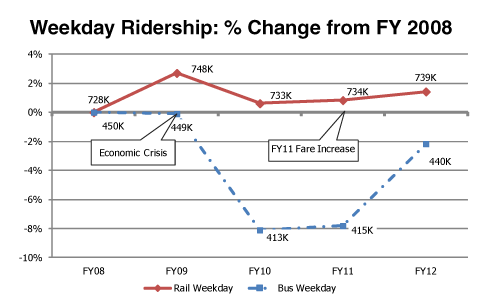
A recent analysis of 5 years worth of ridership data has shown the impacts of the economic downturn and subsequent recovery on Metrorail and Metrobus ridership. Metrorail ridership experienced a 2% drop in ridership in FY10 and then recovery in FY11 and FY12, 1% below FY09 levels. Metrobus ridership experienced an 8% drop in FY10 and began recovery in earnest in FY12, returning to just over 1% above FY08 levels.

Categories: Engage Tags: , , ,

Peak Hour Passenger Ridership on Metrorail

November 29th, 2010 1 comment

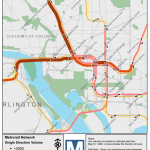
More than two-thirds of daily ridership occurs during the morning and evening peak periods.  In fact, the peak ridership is a key determinant to Metro’s operating plan and future system planning efforts.   An assessment of peak passenger ridership allows Metro to locate areas of current and future peak-period passenger crowding,  and then plan to develop and fund capital projects aimed at addressing these capacity-constrained locations.

In 2009, Metro’s Office of Long Range Planning developed a tool to estimate passenger ridership on individual rail segments based on the station-to-station origin-destination data in the ridership database.  The tool approximates passenger volume by peak hour and period.  Then we use GIS to map the link-level passenger volumes.

Read more…

Categories: Engage Tags: , ,

Metrorail Usage Data to Inform Analysis of the Current Budget Proposal Regarding Early Closures

September 23rd, 2016 2 comments

Data can help inform understanding of the potential impacts and mitigating strategies for potential changes to Metrorail’s span of service.

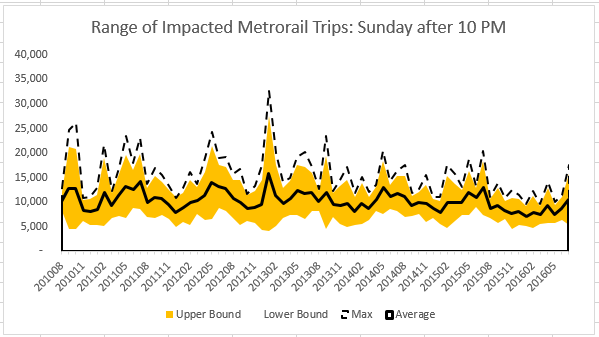
sunday_night_trend

Metrorail ridership after 10 PM on Sundays, by month, since August 2010. The black line is the average, the yellow band is one standard deviation +/- average. The dashed line is the maximum.

In June of 2016, Metro began closing at midnight on weekend nights to allow more time for track work over the weekends, in support of the SafeTrack program.  The Metro GM/CEO has recently announced he will pursue making this service change permanent.  To meet the necessary track work requirements to get the system in a state of good repair – recommendations which the FTA and others have also made – the current budget proposal for FY 18 includes various additional early closure options, including ending Metrorail service at 10 PM on Sundays.

Staff from across the agency are currently working to assess the impact of such closures on customers and determine what strategies we might employ to replace some or all of that rail service with alternatives.

Similar to our data release related to SafeTrack, we are glad to provide ridership data to assist with analyses by our local partners and members of the transit advocacy community.

First, average, standard deviation and maximum ridership after midnight on Friday and Saturday, and after 10 PM on Sunday by month, station, and hour, from 2010 to 2016.  (Excel, 13 MB)  The graph above illustrates one dimension of this data:  the average, usual range and maximum system ridership on Sundays by month since August 2010.  The biggest spike there is during Obama’s second inauguration weekend.  There is a lot to learn from this data set.

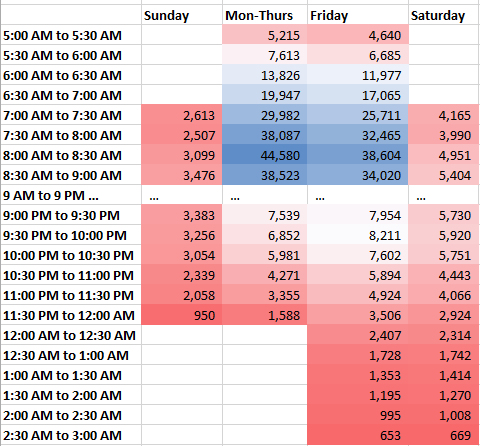
Secondly, we’ve put together Metrorail entries by half hour by day type.  The full dataset is available for download, but the relevant data is presented in the image below, showing the half-hour segments that have the lowest ridership.

span_of_service_ridership

We have also assembled additional visualizations of ridership during the potentially impacted periods: Read more…

Rail Ridership Data to Help the Region Plan for SafeTrack

May 27th, 2016 3 comments

To help the region and our partners plan alternatives and mitigate the impacts of SafeTrack, Metro releases rail ridership data applicable to this important maintenance effort.

SafeTrack example 2Rail Link Volumes: This data describes the number of customers on board trains between two contiguous stations, for a given hour of the day, then assigned to rail links.  For example, the link volume from Bethesda to Friendship Heights is the sum of everyone who boarded upstream, minus those who exited at or before Bethesda. This can be useful for planning SafeTrack mitigation efforts because it gives a first-order estimate of the potential demand for a bus bridge, for example.

Online Interactive Map of Metrorail Link Volumes, average weekday and Saturday in May 2015

Metrorail Link volumes, average weekday in May 2015, by hour, by line color (580kb, .xlsx)

Read more…

Metrobus Ridership During the Rail Safety Shutdown

May 23rd, 2016 2 comments

When Metrorail closed on March 16th, tens of thousands of rail riders switched to bus, including almost 20,000 riders who took their first bus ride in over a month! Bus-to-bus transfers spiked 45%, and ridership surged in downtown and central areas but fell in the suburbs.

Ballston Bus

Special thanks to the Systems & Performance Analysis team in Bus Planning for their help developing this analysis.

When Metrorail closed on Wednesday, March 16, Metrobus braced for impact as over 700,000 displaced rail trips sought alternatives. But there was little time or capacity to significantly alter bus service. What happened to bus ridership?

Overall ridership as tallied by the farebox came in at just 5% over the monthly average, or about 20,000 additional trips. So the changes look fairly small given the volume of displaced rail trips.

But don’t be fooled by the bottom line.  Underneath that total, a seismic shift was taking place. Read more…

Estimating the Impact of the US Citizenship and Immigration Facility on Metrorail

February 24th, 2016 Comments off

The Federal Government is the region’s single largest employer, and where it chooses to locate its jobs has huge implications for ridership, revenue, and the local operating subsidy.

We recently detailed why the Federal government’s location decisions matter so much to Metro – and you, the taxpayers who help support WMATA through your local taxes.  We’re always keeping an eye on moves within the region and certainly hopeful that any major moves (whether they are in the public sector or private sector) locate near Metrorail.  That’s because locating near Metrorail increases ridership, increases farebox revenue, and lowers the (your) taxpayer burden to support Metro.

Naturally, the news about GSA’s upcoming decision on the location of the US Citizenship and Immigration Services complex (USCIS) caught our eye and wonkiness.  We wanted to know about how much ridership and revenue the different options might generate.

US-Citizenship-and-Immigration-790x320

Read more…