The demographics of Metrorail riders change dramatically station to station, and reflect the race and income divisions of our region.
As part of Metro’s Title VI program, we spend time making sure we don’t disproportionately impact low-income and minority riders when we change and deliver service, change fares, and other policy changes. Our 2012 Metrorail Passenger Survey tells us a good deal of information about the race and income ranges of our riders, by where they are going, and when they travel. We conduct this research ourselves, giving us an extremely robust dataset on our riders. These survey responses are a key source of data underlying our Title VI analyses. In many ways, these results confirm that our region remains a Region Divided by income and race – across a noticeable east-west divide.
The map below shows low-income Metrorail riders by origin station, for a typical weekday in May 2012. Metro defines low-income as a rider with a household income less than $30,000 per year. Low-income ridership is somewhat concentrated in several areas, such as the inner southeast Green Line, and inner stations on the eastern Blue and Orange lines. The Green Line between Prince George’s Plaza and Shaw-Howard is also home to relatively large proportions of low-income riders.
No single station is more than 45% low-income.
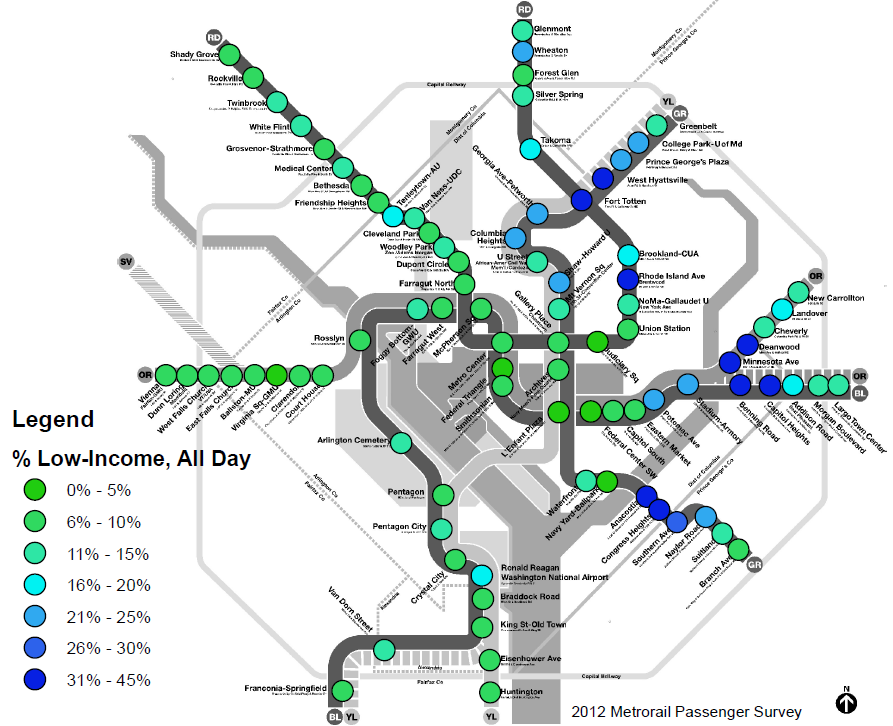
Average Metrorail ridership is 11% low-income, but can range from 3% to 40% station to station.
The next map shows minority Metrorail ridership by origin station, again for a weekday in May 2012. For Title VI purposes, a minority is defined as anyone who self-identifies as other than White, Non-Hispanic on our passenger survey. Minority ridership is concentrated most heavily on the eastern side of the rail network, but is also spread across other areas of the network as well – e.g., Wheaton and Glenmont, the Green-Yellow line. No single station is less than 22% minority.
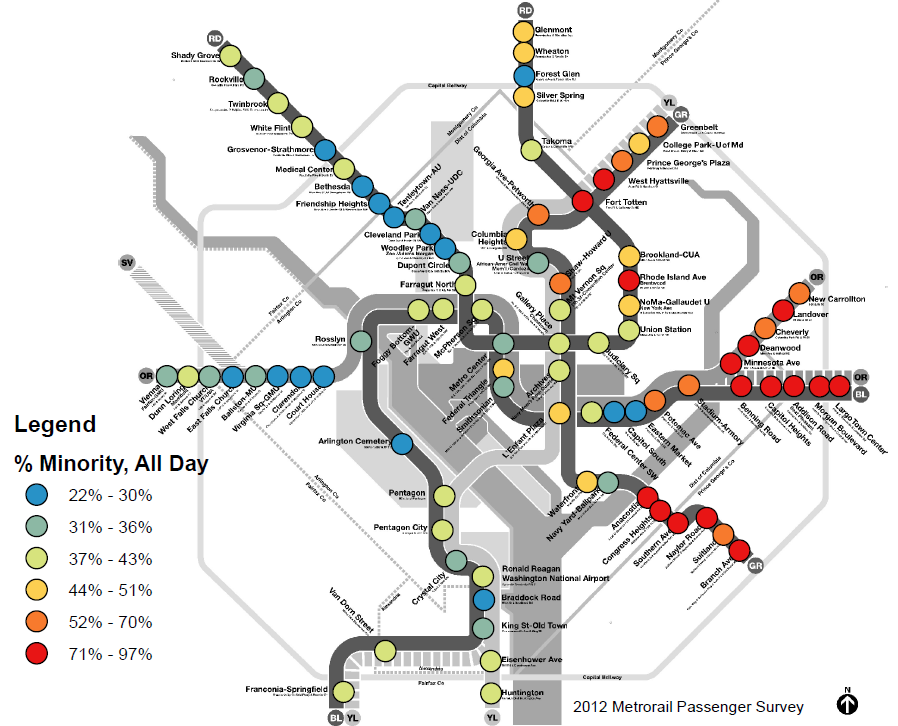
Average Metrorail ridership is 42% minority, but the rail system shows an east-west divide, similar to the divisions facing our region. Some stations are over 90% minority ridership, while others are as low as 22%.
We remain mindful of the travel patterns of low-income and minority riders, and use this data to help avoid disproportionate impacts to these riders when we make changes to the system. For example, we analyzed the impacts of the Silver Line at the passenger-trip level, looking at impacts and demographics at the individual origin-destination (O-D) pair level.
What patterns do you see here? Does anything jump out at you?


Recent Comments