Adopted from queueing theory, this new method of assessing delay on transit systems with tap-in-tap-out fare systems accounts for natural variations in customer behavior.
As you may have heard, Metro is testing out a new customer-oriented travel time performance indicator. Many departments here at Metro have been collaborating on this effort. Metro has decided to initially pilot a measure where we define delay as anything greater than train run time, a headway, and the 1-3 minutes it takes to travel from the faregates to the platform. However, as we began our research into customer travel time, we got to asking the question, “How do we define customer delay on the rail system?”
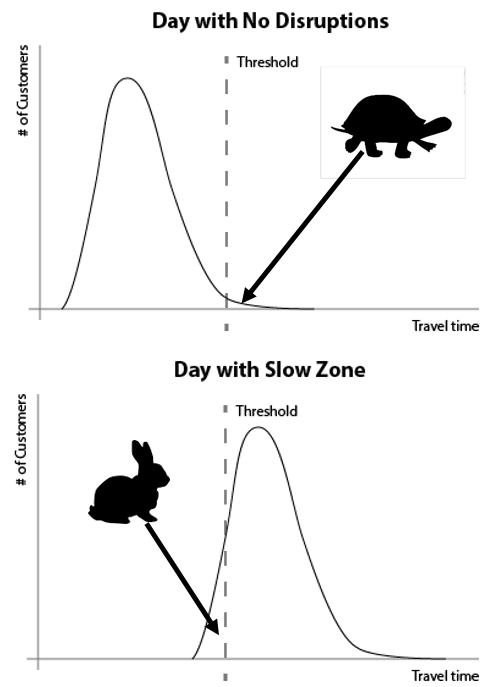
As we quickly learned when digging into the data, on good days with no delay on the rail system, there is still a wide variety of “normal” customer travel times. Some variation in travel time is because customers arrive at random to the origin station, but all leave the destination station more or less at once. Additional factors influencing this variation include walking speed, use of elevator vs. stairs, escalator or elevator outages, and customers with suitcases and strollers.
We could start with a threshold for “on time” but by definition we know on a good day there were no rail delays so we would be counting slower customers as “late.”
Additionally, on a day when we know a disruption has occurred, we might count very quick customers as “on time” when in fact we know that everyone experienced some delay.
So we set to determine a method for calculating delay that accommodated for the natural variation in customer speeds. These travel time curves started reminding me of delay calculations from queueing theory from grad school. Read more…
At the 2016 TRB Annual Meeting last month, Metro, together with DDOT and AECOM, presented the H and I Streets Bus Lanes as a case study of a bus lane in a downtown environment. TCRP Report 118 concluded that arterial bus lanes, ranging from low-cost restriping of existing lanes to new bus lanes, could offer 12-57% reliability improvements.
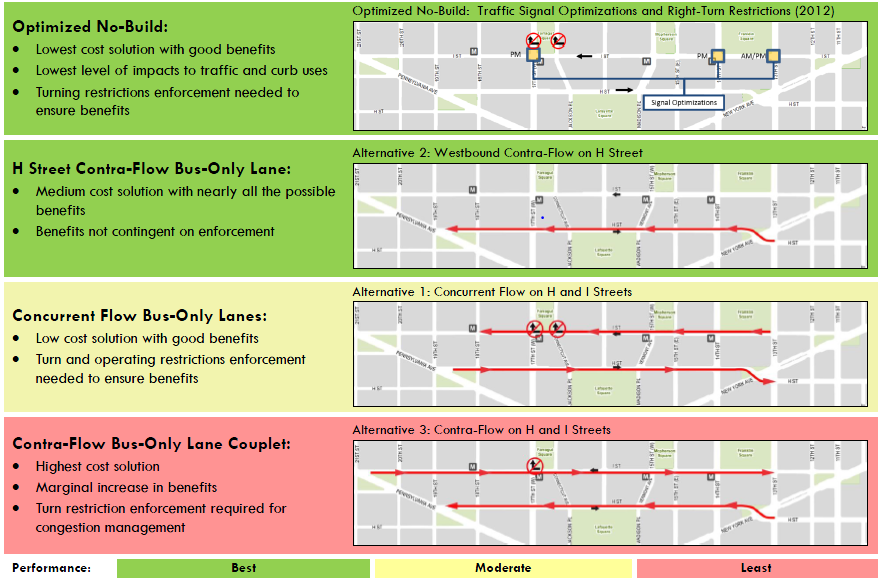
The presentation, built upon the 2013 study – H and I Streets Bus Improvements, highlighted the need for actions for all users and provided a range of improvement options for the H and I Streets corridor through downtown DC. We discussed details of the bus lane alternatives and benefits back in November 2013, and in the study’s final report (PDF). Here is a snapshot of the alternatives considered in the study:
Summary of Alternatives, click for a larger version.
The TRB session participants were interested in the status of the study recommendations, and raised a big question on how to solve bus delays in a large downtown area including river crossings. The good news is that DDOT is including the bus lane alternatives in a new study — more details soon — that aims to improve the urban design and enhance the streetscape along Pennsylvania Avenue between 17th St. NW and Washington Circle. The DDOT study intends to assess the operational feasibility of the contra-flow bus lane on H Street – the best performing bus lane alternative in the 2013 study. This study will be initiated in 2016.
Stay tuned.
Update, 2/25/2016: The paper has been accepted for publication in the Transportation Research Record, Journal of the Transportation Research Board.
Metro’s award-winning Public Participation Plan (PPP)helps us be strategic in our efforts to engage minority, low income and limited English proficient (LEP) populations in transit planning and programming activities. Here’s how we work to produce successful results.
One of the very first things we do when a project begins is to develop a Project Communications and Outreach Plan – or PCOP for short. Our dedicated External Relations (EREL) team meets with the Metro “project sponsor” and other stakeholders to understand the parameters of the project, identify the type of outreach needed, and put a schedule of activities in place. In the past year since we adopted our PPP, it has become clear that no one PCOP is the same as another and no one strategy meets the needs of every project. Read more…
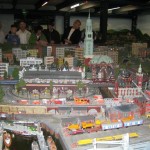
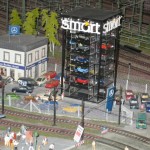
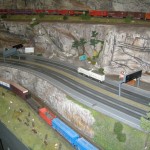
If you ever find yourself in Hamburg, Germany, then you must visit the Miniatur Wunderland.
This is the world’s largest miniature train exhibit, and it is definitely a ‘must-see’ for train lovers. As of September 2015, it had over 13 kilometer of tracks. Additionally, multiple countries and regions are represented in the settings, including Germany, Austria, Switzerland, Scandinavia, and the US. This entire model setting took over 500,000 hours to create. There are 900 trains and 1,200 train cars, with the longest train being 14.51 meters long.
If you don’t have the time, or money, to make a visit, you can check out the video below to see how complex the Wunderland is.
Below are some up close shots from 2005. This exhibit is continually changing and growing, so no two visit are alike. What is impressive about this exhibit is the fact that not only are trains in constant motion, there are also wireless controlled vehicles moving about. The exhibit also squeezes in some humor with hidden quirks for those who are observant.
What are some of your favorite train/bus related museums?
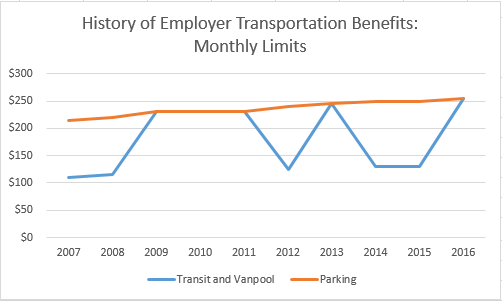
After years of analysis, advocacy and lobbying, Congress has restored the transit commuter benefit to match the parking benefit, helping Metro, the region and the nation.
The employer transportation benefit for transit and vanpools has fluctuated a lot in recent years. In February of 2009, it was increased from $120 to $230, matching the parking benefit. Almost three years later, in January of 2012 it was slashed to $125 only to be raised to $245 the following year. After only a year, it was slashed again, this time to $130 where it stayed for two full years. In January of this year, it was raised to $255 to permanently match the parking benefit. Metro Board of Directors member Tom Bulger — an outspoken advocate for the transit benefit — played a vital role in ensuring its restoration to match the parking benefit. Thanks, Tom!
History of Employer Transportation Benefits, Monthly Limits. Data from Wikipedia.
The benefit amount wasn’t the only thing that has been changing. In 2010, the Metro implemented a series of new IRS rules for how the transit benefit could be used. For example, on smart media the transit benefit dollars had to be stored in a separate “purse” that could only be use for transit fares and not for parking costs at park-and-ride facilities. Employers also began asking employees to specify exactly how much transit fare was needed each month, instead of setting one amount and accruing benefits for trips untaken. Perhaps most importantly, a new rule stated that those unused dollars in this transit-only purse were to be “clawed back” at the end of each month. Read more…
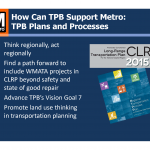
Metro and the Transportation Planning Board (TPB) engaged in a wide ranging discussion with TPB board members about how the TPB and the region’s jurisdictions can support Metro now and in the future. Not surprisingly, there’s a lot more to it than just predictable funding.
At the December 16th Transportation Planning Board (TPB) meeting (audio), Metro Board Member Harriet Tregoning gave the final presentation (pdf) and facilitated a discussion on Metro’s challenges and provided specific recommendations and/or opportunities for the TPB and local jurisdictions to increase their support the Authority today, tomorrow, and into the future. The focus of the discussion was specifically on plans, processes, and actions that the TPB and local jurisdictions can modify or begin that will ensure predictable funding and/or enhanced funding options, incorporate land use as a transportation strategy, increase transit-supportive land use decisions, prioritize bike and pedestrian access, and advance bus priority on the streets that local jurisdictions operate.
Last summer, TPB members requested a more extensive conversation surrounding Metro’s challenges as well as recommendations on how TPB, through its plans and processes, and local jurisdictions, through their decisions and funding, could support Metro. Metro opted to provide three presentations and the December presentation built on information provided at the November 18th meeting (audio) on Metro Fundamentals (pdf) and Momentum (pdf) that were given by Tom Webster, Managing Director of Metro’s Office of Management and Budget, and Shyam Kannan, Managing Director of Metro’s Office of Planning. The November presentations served to ensure a baseline understanding across TPB Board members, highlight our capital and operating challenges, and identify safety, state of good repair, and longer term needs to ensure safe, reliable transit that meets the growing region. Read more…
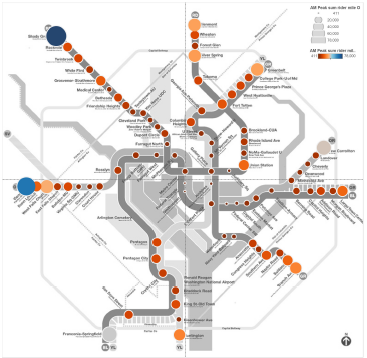
Metrorail ridership is heavily-determined by station-area land use patterns, so attention to land use as a transportation strategy will be important to sustaining Metrorail’s long-term ridership growth.
There has been a tremendous amount of attention recently paid to Metrorail’s ridership trends. While history tells us that the current ridership snapshot – which shows that ridership has essentially flatlined – is quite normal given the cyclic nature of ridership growth, Metro’s Office of Planning has been exploring why certain station areas and rail segments have seen ridership gains during the downturn, while other station areas and segments have seen losses.
Passenger Miles Traveled by Trip Origin at Each Metrorail Station, AM Pea, Full-Fare Riders with no Transit Benefits. One of the inputs from this study.
The questions we sought answers to included, for instance:
Why is it that while system-wide ridership declined last year, we saw ridership gains at stations with lots of transit-oriented development, such as NoMA, Columbia Heights, and Navy Yard-Ballpark?
How much of an impact does transit-oriented development have on overall ridership, and can that impact be measured, both in terms of new ridership as well as in terms of net new farebox revenue?
With so many ways to get around – including walking and biking and Uber and Lyft – and gas prices at near historic lows, how does a Metorail trip compare to other ways of getting around in terms of overall competitiveness?
Does the location of a transit oriented development project matter in terms of how much ridership it generates? Does that vary by the type of project (i.e. office, retail, residential, etc)
The 95th Transportation Research Board (TRB) annual meeting is coming to town! This annual meeting will host 12,000 transportation professionals from around the world and more than 5,000 presentations covering all transportation modes, including public transportation. At the 2016 annual meeting, Metro staff will be sharing Metro’s experience and best practices on a number of transit development and planning initiatives.
Jordan from the Office of Performance will introduce the development of a new performance measure of travel time reliability (Event 823: Where is My Ride?). This new measure can be used by customers to better plan their trips and by Metro to optimize rail operations. Read more…
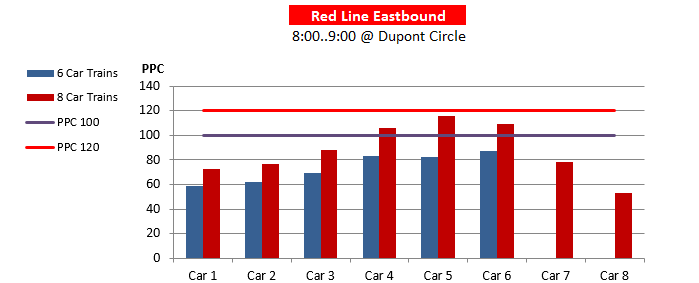
The new version of the Line Load Application now models passengers into trains by cars. Let’s take a look at this new feature!
Remember in May when we said an updated version of the Line Load Application was coming that would include passenger distribution data at max load locations? Well it’s here now!
If you’ve seen Metro employees with clipboards out during rush hour at major stations, then chances are you’ve seen the Metro load checkers. These individuals mark down the loads of these trains. They also mark down any people who didn’t board. Last but not least, they are also doing this by car, and with that information Metro has been keeping track of the spread of the loads on the cars at the max load stations.
Average Car Loads in the AM Peak Hour – October 2014 Weekdays – Modeled Distribution of Passengers at Dupont Circle **The estimated railcar crowding is based on the scheduled Red Line service.
The Northern Virginia Transportation Commission is looking for ideas for Route 7.
The Leesburg Pike (Route 7) corridor in Northern Virginia is second only to Columbia Pike in its daily volumes of bus riders. This busy, mixed use corridor connects Alexandria, Arlington, Fairfax County, and the City of Falls Church. The corridor connects many vital regional activity centers including Old Town Alexandria, Seven Corners, downtown Falls Church (Broad Street) and Tysons Corner.
In 2009, in recognition of the importance of this corridor, Metro completed an evaluation of the 28A and 28B lines, and concluded that there was a demand for a robust, limited stop service on Leesburg Pike. The study acknowledged that by 2040, population in the corridor is anticipated to increase by 36% and the number of jobs is anticipated to increase by 34% . These changes will mean that without more high quality transit, vehicle congestion will only increase. The study also identified heavy congestion as a major impediment to consistent, on-time performance and recommended traffic signal improvements and queue jumps at targeted intersections. As a result of the study, frequencies were increased on 28A and a limited stop service (28X) was introduced to serve the heaviest traveled portions of the route. Read more…


Recent Comments