Metrorail Ridership Data Download, October 2015
New data download features rail ridership by origin, destination, day of week, and quarter-hour intervals.
As you’ve probably noticed, it’s been a while since we’ve released a fresh batch of Metrorail ridership data. Continuing the spirit of openness, we have recently uploaded data from October 2015 in CSV format. (The number of rows is too great for Microsoft Excel).
- Rail ridership by Origin-Destination, day of week and quarter-hour interval. (zipped CSV, 22MB)
This new dataset includes day of week data, so you can begin to investigate impacts of evolving workplace policies such as compressed work schedules. You can also compare it to October 2014.
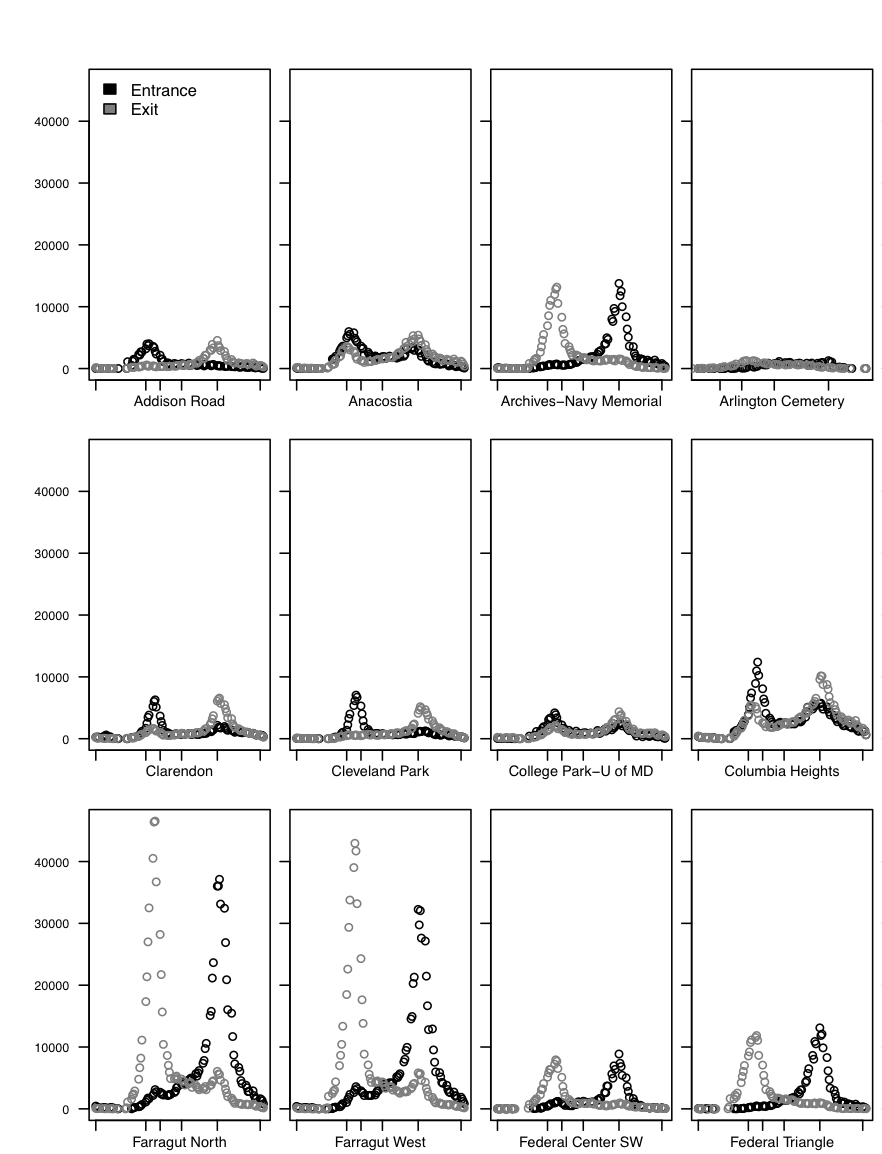
In the past, we have seen a lot of innovative analyses of the data we share. Perhaps the best so far was a visualization of Metrorail station entries and exits by station by “BioNrd” aka “Mike.” What else can we learn from this dataset?


The great thing about R is once you have the code…you can regenerate the plots with fresh data:
http://imgur.com/a/Un48l
Does WMATA use data like this to determine how escalators should run when there’s 3 or more? For example, at L’Enfant Plaza, 7th & Maryland, I think that there’s always two escalators up and one down, even though in the afternoon rush there’s way more people heading down than up.
@Dave , Metro has a policy of favoring the up direction for our escalators because people tend to trickle into stations but they exit in train-loads.
@Mike L. Great plots!
What is the AVG_TRIPS column (and why is it always an integer — averages usually aren’t, right)? Would it be possible to get the same columns as the 2014 data?
@Jefrey AVG_TRIPS is just what it says, the average number of trips. We rounded them to be integers.
I can see about releasing the 2014 data and will follow up via email.
Thanks
@Michael
OK, so this is equivalent to the AvgRidership number in the 2014 data? It’s kind of a bummer to lose the precision since 60% of the entries (for the 15min interval set) have AVG_TRIPS numbers less than 1.
Oh, and the 2014 data I’m talking about is already released (and linked in the original post), but that set has additional columns. I was wondering if we get those columns (NumberRiderSUM, for example), for the 2015 data.
Thank you!
@Jefrey The 2014 data was extracted using a web-based tool that made it difficult to do large data extracts. Since then we’ve gained access to SQL-level data store of the same data so we can now easily rerun queries and export huge result sets directly to text files. Rounding the data does remove a lot of those OD pairs / intervals where AVG_TRIPS was less than 0.5 but on the flip size it greatly reduces the amount of data exported and allows us all to focus on the much larger movements in the system. I look forward to seeing what you can learn from this data set.
Michael & Team,
I was hoping to use these data to assess the impact of the new earlier closing proposal. Since the file is too large to open in Excel, I started by breaking it into three CSVs under the size limit, then sorting by day of week. I put together a workbook with just the Saturday numbers, but the ridership sum did not pass the sanity test. The total was over 600,000, and I know weekend ridership is well below that mark. Is this a side effect of the rounding? I’m noticing lots and lots of 1s in the ridership column, so I’m guessing a lot of those were rounded up.
Dear Michael and planitmetro team,
Hi, this is Ed Rosenthal from Temple University. Your site is awesome!
I am working on a fare pricing model for rapid-transit systems and as part of my analysis I need to simulate an actual metro system. Your Metro is perfect for my purposes. The single most important set of rail ridership data that I would need is on origin-destination trips. This dataset you shared for October 2015 is helpful; however, I wondered if you had such origin-destination data in a matrix form, in other words, a 91 x 91 Excel table showing, in each cell, the total number of riders for Oct. 2015 (better year, for all of 2015) on that route. So, for example, a cell corresponding to Rosslyn-Metro Center would indicate the number of riders that month (or for 2015) that originated in Rosslyn and got out at Metro Center. Is there any chance that you have, or can easily generate, such a data set? Thanks !!